
Financial Reporting
Through the Lens of a
Property/Casualty Actuary
Kathleen C. Odomirok, FCAS, MAAA
Gareth L. Kennedy, ACAS, MAAA
Cosimo Pantaleo, FCIA, FCAS
EY
© Casualty Actuarial Society, 2020

FINANCIAL REPORTING THROUGH THE LENS OF A PROPERTY/CASUALTY ACTUARY
Foreword
1
FOREWORD
EY was originally retained by the Casualty Actuarial Society (CAS) to write a text on financial
reporting and taxation as it affects reserving and statutory reporting for use in the CAS basic
education process. The CAS had two key objectives for this text:
1. Replace a number of readings that existed on the CAS Syllabus of Basic Education as
of 2011 with a single educational publication.
2. Refine the content of the syllabus material to focus on financial accounting and
taxation topics that are of particular relevance to the property/casualty actuary.
The CAS specified that the text would focus on the learning objectives contained within the
syllabus as of 2011.
This publication has been prepared from an actuary’s lens, highlighting those areas of
financial reporting and taxation deemed to be relevant by the CAS Syllabus Committee and
the authors of this text. The learning objectives contained within the 2011 syllabus provided
the underlying direction of the content contained herein. Further, the core content was
originally developed based on the NAIC Annual Statement Instructions in 2011.
Subsequently, EY was requested to update the original textbook to:
Ø Add specific examples to illustrate differences between SAP and GAAP
Ø Include tax implications of investment strategies
Ø Reflect the new tax law enacted in the U.S. in December 2017
Ø Bring IFRS and Solvency II current (to 2018) and include discussion of the NAIC’s Own
Risk and Solvency Assessment (ORSA)
Ø Bring Schedule F current (to 2018)
Ø Provide discussion as to why companies use intercompany pooling arrangements and
their impact on surplus
Ø Reflect any resolution of discrepancies between the NAIC’s written and electronic
instructions for risk-based capital (RBC) regarding Asset Risk associated with
insurance company subsidiaries
Ø Bring the Canadian chapter current (to 2018)
Ø Reflect comments and questions received by the CAS from candidates and others, as
well as errata previously submitted
This version of the text reflects the above specified changes. In doing so, we have updated the
Annual Statement for Fictitious Insurance Company to 2018. No other changes have been
incorporated, other than minor typographical edits. Further, we have not accounted for any
changes to the Exam 6 Syllabus, other than those resulting in the above requested updates
from the CAS. The Exam 6 learning objectives and examination material may have changed

FINANCIAL REPORTING THROUGH THE LENS OF A PROPERTY/CASUALTY ACTUARY
Foreword
2
and may continue to change in the future. Therefore, the content of this publication may
need to be updated in the future.
This text does not represent the position of EY or the authors with respect to interpretations
of accounting or tax guidance. Nor is this text intended to be a substitute for authoritative
accounting or insurance regulatory and related guidance issued by the National Association of
Insurance Commissioners (NAIC), American Institute of Certified Public Accountants (AICPA),
Financial Accounting Standards Board (FASB), Governmental Accounting Standards Board
(GASB), Securities and Exchange Commission (SEC), Internal Revenue Service (IRS),
Chartered Professional Accountants Canada (CPA Canada)
1
, International Federation of
Accountants (IFAC), Global Accounting Alliance (GAA), International Financial Reporting
Standards Foundation (IFRS)/International Accounting Standards Board (IASB), or any other
regulatory body. Authoritative guidance from regulatory bodies trumps the writings
contained herein. Furthermore, accounting standards are continuously evolving. As a result,
readers of this text should be aware that the accounting standards referenced in this
publication may have changed since the time of writing. The CAS may request that this
publication be updated to reflect such changes.
While the authors of this publication have taken reasonable measures to verify references,
content and calculations, it is possible that we may have inadvertently missed something. We
would appreciate being informed of any inaccuracies so that an errata sheet(s) may be issued,
and/or future editions of this publication may be corrected.
This publication has been prepared for general informational purposes only, and is not
intended to be relied upon as accounting, tax or other professional advice. It is not intended
to be a substitute for detailed research or the exercise of professional judgement. Neither
Ernst & Young LLP nor any other member of the global Ernst & Young organization can
accept any responsibility for loss occasioned to any person acting or refraining from action as
a result of any material in this publication. Please refer to your advisors for specific advice.
1
In October 2014, the Certified General Accountants Association of Canada (CGA-Canada) joined Chartered
Professional Accountants of Canada (CPA Canada) to complete the integration of the country’s national accounting
bodies. CPA Canada was established the previous year by the Canadian Institute of Chartered Accountants (CICA)
and The Society of Management Accountants of Canada (CMA Canada).

FINANCIAL REPORTING THROUGH THE LENS OF A PROPERTY/CASUALTY ACTUARY
Acknowledgements
3
ACKNOWLEDGEMENTS
The authors of this publication would like to thank the CAS Syllabus Committee for its review
of this publication and feedback provided. Special thanks goes to Sarah McNair-Grove, Laura
Cali, George Levine, Michel Trudeau, Miriam Fisk, Brandon Basken, Stephane McGee, Sarah
Chevalier and Mei-Hsuan Chao who reviewed the various drafts. We would also like to thank
Wendy Germani who spent countless hours creating and editing the 2011 Annual Statement
excerpts for Fictitious Insurance Company. The amount of personal time spent by these
individuals demonstrates their tremendous dedication to the actuarial profession.
The authors would also like to acknowledge those individuals within EY who assisted us by
creating certain content, tables and exhibits and performing editorial reviews. These
individuals include Dave Osborn, Kishen Patel, and Yan Ren. Particular credit goes to David
Payne, who rewrote Chapter 19. Risk-Based Capital, Ian Sterling and Mike McComis, who
contributed to Part VI. Differences from Statutory to other Financial/Regulatory Reporting
Frameworks in the U.S., and Liam McFarlane and Shams Munir, who contributed to Part VII.
Canadian-Specific Reporting.
Finally, the authors of this text would like to express their deep gratitude to the actuarial
professionals who have invested their time writing publications for the CAS examination
process. Although this publication will serve as a consolidation of many of the papers formerly
on the Exam 6 Syllabus, we acknowledge the significant contributions that those papers have
made in advancing the actuarial profession, as well as the knowledge of the authors of the
text.
In preparing Financial Reporting through the Lens of a Property/Casualty Actuary, we relied
extensively on the following publications and resources:
PUBLICATIONS
2018 Insurance Expense Exhibit.
American Academy of Actuaries Committee on Property and Liability Financial Reporting,
Statements of Actuarial Opinion on P&C Loss Reserves, Washington, DC: American Academy
of Actuaries, December 2018.
Blanchard, Ralph S., “Basic Reinsurance Accounting — Selected Topics,” CAS Exam Study
Note, Arlington, VA: Casualty Actuarial Society, October 2010,
http://www.casact.org/library/studynotes/6US_Blanchard_Oct2010.pdf.
Canadian Institute of Actuaries, “Educational Note: Premium Liabilities”, http://www.cia-
ica.ca/docs/default-source/2016/216076e.pdf.

FINANCIAL REPORTING THROUGH THE LENS OF A PROPERTY/CASUALTY ACTUARY
Acknowledgements
4
Cantin, Claudette, and Phillippe Trahan. “Study Note on the Actuarial Evaluation of Premium
Liabilities,” Journal of Actuarial Practice, 1999: 7, pp. 5- 72,
http://www.casact.org/library/studynotes/cantin7can.pdf.
Feldblum, Sholom. “Completing and Using Schedule P,” CAS Exam Study Note, Arlington, VA:
Casualty Actuarial Society, 2003, 8th Edition,
http://www.casact.org/library/studynotes/feldblum7usP.pdf.
Feldblum, Sholom. “Reinsurance Accounting: Schedule F,” CAS Exam Study Note, Arlington,
VA: Casualty Actuarial Society, 2003, 8th Edition,
http://www.casact.org/library/studynotes/feldblum7usF.pdf.
Feldblum, Sholom. “Computing Taxable Income for Property-Casualty Insurance Companies,”
CAS Exam Study Note, Arlington, VA: Casualty Actuarial Society, 2007, pp. 1-13,
http://www.casact.org/library/studynotes/7U_Feldblum2007.pdf.
Feldblum, Sholom. “Federal Income Taxes and Investment Strategy,” CAS Exam Study Note,
Arlington, VA: Casualty Actuarial Society, 2007, pp. 1-12,
http://www.casact.org/library/studynotes/7U_Feldblum_Tax2007.pdf.
Feldblum, Sholom, “The Insurance Expense Exhibit and the Allocation of Investment Income,”
CAS Exam Study Note, Arlington, VA: Casualty Actuarial Society, May 1997,
http://www.casact.org/library/studynotes/feldblum7can3.pdf.
Feldblum, Sholom, “IRS Loss Reserve Discounting,” CAS Exam Study Note, Arlington, VA:
Casualty Actuarial Society, 2007, pp. 1-13,
http://www.casact.org/library/studynotes/7U_Feldblum_IRS_2007.pdf.
Insurance Accounting and Systems Association, Property-Casualty Insurance Accounting, 8th
ed., 2003.
MSA Research Inc., “MSA Report on Property & Casualty, Canada,” 2018.
National Association of Insurance Commissioners, Accounting Practices and Procedures
Manual, March 2019.
National Association of Insurance Commissioners, NAIC Insurance Regulatory Information
System (IRIS) Ratios Manual, 2017 edition.
National Association of Insurance Commissioners, Official 2011 NAIC Annual Statement
Blanks, Property and Casualty, 2011.
National Association of Insurance Commissioners, Official 2018 NAIC Annual Statement
Blanks, Property and Casualty, 2018.

FINANCIAL REPORTING THROUGH THE LENS OF A PROPERTY/CASUALTY ACTUARY
Acknowledgements
5
National Association of Insurance Commissioners, Property and Casualty Risk-Based Capital
Forecasting and Instructions, 2018.
Steeneck, Lee R., “Commutation of Claims," CAS Exam Study Note, Arlington, VA: Casualty
Actuarial Society, 1998, pp. 1-26,
http://www.casact.org/library/studynotes/steeneck6.pdf.
Troxel, Terrie T., and George E. Bouchie, Property-Liability Insurance Accounting and Finance.
3rd ed. Malvern, PA: American Institute for Property and Liability Underwriters, 1990.
RESOURCES
Actuarial Standards Board, Canada, http://www.actuaries.ca/ASB/index.cfm.
Website of Office of the Superintendent of Financial Institutions, http://www.osfi-bsif.gc.ca/
• MCT effective January 1, 2018
• The Canadian Annual Statement Blank — P&C
Website of Chartered Professional Accountants Canada (CPA Canada),
https://www.cpacanada.ca/.
Canadian Institute of Actuaries, http://www.actuaries.ca/
• Dynamic Capital Adequacy Testing, Educational Note, November 2017
• Draft Educational Note – Financial Condition Testing, December 2019

FINANCIAL REPORTING THROUGH THE LENS OF A PROPERTY/CASUALTY ACTUARY
Table of Contents
6
TABLE OF CONTENTS
Part I. Introduction ........................................................................................... 8
Chapter 1. Financial Reporting in the Property/Casualty Insurance Industry ......................... 8
Chapter 2. Relevance of Financial Reporting to the Actuary ................................................ 12
Chapter 3. Overview of this Publication .............................................................................. 14
Part II. Overview of Basic Accounting Concepts ................................................ 18
Introduction to Part II ......................................................................................................... 18
Chapter 4. Primary Financial Statements ............................................................................ 19
Chapter 5. Key Accounting Concepts ................................................................................... 22
Part III. SAP in the U.S.: Fundamental Aspects of the Annual Statement ............. 23
Introduction to Part III ........................................................................................................ 23
Chapter 6. Introduction to Statutory Financial Statements .................................................. 24
Chapter 7. Statutory Balance Sheet: A Measure of Solvency............................................... 25
Chapter 8. The Statutory Income Statement: Income and Changes to Surplus .................... 41
Chapter 9. Capital and Surplus Account .............................................................................. 57
Chapter 10. Notes to Financial Statements ......................................................................... 62
Chapter 11. General Interrogatories ................................................................................... 76
Chapter 12. Five-Year Historical Data Exhibit ...................................................................... 83
Chapter 13. Overview of Schedules and Their Purpose........................................................ 93
Chapter 14. Schedule F ..................................................................................................... 110
Chapter 15. Schedule P ..................................................................................................... 150
Part IV. Statutory Filings to Accompany the Annual Statement ........................ 200
Introduction to Part IV ...................................................................................................... 200
Chapter 16. Statement of Actuarial Opinion ...................................................................... 201
Chapter 17. Actuarial Opinion Summary Supplement........................................................ 214
Chapter 18. Insurance Expense Exhibit.............................................................................. 218
Chapter 19. Risk-Based Capital .......................................................................................... 241
Chapter 20. IRIS Ratios ...................................................................................................... 305

FINANCIAL REPORTING THROUGH THE LENS OF A PROPERTY/CASUALTY ACTUARY
Table of Contents
7
Part V. Financial Health of Property/Casualty Insurance Companies in the U.S. . 308
Introduction to Part V ....................................................................................................... 308
Chapter 21. Measurement Tools ....................................................................................... 309
Part VI. Differences from Statutory to other Financial/Regulatory Reporting
Frameworks in the U.S. ................................................................................. 319
Introduction to Part VI ...................................................................................................... 319
Chapter 22. U.S. GAAP, including Additional SEC Reporting ............................................... 320
Chapter 23. Fair Value Under Purchase GAAP ................................................................... 339
Chapter 24. International Financial Reporting Standards................................................... 345
Chapter 25. Solvency II ..................................................................................................... 349
Chapter 26. Taxation in the U.S. ........................................................................................ 357
Part VII. Canadian-Specific Reporting............................................................. 364
Introduction to Part VII ..................................................................................................... 364
Chapter 27. Overview of Financial Reporting in Canada .................................................... 365
Chapter 28. Canadian Annual RETURN .............................................................................. 369
Chapter 29. Financial Health of Property/Casualty Insurance Companies in Canada .......... 386
Part VIII. The Future of SAP .......................................................................... 400
Introduction to Part VIII .................................................................................................... 400
Chapter 30. The Future of Financial Reporting and Solvency Monitoring of Insurance
Companies........................................................................................................................ 401
Appendices .................................................................................................. 427
Appendix I. Fictitious Insurance Company
Excerpts from the 2018 Annual Statement for Fictitious Insurance Company
Excerpts from the 2018 Insurance Expense Exhibit for Fictitious Insurance Company
2018 Statement of Actuarial Opinion for Fictitious Insurance Company
2018 Actuarial Opinion Summary for Fictitious Insurance Company
Results of IRIS Ratio Tests for Fictitious Insurance Company
Appendix II. Canadian Financial Statements
2018 Balance Sheet for all Property/Casualty Insurance Companies
2018 Income Statement for all Property/Casualty Insurance Companies

FINANCIAL REPORTING THROUGH THE LENS OF A PROPERTY/CASUALTY ACTUARY
Part I. Introduction
8
PART I. INTRODUCTION
CHAPTER 1. FINANCIAL REPORTING IN THE PROPERTY/CASUALTY INSURANCE
INDUSTRY
IMPORTANCE AND OBJECTIVES OF FINANCIAL REPORTING
Financial reporting serves as a means to communicate a company’s financial results and
health. Financial reporting is accomplished through a series of financial statements that
consolidate a company’s transactions and events into a summarized form under specified
accounting rules. The purpose of these rules is to provide companies with a framework for
measuring and recording transactions and the related revenue, expenses, assets and
liabilities on a consistent basis.
Financial reports enable stakeholders and regulators to track financial performance, compare
a company’s performance to others and make informed financial decisions under a set of
common rules. The stakeholders of an insurance company include policyholders, claimants,
investors, directors of the board and company management. The regulators primarily include
state governmental authorities, as we shall see below.
OVERVIEW OF THE BASES OF FINANCIAL REPORTING (STATUTORY, GAAP, IFRS, TAX,
CANADIAN) AND DIFFERENCES IN TERMS OF USE
The accounting standards that govern financial reporting for insurance companies are
numerous and complex. As we write this publication these standards are evolving, and this
evolution is resulting in much debate among industry participants. Regardless, the intent of
accounting standards is to promote a consistent framework for reporting insurance company
transactions such that comparisons of financial performance and health of insurance
companies can be made within the industry.
In the U.S., insurance companies are regulated by the individual state governments within
which they are licensed to transact business. Within each state government there is an
insurance division led by an insurance commissioner, director, superintendent or
administrator (commissioner). The National Association of Insurance Commissioners (NAIC)
serves as an organization of state regulators that facilitates and coordinates governance
across the U.S. The NAIC itself is not a regulator; regulatory authority remains with the
individual states. Therefore, model laws and regulations established by the NAIC are not law;
individual states have the authority to decide whether to adopt NAIC model laws and
regulations.

FINANCIAL REPORTING THROUGH THE LENS OF A PROPERTY/CASUALTY ACTUARY
Part I. Introduction
9
Statutory Accounting Principles (SAP) is a framework of “accounting principles or practices
prescribed or permitted by an insurer’s domiciliary state.”
2
Most insurance companies are
licensed to transact business in more than one state. Having to follow the accounting rules
and regulations of each state in which the company is licensed can be cumbersome and result
in inconsistent reporting practices. To minimize the varying complexities of different rules
and facilitate commonality in reporting practices, the NAIC adopted Codification of SAP
effective January 1, 2001. Codification does not prevent individual state regulation but
rather provides a common set of principles that individual states can follow to ease the
regulatory burden on companies and promote consistency.
Statements of Statutory Accounting Principles (SSAPs) are published by the NAIC in its
Accounting Practices and Procedures Manual. The manual includes more than 100 SSAPs and
references related statutory interpretations, NAIC model laws and actuarial guidelines which
collectively serve as the basis for preparing and issuing statutory financial statements for
insurance companies in the U.S. in accordance with, or in the absence of, specific statutes or
regulations promulgated by individual states.
From a financial reporting perspective, regulatory oversight by state governments focuses on
insurance company solvency to ensure that policyholders receive the protection they are
entitled to and claimants receive the applicable compensation for damages incurred. SAP and
associated monitoring tools are intended to provide regulators with early warning of
deterioration in an insurance company’s financial condition. SAP tends to be conservative in
order to provide that early warning. For example, certain illiquid assets are not admitted
(excluded from the balance sheet) under SAP, despite having economic value.
Generally Accepted Accounting Principles (GAAP) provides another set of common rules
under which publicly traded insurance companies and privately held companies report their
financial transactions and operating results. GAAP does have certain specialized rules for
insurance companies, but unlike SAP, this framework is not built on the principle of
conservatism. Rather, the primary focus of GAAP is the presentation of a company’s financial
results in a manner that more closely aligns with the company’s financial performance during
the period. Historically, this has been accomplished by matching revenues and expenses. For
example, under GAAP, expenses incurred by an insurance company in conjunction with
successful acquisition of business are deferred to match the earning of associated premium.
In contrast, under SAP, all costs associated with policy acquisition are expensed at the time
they are incurred by the insurance company.
The Securities and Exchange Commission (SEC) is the authoritative body for establishing
accounting and reporting standards for publicly traded companies in the U.S., including
publicly traded insurance or insurance holding companies. As highlighted on the SEC’s
website, “The mission of the U.S. Securities and Exchange Commission is to protect investors,
2
Preamble to the NAIC Accounting Practices and Procedures Manual, March 2019 version.

FINANCIAL REPORTING THROUGH THE LENS OF A PROPERTY/CASUALTY ACTUARY
Part I. Introduction
10
maintain fair, orderly and efficient markets, and facilitate capital formation.”
3
The SEC has
designated the Financial Accounting Standards Board (FASB) with the responsibility of
developing and establishing GAAP, with the SEC operating in an overall monitoring role. The
FASB is the private organization providing authoritative accounting guidance for
nongovernmental entities.
The Governmental Accounting Standards Board (GASB) is the private organization providing
authoritative accounting guidance for the public sector. According to the GASB’s website, the
GASB “is the independent organization that establishes and improves standards of accounting
and financial reporting for U.S. state and local governments ... the official source of generally
accepted accounting principles (GAAP) for state and local governments.”
4
Although this
publication does not discuss accounting for governmental entities, we note that the
accounting for such entities differs from the accounting for insurance companies. Knowledge
of the GASB as it relates to insurance-related activities of governmental entities is important
for the property/casualty actuary who performs actuarial services for the public sector.
The Internal Revenue Service (IRS) is the U.S. government agency responsible for enforcing
tax laws and collecting taxes. Every business paying taxes in the U.S. must compute taxable
income based on the tax laws passed by Congress and the related regulations issued by the
IRS. For insurance companies, the starting point for taxable income is income determined
under SAP. SAP income is adjusted based on the provisions of the various tax laws and
regulations. While SAP is generally conservative, tax-basis accounting may be more or less
conservative depending on how political and other factors affect tax legislation. While some
adjustments result in a decrease to taxable income (e.g., tax-exempt income), adjustments
specific to the insurance industry tend to focus on the acceleration of income for tax purposes
(e.g., the discounting of loss reserves and the reduction of unearned premiums).
The Canadian Institute of Chartered Accountants is the body in Canada that defines Canadian
Generally Accepted Accounting Principles (CGAAP). At one time, SAP applied to the
preparation of the Annual Return for Canadian-domiciled insurers. However, this is no longer
the case, and the financial statements included in the Annual Return are prepared in
accordance with CGAAP.
Under CGAAP, policy liabilities can be recorded in accordance with accepted actuarial practice
in Canada, which means that the recorded liabilities are discounted to reflect the time value of
money and include a provision for adverse deviation.
3
U.S. SEC, The Investor’s Advocate: How the SEC Protects Investors, Maintains Market Integrity, and Facilitates
Capital Formation, http://www.sec.gov/about/whatwedo.shtml, March 30, 2020.
4
GASB, Facts About GASB,
http://www.gasb.org/cs/BlobServer?blobcol=urldata&blobtable=MungoBlobs&blobkey=id&blobwhere=11758240
06278&blobheader=application%2Fpdf, 2012.

FINANCIAL REPORTING THROUGH THE LENS OF A PROPERTY/CASUALTY ACTUARY
Part I. Introduction
11
International Financial Reporting Standards (IFRS) provide an accounting framework used by
many countries outside the U.S. IFRS are established by the International Accounting
Standards Board (IASB).
IFRS already affects companies in the U.S. that currently have international subsidiaries or
are subsidiaries of IFRS filers. At the time of the writing of this publication, IFRS 4, which
pertains to the recognition and measurement of insurance contracts, permits insurance
companies to report under the current accounting rules of their local country with slight
modifications. An example of one such modification is requiring companies to establish
premium deficiency reserves, as needed, regardless of local requirements. Given the current
lack of a detailed measurement model under IFRS for insurance contracts, one of the key
initiatives of the IASB is the development of a new accounting standard for insurance
contracts. We will discuss the standard developed by the IASB (and the FASB developments in
this area) and how it differs from the measurement of insurance liabilities today.

FINANCIAL REPORTING THROUGH THE LENS OF A PROPERTY/CASUALTY ACTUARY
Part I. Introduction
12
CHAPTER 2. RELEVANCE OF FINANCIAL REPORTING TO THE ACTUARY
IMPORTANCE AND OBJECTIVES OF FINANCIAL REPORTING
Actuaries estimate the financial impact of insurable events. As such, actuaries need to
understand the accounting rules under which the financial impact is being reported. Consider
the actuary providing an estimate of an insurance company’s unpaid claims for purposes of
comparison to recorded loss reserves on the company’s balance sheet. If the balance sheet is
prepared under Statutory Accounting Principles (SAP), then the loss reserves are recorded on
a net of reinsurance basis. If the company’s financial statements are prepared under
Generally Accepted Accounting Principles (GAAP), then the loss reserves are recorded gross
of reinsurance. For comparison purposes, the actuarial estimate of unpaid claims would need
to be prepared on a net basis for SAP and gross basis for GAAP. The actuary might also
provide an estimate of unpaid claims ceded to the company’s reinsurers, for comparison to
the reinsurance recoverable amount recorded as an asset on a GAAP basis.
Actuaries providing estimates of unpaid claims on a SAP basis must also be aware of state
regulations under which the company is recording its loss reserves. For example, while the
National Association of Insurance Commissioners Accounting Practices and Procedures
Manual permits companies to discount workers’ compensation reserves on a tabular basis,
5
certain states have varying requirements with respect to whether and how the tabular
discount is applied. For instance, as of December 31, 2018, the state of Montana permitted
discounting of both workers’ compensation indemnity and medical tabular reserves (excluding
LAE) but required use of a specific interest rate in the calculation (4%).
6
To take this one step further, actuaries issuing Statements of Actuarial Opinion should include
a statement within the opinion stating that the company’s recorded loss and loss adjustment
expense reserves “meet the requirements of the insurance laws of (state of domicile).”
7
The
opining actuary is therefore required to read the state regulations and confirm that the
recorded reserves meet the state laws.
The accounting convention is not only important to the reserving actuary for an insurance
company, but also to actuaries who perform other jobs, including but not limited to the
following:
• Working with regulators to monitor the financial health of insurance companies
5
According to page C-3 of the American Academy of Actuaries, 2018 Property/Casualty Loss Reserve Law Manual,
tabular reserves are defined as “indemnity reserves that are calculated using discounts determined with reference
to actuarial tables that incorporate interest and contingencies such as mortality, remarriage, inflation, or recovery
from disability applied to a reasonably determinable payment stream. This definition shall not include medical loss
reserves or any loss adjustment expense reserves.”
6
American Academy of Actuaries, Property/Casualty Loss Reserve Law Manual, 2018, page 250.
7
NAIC, Annual Statement Instructions Property/Casualty, 2018, page 12.

FINANCIAL REPORTING THROUGH THE LENS OF A PROPERTY/CASUALTY ACTUARY
Part I. Introduction
13
• Pricing and designing insurance products, including development of profit margins
• Determining capital requirements to support the various risks of an insurer
• Evaluating risk transfer of reinsurance contracts
• Assessing reserve adequacy for non-insurance entities, such as organizations that
self-insure or retain a portion of their property/casualty insurance exposures
• Preparing tax returns
• Appraising and valuing insurance companies in merger and acquisitions
For each of the above, the result of the work performed will differ depending on the
accounting framework used, illustrating the need for actuaries in different disciplines to be
knowledgeable about the various accounting and financial reporting frameworks.

FINANCIAL REPORTING THROUGH THE LENS OF A PROPERTY/CASUALTY ACTUARY
Part I. Introduction
14
CHAPTER 3. OVERVIEW OF THIS PUBLICATION
ROADMAP
This publication begins with an overview of basic accounting concepts (Part II. Overview of
Basic Accounting Concepts) and then delves into the fundamental aspects of the statutory
Annual Statement and certain supplemental filings, that provide the means for financial
reporting in the U.S. under Statutory Accounting Principles (SAP) (Part III. SAP in the U.S.:
Fundamental Aspects of the Annual Statement and Part IV. Statutory Filings to Accompany
the Annual Statement). Measurement tools used to evaluate the financial health of a
property/casualty insurance company are discussed in Part V. Financial Health of
Property/Casualty Insurance Companies in the U.S. These tools are particularly important to
regulators in monitoring solvency for the purpose of protecting the stakeholders of an
insurance company. We then investigate differences between statutory reporting and other
financial reporting frameworks in the U.S., namely Generally Accepted Accounting Principles,
International Financial Reporting Standards and tax accounting in Part VI. Differences from
Statutory to other Financial/Regulatory Reporting Frameworks in the U.S. We move on to
Canada to provide a discussion of Canadian accounting principles (Part VII. Canadian-Specific
Reporting). The publication closes with a discussion of the future of SAP and evolution of new
accounting frameworks, differentiating between what is “real” and what is only in the
discussion phase at the time of publication of this text (Part VIII. The Future of SAP).
ANNUAL STATEMENTS REFERENCED THROUGHOUT THE PUBLICATION
The Casualty Actuarial Society (CAS) Syllabus Committee and authors of this publication
agreed that it would be helpful for students studying for the CAS exams to be able to rely as
much as possible on one insurance company throughout the publication to illustrate the major
concepts. For the U.S. examples, the CAS Syllabus Committee has assisted us in creating
excerpts of a 2011 Annual Statement for a fictional insurance company named Fictitious
Insurance Company (Fictitious). The excerpts of this statement are contained in Appendix I of
this publication.
We have relied on the Annual Statement excerpts for Fictitious for the more detailed
examples and calculations. We also referenced the National Association of Insurance
Commissioners 2011 Property and Casualty Annual Statement Blank, which was also included
on the CAS Exam 6 U.S. Syllabus at the time this publication was originally written. We have
updated the dates in the Fictitious Annual Statement to year-end 2018, as well as specific
schedules noted in the Foreword of this edition. We recommend that the current version of
the Annual Statements (Blank and those for specific companies referenced on the current
Exam 6 U.S. Syllabus) be viewed side by side with this publication when reading and working
through examples and following the flow of exhibits, notes, interrogatories, and schedules
within the Annual Statement.

FINANCIAL REPORTING THROUGH THE LENS OF A PROPERTY/CASUALTY ACTUARY
Part I. Introduction
15
For Canada, we have used the 2018 aggregate experience of Canadian insurers as published
on the website of the Office of the Superintendent of Financial Institutions (OSFI). As with the
U.S. chapters, we recommend that the student have this information by his or her side when
reading the Canadian chapters of this publication.
We also acknowledge that there may be differences between exhibits within an Annual
Statement; such differences are due to rounding.
BACKGROUND ON FICTITIOUS INSURANCE COMPANY
The authors of this publication felt it important to provide some background information on
Fictitious and describe the landscape in which Fictitious was operating during the time period
covered when the Annual Statement was originally compiled (December 31, 2011). This will
provide additional context for students when reading and interpreting the figures contained
therein.
Fictitious is a publicly held property/casualty insurance company in the U.S. As displayed in
Table 1, approximately one-third of the company’s writings in 2018 were in personal lines
markets, with the remainder in commercial markets. Homeowners multiple peril
(homeowners) was the largest single line written in 2018 on a net of reinsurance basis (17%
of net written premium), followed by workers’ compensation (15% of net written premium)
and other liability — occurrence (13% of net written premium). The company wrote business in
all 50 states in the U.S. and was therefore exposed to natural catastrophes and weather-
related events in 2018.

FINANCIAL REPORTING THROUGH THE LENS OF A PROPERTY/CASUALTY ACTUARY
Part I. Introduction
16
TABLE 1
Fictitious Insurance Co
mpany
Distribution of 201
8
Written Premium (WP) by Line of Business (USD in 000s)
Direct
Direct
Net
Net
WP $
WP %
WP $
WP%
Line of
Business
Personal lines
Homeowners multiple peril
4,646
16%
4,555
17%
Private passenger auto
liability
2,804
10%
2,804
10%
Private passenger auto physical damage
1,661
6%
1,665
6%
Subtotal, personal lines
9,111
32%
9,024
34%
Commercial lines
Fire
3,254
11%
2,484
9%
Commercial multiple peril (non
-
liability portion)
3,243 11% 3,032 11%
Commercial multiple peril (liability portion)
1,760
6%
1,645
6%
Workers’ compensation
4,394
15%
4,022
15%
Other liability
—
occurrence
3,749
13%
3,502
13%
Commercial auto liability
2,334
8%
2,250
8%
Commercial auto p
hysical damage
651
2%
647
2%
Fidelity
138
0%
146
1%
Subtotal, commercial lines
19,523
68%
17,728
66%
Total
28,634
100%
26,752
100%
Insurers were hit hard by record levels of catastrophe losses in 2017 and 2018, following a
sustained period of benign activity from 2012 through 2016. Headline events included
hurricane activity in North America (Harvey, Irma and Maria in 2017; Florence and Michael in
2018) and Japan (Jebi, Trami and Mangkhut in 2018). California saw its most costly wildfire
season for the second year running, with the Camp Fire alone leading to approximately $10
billion of insured losses.
2017 events in the U.S. are estimated to have cost the (re)insurance industry approximately
$106 billion, with a further $50 billion in 2018, significantly exceeding the prior 10-year
average of just under $20 billion.
8
As we shall see through examination of the company’s 2018 Annual Statement, Fictitious did
not escape the financial impact of the natural catastrophes in the U.S., but surprisingly was
relatively unscathed by the events in 2017. During 2018, Fictitious experienced a net loss
from underwriting of $2 million, largely due to events including Hurricanes Florence and
Michael and the California wildfires. The company’s net loss and loss adjustment expense
(LAE) ratio for accident year 2018 was about 10 percentage points higher than that for
accident year 2017.
8
https://www.iii.org/article/spotlight-on-catastrophes-insurance-issues, December 20, 2019

FINANCIAL REPORTING THROUGH THE LENS OF A PROPERTY/CASUALTY ACTUARY
Part I. Introduction
17
When reading this publication and reviewing the 2018 Annual Statement for Fictitious
Insurance Company, note that Fictitious tightened its underwriting standards in reaction to
the soft insurance market in commercial lines.
9
Despite the company’s efforts, soft market
conditions also contributed to the increasing loss and LAE ratio in 2018.
9
A soft market is one where insurance prices are low and therefore insurance is cheaper for the consumer. The
insurance industry tends to observe increasing loss ratios in a soft market because the consumer is paying less in
premiums for the same level of insurance protection.

FINANCIAL REPORTING THROUGH THE LENS OF A PROPERTY/CASUALTY ACTUARY
Part II. Overview of Basic Accounting Concepts
18
PART II. OVERVIEW OF BASIC ACCOUNTING CONCEPTS
INTRODUCTION TO PART II
Part II of this publication will provide a detailed discussion on the construction, use and
interpretation of an insurance company’s financial statements and other financial
information. Before beginning that detailed discussion, we will introduce two important
accounting topics: primary financial statements and key accounting concepts. Both are
recurring topics throughout this publication, and a basic understanding will be helpful to
students.

FINANCIAL REPORTING THROUGH THE LENS OF A PROPERTY/CASUALTY ACTUARY
Part II. Overview of Basic Accounting Concepts
19
CHAPTER 4. PRIMARY FINANCIAL STATEMENTS
PRIMARY FINANCIAL STATEMENTS
Although there are numerous accounting frameworks, they generally rely on a few primary
financial statements. Of these, the two most commonly referenced are the balance sheet and
the income statement. Other primary financial statements include the statement of capital
and surplus (or equity) and the statement of cash flow. The financial statements are
accompanied by subsequent pages of notes, which provide additional information that helps
explain balances within the financial statements.
BALANCE SHEET
The balance sheet presents all of a company’s assets and liabilities as of a specific point in
time. Assets are defined as resources obtained or controlled by a company as a result of past
events that have a probable future economic benefit to the company. Liabilities are probable
sacrifices of economic benefits arising from present obligations of a company to transfer
assets or provide services to other entities in the future as a result of past events. The
relationship between the assets and the liabilities of a company is important, because it is a
measure of the company’s ability to use its assets to fully satisfy its liabilities. The difference
between assets and liabilities is generally referred to as net worth (or equity); in the case of
an insurance company reporting under Statutory Accounting Principles (SAP), this difference
is referred to as statutory surplus (or policyholders’ surplus)
10
.
One unique aspect of insurance companies’ balance sheets is the inherent uncertainty
associated with the estimation of the liability for unpaid claims and claim adjustment
expenses (loss reserves). While a certain amount of estimation is involved in other industries’
accounting, the more significant estimates are generally with respect to asset valuation and
collectability and pale in comparison to the uncertainties involved in estimating loss reserves.
Actuaries typically have an important role in valuing insurance company liabilities and are
therefore critical to the accurate preparation of the balance sheet.
INCOME STATEMENT
While the balance sheet presents the financial balances of a company at a point in time, the
income statement reveals a company’s financial results during a specific time period. The
general types of accounts that are used as a means to measure these results are revenue and
expenses. Revenues are inflows or enhancements of assets or settlement of liabilities (or a
combination of both) from delivering goods or services during the specific time period.
Expenses are outflows or other use of assets or incurrence of liabilities (or a combination of
10
Note that the assets reflected in this relationship only include “admitted" assets because Statutory Accounting
Principles (SAP) do not allow insurers to take credit for nonadmitted assets in surplus. Admitted versus
nonadmitted assets are discussed later in this text.

FINANCIAL REPORTING THROUGH THE LENS OF A PROPERTY/CASUALTY ACTUARY
Part II. Overview of Basic Accounting Concepts
20
both) from delivering or producing the goods and services that were provided during the
specific time period. The difference between the amount of the revenues and expenses during
the period is referred to as net income if it is positive or net loss if it is negative.
The nature of the service provided by insurance companies, which is a promise to pay claims
in the future if some specific criteria are met, creates unique accounting challenges.
Insurance accounting standards address how to earn the premiums insurance companies are
paid and how to measure and when to record claim costs resulting from the insurance
coverage. Again, actuaries usually play a significant role in the estimation of the amount and
timing of these future payments and therefore are critical to the accurate preparation of the
income statement. Another important source of revenue for insurance companies is
investment income, which will be discussed in Chapter 8. The Statutory Income Statement:
Income and Changes to Surplus.
CAPITAL AND SURPLUS
The statement of capital and surplus reflects certain changes in surplus that are not recorded
in the income statement and reconciles the beginning surplus to the ending surplus for the
reporting period. This statement is similar for insurance companies and for other types of
companies; however, there are several items within the statement of capital and surplus, such
as those related to nonadmitted assets and the provision for reinsurance, that are unique to
insurers. These items and others will be discussed in Chapter 7. Statutory Balance Sheet: A
Measure of Solvency and Chapter 8. The Statutory Income Statement: Income and Changes to
Surplus.
CASH FLOW
The cash flow statement receives less attention but is also important. This financial statement
is necessary because the timing of the receipt or payment of cash for a revenue or expense
does not necessarily coincide with the recognition of that revenue or expense from an income
statement perspective. In other words, even if the cash payment is received sometime before
or sometime after the good or service is provided, the associated revenue is generally
recognized at the time the good or service is provided. The cash flow statement presents all
operations strictly from a cash perspective.
In other industries, companies face liquidity issues when they cannot collect revenue in cash
on a timely basis, and this type of liquidity issue would be made evident by the statement of
cash flows. An example of this would be a manufacturing company that sold products on
credit but was not able to collect the cash on a timely basis to pay their expenses. For
insurance companies, this specific type of liquidity issue is less likely to occur due to the
collection of premiums at the onset of the policy and the subsequent payment of losses. This
difference in the order of cash receipts and disbursements somewhat diminishes the
importance of cash flow statements for insurance companies. Further, actuaries are not

FINANCIAL REPORTING THROUGH THE LENS OF A PROPERTY/CASUALTY ACTUARY
Part II. Overview of Basic Accounting Concepts
21
generally involved in or necessary for the preparation of the cash flow statement, so this
financial statement is not covered in detail in this publication.
NOTES TO FINANCIAL STATEMENTS
In addition to the four primary financial statements already discussed, another important
element is the notes to financial statements. The notes include quantitative and qualitative
disclosures regarding the significant accounts presented in the financial statements. This
includes matters that are relevant or may be relevant to the users of the financial statements.
For instance, the notes will typically describe the basis of accounting used in the preparation
of the financial statements, as well as any important details on specific aspects of the
financial statements that are based on estimates or subject to uncertainty. We will discuss
several of the footnotes to the financial statements that are of specific importance to
actuaries in Chapter 10. Notes to Financial Statements.

FINANCIAL REPORTING THROUGH THE LENS OF A PROPERTY/CASUALTY ACTUARY
Part II. Overview of Basic Accounting Concepts
22
CHAPTER 5. KEY ACCOUNTING CONCEPTS
Throughout each major accounting framework, there are several common key concepts.
Understanding these key concepts will be beneficial to anyone who is involved in using or
preparing financial statements because it will allow them to appreciate the purposes of and
the differences between each framework. A few of the most important and relevant concepts
are below.
• Liquidation vs. going concern: When preparing financial statements, it is possible to
view the company as either an ongoing business (going concern) or as a run-off of the
current assets and liabilities (liquidation). Either perspective may be appropriate
depending on the user and purpose of the financial statements. For instance, investors
would generally be most interested in the value of a business as a going concern,
whereas regulators may think in terms of a liquidation perspective, given that they are
primarily interested in the ability of the company to satisfy its policyholder obligations.
• Fair value vs. historical cost: There are often multiple possible approaches to valuing a
given asset or liability. The choice of approach is of particular importance when the
value of that asset or liability is uncertain. Recording an asset or liability at fair value
means recording it at a value that it would be bought or sold for in the open market,
while recording at historical cost means valuing it at the original purchase price less
depreciation. In cases where the value of an asset or liability is uncertain, there is a
trade-off between the reliability of the historical cost method (in that it is objectively
verifiable) and accuracy of the fair value approach (in that it is more consistent with
the actual market value).
• Principle-based vs. rule-based: Each aspect of any accounting framework is generally
guided by either a principle or a rule. A principle describes a general accounting
approach that must be interpreted and applied, while a rule provides specific
accounting guidance on how something should be done. There is a trade-off because
the rules-based guidance may be easier to understand and to audit, but a principles-
based approach is generally more adaptable to changes in the business environment.

FINANCIAL REPORTING THROUGH THE LENS OF A PROPERTY/CASUALTY ACTUARY
Part III. SAP in the U.S.: Fundamental Aspects of the Annual Statement
23
PART III. SAP IN THE U.S.: FUNDAMENTAL ASPECTS OF THE ANNUAL
STATEMENT
INTRODUCTION TO PART III
In the U.S., property/casualty insurance companies report their financial results to state
insurance regulators in what is called the Annual Statement. For those who have never used
or seen an Annual Statement, it is an 8.5” x 14” book. The Property/Casualty Annual
Statement is identified by its yellow cover, while the Life Annual Statement’s cover is blue
(known as the yellow book and blue book, respectively). Both types of Annual Statements are
publicly available documents.
The Annual Statement is developed and maintained by the National Association of Insurance
Commissioners and is often referred to as “the Blank.” The Blank is the template that
insurance companies use to report under Statutory Accounting Principles (SAP), and is
uniformly adopted by all states. This allows insurance companies licensed in multiple states to
prepare one Annual Statement for filing with all states. The Annual Statement is accompanied
by NAIC instructions that are generally adopted by all states, though there are instances of
specific differences and exceptions.
The first page in the Annual Statement is the Jurat page, which provides basic information
about the reporting entity, such as name, NAIC code, address, name of preparer and title, and
officers of the reporting entity. The notarized signatures of officers of the reporting entity are
included on this page, attesting to the accuracy of the information contained therein.
Following the Jurat page are the statutory financial statements. The statutory Annual
Statement contains other exhibits and schedules that provide further insight into the
insurance company’s statutory financial statements and historical experience. These include
General Interrogatories; Five-Year Historical Data; and Schedules A, B, BA, D, DA, F, P, T and
Y.
In Part III. SAP in the U.S.: Fundamental Aspects of the Annual Statement, we will walk
through the Property/Casualty Annual Statement, beginning with the financial statements,
and discuss the related accounting requirements. We provide examples to illustrate the uses
of the Annual Statement and how certain amounts are calculated and compiled.

FINANCIAL REPORTING THROUGH THE LENS OF A PROPERTY/CASUALTY ACTUARY
Part III. SAP in the U.S.: Fundamental Aspects of the Annual Statement
24
CHAPTER 6. INTRODUCTION TO STATUTORY FINANCIAL STATEMENTS
INTRODUCTION
This chapter focuses on Statutory Accounting Principles (SAP) and specifically discusses the
fundamental aspects of the Annual Statement, including the financial statements themselves
(the balance sheet and income statement, for example), as well as the other exhibits and
filings that accompany the Annual Statement (such as various schedules, the Insurance
Expense Exhibit and the Risk-Based Capital calculation). Part V. Financial Health of
Property/Casualty Insurance Companies in the U.S. will discuss how this information can be
used to assess the financial health of an insurance company and Part VI. Differences from
Statutory to other Financial/Regulatory Reporting Frameworks in the U.S. will focus on
differences between SAP and the other financial and relevant regulatory reporting regimes.
SAP AND THE NAIC
The National Association of Insurance Commissioners (NAIC) operates through various
committees that comprise state insurance commissioners and their staff. Through these
committees, the NAIC regularly updates SAP and creates model insurance laws and
regulations that individual states may elect (or be required) to adopt. While this generally
leads to a good deal of uniformity in insurance regulation, there are still instances of
differences between states. For example, individual states have the ability to permit
accounting practices that differ from NAIC SAP (“permitted practices”) and model laws and
regulations are not always enacted by all states exactly as adopted by the NAIC.
It is worth noting that the NAIC may revise the Annual Statement each year, and these
changes are described on the NAIC website. The basis of the examples and exhibits provided
in this section of the publication are based in part on the structure and information provided
in the 2011 industry Annual Statement, with specified updates based on the 2018 Annual
Statement as noted in Foreword of this publication.
11
11
Accessed via a sector-specific information and research firm in the financial information marketplace.

FINANCIAL REPORTING THROUGH THE LENS OF A PROPERTY/CASUALTY ACTUARY
Part III. SAP in the U.S.: Fundamental Aspects of the Annual Statement
25
CHAPTER 7. STATUTORY BALANCE SHEET: A MEASURE OF SOLVENCY
As previously noted, the primary focus of statutory accounting is to highlight potential
solvency issues (an insurance company’s capability to meet its obligations to its policyholders
and creditors when due). Consequently, the most important aspect of an insurance company’s
financial statements to an insurance regulator is the strength of its balance sheet (i.e., the
extent to which its admitted assets are sufficient to meet all liabilities).
RELEVANCE TO ACTUARIES
Solvency and the balance sheet are relevant to the actuary for two primary reasons.
First, actuaries traditionally have some responsibility for the loss and loss adjustment expense
(LAE) reserves, which represent the majority of the liabilities for property/casualty insurance
companies. Actuaries may either participate directly in the reserve-setting process, or they
may assess the reasonableness of the reserves established by company management.
Actuaries involved in either of these functions are focused on the liabilities for losses and LAE
on the Liabilities, Surplus and Other Funds page of the Annual Statement (page 3).
Second, actuaries often have a role in determining or assessing the amount of capital that an
insurance company requires to support the risks that it has taken through its business
operations. In the context of statutory accounting, this would be based on an actuary’s
understanding of the Risk-Based Capital (RBC) framework to calculate the required capital at
a given point in time (see Chapter 19. Risk-Based Capital). More broadly speaking, actuaries
may evaluate the surplus needs on other bases, including on an economic basis, which is
guided by the insurer meeting some economically defined criteria for solvency. In both of
these cases, an actuary who is evaluating an insurance company’s capital will need to be
familiar with the admitted assets and the liabilities on the balance sheet (pages 2 and 3), as
well as the risk characteristics of each of those items.
This chapter will provide an overview of the composition of the two main categories in the
statutory balance sheet:
• Assets (page 2)
• Liabilities, Surplus and Other Funds (page 3)
ASSETS
12
Assets can be broadly defined as a property, right or claim arising from past events that has
future value. From an individual perspective, we are all accustomed to the concept of owning
12
In general, this section aligns with Chapter 2 (Assets) of Property Casualty Insurance Accounting by the Insurance
Accounting and Systems Association (IASA). References to other sections in IASA that were previously on the CAS
Syllabus will be included throughout. Readers seeking additional detail may consult with IASA on these topics or
other topics.

FINANCIAL REPORTING THROUGH THE LENS OF A PROPERTY/CASUALTY ACTUARY
Part III. SAP in the U.S.: Fundamental Aspects of the Annual Statement
26
financial assets, such as stocks and bonds, and owning real assets, such as a home or vehicle.
Insurance companies own various assets in the same way that an individual does, and those
assets are summarized on page 2 of the Annual Statement Blank (the balance sheet). Some of
these assets are consistent with assets of non-insurance entities, and some are specific to
insurance companies.
Table 2 summarizes the major assets held by the U.S. property/casualty insurance industry as
of December 31, 2018.
13
The first column indicates the numerical label for each item, as
presented on page 2 of the Annual Statement. Only the material line items are shown in this
summary.
13
Accessed via a sector-specific information and research firm in the financial information marketplace.

FINANCIAL REPORTING THROUGH THE LENS OF A PROPERTY/CASUALTY ACTUARY
Part III. SAP in the U.S.: Fundamental Aspects of the Annual Statement
27
TABLE 2
Assets: Total U.S. P&
C Insurance Industry
U.S. 201
8
Statutory Financials, NAIC Format (USD in OOOs)
Line Description Assets
% of
Total
Nonadmitted
Assets
Net Admitted
Assets
% of
Total
1.
Bonds
1,027,815,046
49%
312,840
1,027,502,206
5
1
%
2.1
Preferred
stocks
5,454,309
0
%
7,203
5,447,106
0
%
2.2
Common stocks
395,451,664
19
%
5,734,811
389,716,853
1
9
%
4.
Real estate
13,727,077
1%
43,525
13,683,552
1%
5.
Cash, cash equivalents and
short-term investment 101,993,264 5% 29,624 101,963,640 5%
8.
Other invested assets
149,642,333
7
%
14,765,778
134,876,555
7%
12.
Subtotal, cash and invested
assets 1,725,865,280 83% 22,972,981 1,702,892,299 84%
15.1
Uncollected premiums and
agents balances 66,184,809 3% 3,309,043 62,875,766 3%
15.2
Deferred premiums and
agents balances 121,849,858 6% 316,170 121,533,688 6%
16.1
Amounts recoverable from
reinsurers 42,558,949 2% 4,258 42,554,691 2%
18.2
Net deferred tax ass
et
25,779,026
1
%
6,952,286
18,826,740
1
%
23.
Receivables from parent
,
subsidiaries and affiliates 22,055,541 1% 427,692 21,627,850 1%
25.
Aggregate write
-
ins
33,353,894
2%
10,307,386
23,046,508
1%
Other non
-
invested assets
41,352,758
2
%
9.766,723
31,586,035
2%
Subtotal, non
-
invested
assets 353,134,835 17% 31,083,558 322,051,277 16%
28.
Total
2,079,000,115
100%
54,056,540
2,024,943,576
100%
As shown in Table 2, the U.S. property/casualty industry held $2.1 trillion dollars of assets as
of December 31, 2018. The statutory balance sheet makes two broad distinctions regarding
assets held by insurers:
• Cash and invested assets vs. non-invested assets: Assets are categorized by this
criterion to identify the proportion of an insurer’s asset that is readily convertible to
cash. The “cash and invested assets” are assets that could be readily sold in near term
to meet the insurer’s liabilities, while the “non-invested assets” are less liquid. This
distinction is in line with the emphasis that statutory accounting places on solvency.
Rows 1 through 12 on the Assets page include cash and invested assets, while rows
13 through 25 include non-invested assets.
• Admitted vs. nonadmitted assets: As shown in Table 2, there are separate columns
that depict the amount of assets that are nonadmitted. These nonadmitted assets,
which represent about 3% of total assets, are not recognized by state insurance
departments in evaluating the solvency of an insurance company for statutory

FINANCIAL REPORTING THROUGH THE LENS OF A PROPERTY/CASUALTY ACTUARY
Part III. SAP in the U.S.: Fundamental Aspects of the Annual Statement
28
accounting purposes. The rationale for this exclusion is that those nonadmitted assets
are not readily convertible for use to meet an insurer’s liabilities now or in the future
and thus would not be reasonable to consider in evaluating a company’s solvency. In
many cases nonadmitted assets are determined by formulae established by the
National Association of Insurance Commissioners (NAIC). As shown in Table 2, there
are nonadmitted assets in the cash and invested assets categories and the non-
invested assets categories, though the proportion of nonadmitted assets is much
lower for cash and invested assets. Several common examples of nonadmitted assets
will be discussed in the description of the specific asset classes below (such as certain
uncollected and deferred premiums and agents’ balances and net deferred tax assets),
which will help to demonstrate this point.
Those distinctions aside, it is clear from Table 2 that the largest asset class for the
property/casualty industry in 2018 was bonds, which represented 49% of the industry’s total
assets, followed by common stocks, which represented 19% of the industry’s total assets.
These statistics have remained relatively consistent over the years. While most actuaries will
not need to have a deep understanding of each of the asset classes on the balance sheet, is it
worthwhile to know a few relevant details on the largest classes to have a fundamental
understanding of the balance sheet.
Bonds (Line 1)
Bonds are securities that pay one or more future interest payments according to a fixed
schedule. The face value of a bond refers to the amount that is to be paid in the final single
payment at the maturity of a bond. When an insurance company purchases a bond, the
current value of that bond is recorded as the actual cost, including brokerage and other fees.
This purchase price may be more or less than the face value of the bond.
To the extent that the purchase price is higher (or lower) than the face value of the bond, a
bond premium (or discount) is recorded as a part of the recorded amount. Over the life of the
bond, that bond premium or bond discount will be amortized according to a constant yield
approach. The reason for this amortization is that when the bond ultimately matures, the
amortized value will be equal to the face value, eliminating a lump sum gain or loss at the
maturity of the bond.
After the purchase, statutory accounting indicates that bonds be recorded at one of the
following bases:
• Amortized cost
• The lower of amortized cost or fair value
The designation that the NAIC’s Security Valuation Office (SVO) assigns to the bond
determines the applicability of the two bases above. The six possible designations are NAIC 1

FINANCIAL REPORTING THROUGH THE LENS OF A PROPERTY/CASUALTY ACTUARY
Part III. SAP in the U.S.: Fundamental Aspects of the Annual Statement
29
through NAIC 6, which range from the “highest quality” bonds to “bonds in or near default,”
respectively. Bonds with the two highest designations (NAIC 1 and 2) are carried at amortized
cost, while bonds with designations of NAIC 3 (“medium quality”) and below are carried at the
lower of amortized cost or fair value. The amount at which a bond is recorded, following these
criteria, is referred to as the adjusted carrying value.
Schedule D of the Annual Statement provides details on the specific bonds that are held by an
insurance company, including the following:
• Type of issuer (e.g., federal, state or corporate)
• Maturity (e.g., one year, one year to five years)
• NAIC Class (Class 1 through Class 6)
Based on the industry aggregate Annual Statement as of December 31, 2018, insurance
companies’ bond portfolios were made up of approximately 44% industrial bonds, 24% special
revenue bonds, and 17% U.S. government bonds. By maturity, just over half of bonds held
were 5 years to maturity or less, with the majority of the remainder having maturities
between 5 and 10 years. Furthermore, approximately 80% of bonds held by insurers were in
the NAIC Class 1.
Given that bonds are the largest asset class for property/casualty insurers, an actuary or
other user of the financial statements who is reviewing the financial health of an insurance
company may benefit from reviewing the detail in Schedule D.
Stocks (Lines 2.1 and 2.2)
As shown in Table 2, approximately 19% of insurers’ assets were in common or preferred
stock. Stocks are securities that represent an ownership share in a company. Those
ownership shares are subordinate to bondholders and creditors. Common stock ownership
confers voting privileges and may pay a dividend, though the dividend is not guaranteed.
Preferred stock does not confer voting privileges but usually provides a guarantee on
dividends to be paid, and usually has preference to common stock in the event of liquidation.
At purchase, stocks are valued at cost plus any brokerage or related fees. After purchase,
publicly traded stocks are recorded at fair value, which is based on the market price that is
readily available to the public and which can generally be determined from external pricing
services. If a stock is not publicly traded or a price is not available, the NAIC’s SVO will
determine a fair value. Preferred stocks are assigned similar NAIC designations as bonds with
six rating levels, which dictate whether they are valued at cost, amortized cost or fair value
based on the NAIC designation.
An actuary or other user of the financial statements who is evaluating the financial health of
an insurance company should take note of a property and investigate further if an insurance

FINANCIAL REPORTING THROUGH THE LENS OF A PROPERTY/CASUALTY ACTUARY
Part III. SAP in the U.S.: Fundamental Aspects of the Annual Statement
30
company has a relatively larger portion of their assets in stocks, compared to the overall
industry.
Real Estate (Line 4)
Three classes of real estate are presented separately on the Assets page of the Annual
Statement:
• Properties occupied by the company
• Properties held for the production of income
• Properties held for sale
These classes are relatively self-explanatory, though one detail to be aware of is that if a
company and its affiliates occupy less than 50% of a property, it is classified as either a
property held for production of income or a property held for sale (as opposed to a property
occupied by the company). Properties in the first two categories are generally recorded at
depreciated cost, while properties that are held for sale are recorded at the lower of
depreciated cost (i.e., carrying amount) or fair value less encumbrances and estimated costs
to sell the property.
Details of a company’s real estate transactions and holdings are presented in Schedule A of
the Annual Statement.
Cash, Cash Equivalents and Short-Term Investments (Line 5)
This asset class generally includes assets that are immediately convertible to cash. As of
December 31, 2018, these assets represented nearly 5% of insurers’ total assets, and
approximately two-thirds of these assets were in short-term investments.
Cash equivalents must have an original maturity of less than three months, and short-term
investments must have an original maturity of one year or less. In the Annual Statement,
details on cash are provided in Schedule E-1, cash equivalents are described in Schedule E-2,
and short-term investments are found in Schedule DA. Further, a reconciliation is made in the
Cash Flow statement showing cash, cash equivalents and short-term investments at the
beginning of the year, adjusted for net cash (inflows minus outflows from operations,
investments, financing and miscellaneous sources) during the year. The result is the amount
of cash, cash equivalents and short-term investments at the end of the year, which is shown
in line 5 of the Assets page.
Uncollected and Deferred Premiums and Agents’ Balances (Lines 15.1 and 15.2)
These two asset classes represent premiums that have been written but have not yet been
received. Although the names of the asset classes refer to “agents’ balances” (or balances
due from policies sold by insurance agents, as intermediaries between the insurance company

FINANCIAL REPORTING THROUGH THE LENS OF A PROPERTY/CASUALTY ACTUARY
Part III. SAP in the U.S.: Fundamental Aspects of the Annual Statement
31
and the policyholder), both asset classes may also include uncollected premiums for policies
sold directly to policyholders.
Uncollected premiums and agents’ balances include premiums due on or before the financial
statement date, while deferred premiums and agents’ balances include premiums due after
the financial statement date. Both classes include installment premiums that meet those
timing criteria as well.
Premiums that are more than 90 days past due from an agent or a direct policyholder are
considered nonadmitted assets. Furthermore, an insurer may determine that agents’ balances
that are 90 days or more overdue are unlikely to be collected (or “impaired”). In this event,
the insurer should write-off the uncollectable balance.
These two classes together represented nearly 10% of the industry assets as of December 31,
2018, highlighting that collectability of these assets is relevant to a company’s financial
health and a measure of the efficiency of its collections’ department. An actuary or other user
of the financial statements who is reviewing the financial health of an insurer may consider
the overall magnitude of a company’s uncollected and deferred agents’ balances and the
percentage of agents’ balances that are nonadmitted. Either one of these metrics could be
benchmarked to the overall industry; a company having a significantly higher portion of its
assets in these two classes relative to the industry would warrant further analysis to
understand the impact to liquidity.
Amounts Recoverable from Reinsurers (Line 16.1)
This asset class reflects amounts that are expected to be recovered from a reinsurer on
losses and LAE that have been paid by the company, but do not include expected reinsurance
recoveries for loss and LAE reserves. The reason that expected recoveries for loss and LAE
reserves are not included is that loss and LAE are already reflected net of reinsurance on the
balance sheet. Additional detail on expected recoveries for both paid amounts and reserves
are included in Schedule F, which will be discussed in detail in Chapter 14. Schedule F. The
detail included in Schedule F allows an actuary or other user of the financial statements to
assess the quality and collectability of the reinsurance recoverables.
Net Deferred Tax Assets (Line 18.2)
Deferred tax assets (DTAs) represent expected future tax benefits related to amounts
previously recorded in the statutory financial statements and not expected to be reflected in
the tax return as of the reporting date. They are referred to as “net” DTAs because they are
recorded net of any deferred tax liabilities (DTLs) that exist. Two common sources of DTAs
relevant to the actuary are the following:
• The difference in tax accounting and statutory accounting for loss reserves
• The carryforward of net operating losses from previous years

FINANCIAL REPORTING THROUGH THE LENS OF A PROPERTY/CASUALTY ACTUARY
Part III. SAP in the U.S.: Fundamental Aspects of the Annual Statement
32
The first source of DTAs is particularly relevant to actuaries. For tax reporting purposes, loss
reserves are discounted when determining taxable income. This means that an insurance
company is not able to deduct from taxable income the full amount of losses that are incurred
during a year. Therefore, assuming loss reserves are growing, a company’s income on a tax
basis is higher than the company’s pre-tax income on a statutory basis in the current year. In
the future, as this discounting unwinds, the insurer will get a tax deduction, which will not be
recorded in statutory financial statements because it was already recorded in the year the
reserves were established. The value of this future deduction (21% of the deduction)
represents the DTAs. This asset can be particularly significant for growing companies.
The second source of DTAs of relevance to the actuary (carryforward of net operating losses)
occurs when an insurance company has net operating losses in one financial year and expects
those losses to offset taxable income in the future, thereby reducing future tax liability.
For any DTA, an insurer can only record the portion of the asset that is expected to be
realized, based on available evidence. Furthermore, the insurer must perform an admissibility
test to determine the amount of a DTA that can be considered as an admitted asset.
As shown in Table 2, DTAs were one of the largest components of nonadmitted assets
reported at December 31, 2018, representing $7 billion of the total $54.1 billion in
nonadmitted assets, or 13%.
Receivables from Parent, Subsidiary and Affiliates (Line 23)
Many insurance companies are members of a national or international insurance group or
may be affiliated with other insurance companies that are owned by the same ultimate parent
company. These affiliates often share services or resources, such as internal support staff or
third-party vendor agreements. In these cases, receivable balances for these services or
resources exist between the parties.
As shown in Table 2, these receivables accounted for about 1% of assets held by the industry
at December 31, 2018. If an individual company had a significantly larger portion of their
assets in the form of receivables, a user of those financial statements may consider
investigating further, as those receivables may not be as liquid or available as other asset
types. More specifically, the user could attempt to ascertain the specific source of the
receivables and the proportion of the receivables that are paid on time.
Other Nonadmitted Assets
In addition to the examples of nonadmitted assets already mentioned (agents’ balances more
than 90 days overdue and net DTAs that are do not meet the statutory admissibility test),
there are other sources of nonadmitted assets. Several common examples include:

FINANCIAL REPORTING THROUGH THE LENS OF A PROPERTY/CASUALTY ACTUARY
Part III. SAP in the U.S.: Fundamental Aspects of the Annual Statement
33
• Amounts held of specific types of bonds, stocks, mortgage loans or real estate that are
in excess of limitations that exist in specific states
• Electronic data processing equipment and operating system software in excess of
specified limits (i.e., percentage of adjusted capital and surplus)
• Nonoperating system software
• Furniture, fixtures, equipment and leasehold improvements
• Balances due from a broker when a security has been sold but the proceeds have not
been received that are still outstanding more than 15 days after settlement
• Funds held or deposited with reinsured companies that exceed the associated liabilities
or are held by an insolvent reinsured company
• 10% of deductibles recoverable on high deductible insurance policies in excess of
collateral specifically held and identifiable on a per policy basis
As previously noted, nonadmitted assets only represented about 3% of the total industry
assets at December 31, 2018. However, due to their importance when measuring solvency,
an actuary should be familiar with the sources of nonadmitted assets. If an actuary or other
user of the financial statements observes that an insurer has a larger proportion of
nonadmitted assets than the industry average, it may be worthwhile to investigate further to
understand the source of those nonadmitted assets because they could be indicative of a
problem with the business.
LIABILITIES AND SURPLUS
14
A liability is an obligation that the company must fulfill, based on past events or transactions,
which will require the use of the company’s resources. Under the literal definition of solvency,
a company must have assets that are at least equal to its liabilities to remain solvent.
To be prudent and to comply with RBC requirements (see Chapter 19. Risk-Based Capital),
most insurance companies have admitted assets that significantly exceed their liabilities. The
amount of this excess of admitted assets over liabilities is generally referred to as surplus.
Surplus can be viewed as the equity in the business or as the source of protection to the
policyholders. These three amounts follow the relationship shown below:
Admitted Assets = Liabilities + Surplus
Or, equivalently,
Admitted Assets – Liabilities = Surplus
Because the combination of liabilities and surplus are equal to assets, liabilities and surplus
are presented on the same page (page 3) of the Annual Statement. The assets reflected in the
14
Aligns with IASA Chapter 5.

FINANCIAL REPORTING THROUGH THE LENS OF A PROPERTY/CASUALTY ACTUARY
Part III. SAP in the U.S.: Fundamental Aspects of the Annual Statement
34
relationship above include only admitted assets because Statutory Accounting Principles
(SAP) do not allow insurers to take credit for nonadmitted assets in surplus.
A breakdown of the industry liabilities and surplus amounts (page 3 of the Annual Statement)
by significant account is provided in Table 3 as of December 31, 2018.
15
TABLE 3
Liabilities, Surplus and Other Funds: Total U.S. Property/Casualty Insurance Industry
U.S. 201
8
Statutory Financials, NAIC Format (USD in 000s)
Line Description Liabilities
% of
Total
1.
Losses
547,217,016
27
%
2.
Reinsurance payable on paid loss and loss adjustment expenses
29,393,074
1
%
3.
Loss adjustment expenses
114,072,279
6
%
5.
Other expenses
(excluding taxes, licenses and fees)
8,191,309
0
%
9.
Unearned
premiums
275,398,145
14
%
12.
Ceded reinsurance premiums payable
59,593,117
3
%
13.
Funds held under reinsurance treaties
31,513,557
2
%
16.
Provision for reinsurance
2,745,410
0%
25.
Aggregate
write
-
in for liabilities
77,254,001
4
%
Other liabilities
122,643,849
6
%
28.
Subtotal, liabilities
1,268,021,758
65%
29.
Aggregate write
-
ins for special surplus funds
83,179,182
4
%
30.
Common capital stock
3,982,853
0%
34.
Gross paid in and contributed surplus
197,134,014
10
%
35.
Unassigned funds
459,882,311
23
%
Other surplus and capital
12,743,455
1%
37.
Subtotal, surplus as regards
policyholders
756,921,815
37
%
38.
T
otal
2,024,943,573
100%
First, note that the total amount of liabilities and surplus shown in Table 3 ($2.025 trillion) is
exactly equal to the amount of net admitted assets that were shown in Table 2. This
relationship must be true given the fundamental equation of Admitted Assets = Liabilities +
Surplus.
The next observation that can be made is that the insurance industry’s admitted assets equal
1.6 times its liabilities as of December 31, 2018. On the surface, this suggests that the
industry as a whole had sufficient assets to be able to sustain a sizeable increase in liabilities
(or reduction in asset values) while still maintaining solvency, due to the current positive
difference of assets relative to liabilities.
15
Accessed via a sector-specific information and research firm in the financial information marketplace.

FINANCIAL REPORTING THROUGH THE LENS OF A PROPERTY/CASUALTY ACTUARY
Part III. SAP in the U.S.: Fundamental Aspects of the Annual Statement
35
However, this may not be true at the individual company level, and there are also other risks
that could affect surplus that are not reflected in either the recorded assets, admitted assets
or liabilities (such as catastrophe risk or liquidity risk). An actuary can benchmark a
company’s ratio of liabilities to surplus against the current industry average. Further
investigation may be warranted if the ratio is significantly higher than that of the industry. A
review of the company’s RBC would be the next logical step.
We can also measure each of the underlying accounts in relation to total liabilities or surplus.
Together, loss and LAE reserves (lines 1 and 3) have historically been the largest liability item
on a property/casualty insurance company’s balance sheet. As of December 31, 2018, this
item represented over 50% of total industry liabilities. This speaks to the importance of
property/casualty actuaries to the financial reporting process because they are often the
most suited to evaluate and establish those liabilities. The next largest liability class is
unearned premium reserves, which made up approximately 22% of the industry liabilities as of
December 31, 2018. Given actuaries’ involvement in pricing products, actuaries certainly play
a role in this premium account. To the extent the unearned premium is not adequate to cover
expected future losses, LAE and maintenance expenses, additional liabilities need to be
recorded. Actuaries often play a key role in that analysis.
A brief description of each of the key liabilities and surplus classes is provided below.
Loss and Loss Adjustment Expense Reserves (Lines 1 and 3)
The required basis for loss and LAE reserves under SAP is defined by Statement of Statutory
Accounting Principles (SSAP) 55, Unpaid Claims, Losses, and Loss Adjustment Expenses.
SSAP 55 states that the recorded liabilities for loss and LAE reserves, for each line of
business and for all lines of business in the aggregate, should be based on “management’s
best estimate” (note that this term is not explicitly defined in the accounting guidance).
Further, SSAP 55 requires that management consider the variability in the estimate of these
liabilities. The standard states that management’s best estimate may consider a range of
estimates; in the rare instances when no point within the range is considered to be a better
estimate than other points within the range, the midpoint of the range should be used.
Note that SSAP 55 refers to management’s best estimate and not the actuary’s best estimate
or central estimate. However, management will often rely on an actuary’s estimate, in whole
or in part, in establishing their own best estimate to be recorded on the balance sheet.
Whether or not management relies on an actuary in establishing the recorded reserves, the
NAIC Model Law for Property and Casualty Actuarial Opinions (MDL-745)
16
requires that a
16
NAIC, NAIC, Model Laws, Regulations, Guidelines and Other Resources, – MDL-745, October 2003,
https://www.naic.org/store/free/MDL-745.pdf, 2019.

FINANCIAL REPORTING THROUGH THE LENS OF A PROPERTY/CASUALTY ACTUARY
Part III. SAP in the U.S.: Fundamental Aspects of the Annual Statement
36
Statement of Actuarial Opinion be provided that attests to the adequacy of the recorded
liabilities (see Chapter 16. Statement of Actuarial Opinion).
Significant detail on the loss and LAE reserves is included in Schedule P of the Annual
Statement. Schedule P provides loss and LAE reserves both gross and net, and also breaks
down the total reserves by line of business and accident year. Further detail on the data in
Schedule P and the potential uses of that data are described in Chapter 15. Schedule P. There
are also relevant references to loss and LAE reserves in the Notes to Financial Statements
within the Annual Statement (see Chapter 10. Notes to Financial Statements).
Because loss and LAE reserves are often the largest most variable liability on an insurer’s
balance sheet, they are of critical importance to the financial health of an insurance company.
Reinsurance Payable on Losses and Loss Adjustment Expenses (Line 2)
Reinsurance payable on losses and LAE includes liabilities related to assumed reinsurance
contracts and is for loss and LAE that have already been paid by the reinsured. A detailed
breakdown of this amount by type of reinsurer (e.g., affiliated, authorized and unauthorized
as well as U.S. and non-U.S.) is provided in Schedule F, Part 1, column 6. Liabilities under
assumed reinsurance contracts for loss and LAE that are reserved by the reinsured, but not
paid, are included in lines 1 and 3 of the Liabilities, Surplus and Other Funds page (loss and
LAE reserves).
Other Expenses (Excluding Taxes, Licenses and Fees) (Line5)
In general, an insurance company’s expenses can be separated into two broad categories:
LAE and underwriting and investment expenses. Further divisions can be made within each
category. The underwriting and investment expense category can be further divided into the
following subcategories:
• Commission and brokerage expenses
• Taxes, licenses and fees
• General and administrative expenses
• Investment expenses
The other expenses liability item on the balance sheet generally represents incurred but not
yet paid expenses from the third and fourth categories listed above. Additional detail on these
expenses can be found in the Underwriting and Investment Exhibit (U&IE), Part 3, Expenses,
where the unpaid expenses are shown on line 26. Although this exhibit does not provide the
breakdown of the unpaid expenses by expense category, the total incurred expenses during
the calendar year for these other expenses are included on lines 3 through 18.
An additional observation from U&IE, Part 3 is that each category of other underwriting
expenses is split between column 1 (Loss Adjustment Expenses), column 2 (Other

FINANCIAL REPORTING THROUGH THE LENS OF A PROPERTY/CASUALTY ACTUARY
Part III. SAP in the U.S.: Fundamental Aspects of the Annual Statement
37
Underwriting Expenses) and column 3 (Investment Expenses). This is based on an allocation
that is performed by the company, and that allocation determines whether unpaid amounts in
these categories appear on the balance sheet as LAE reserves or as other expenses liabilities.
Additional discussion regarding other expenses is provided in Chapter 8. The Statutory
Income Statement: Income and Changes to Surplus. Further detail regarding the allocation of
expenses by category is also provided in the following chapter (Chapter 18. Insurance
Expense Exhibit).
Unearned Premiums (Line 9)
Unearned premium represents a liability related to the unexpired portion of all policies in
force. For any individual in-force policy, the total amount of written premium can be
separated into earned and unearned portions. In the simplest and most common case, this
split is made by the number of coverage days in the total policy period that are expired or
unexpired, respectively. This approach is referred to as the daily pro rata method and is the
standard method used for lines such as automobile insurance, homeowners, general liability
or property.
Another approach that is sometimes used is called the monthly pro rata method. This method
assumes that policies are written evenly over the course of the month. Based on that
assumption, 1/24 of the premium written in a given month is expected to earn in that month.
Subsequent to that, 1/12 is expected to be earned in the next 11 months, and the remaining
1/24 is earned in the thirteenth month. This abbreviated method allows for a calculation of
the earned premium in each month with less data and calculations.
Some specific types of coverage require different approaches to calculating earned premium
(e.g., title insurance, financial guaranty and ocean marine).
The unearned premium reserve serves the important purpose of recognizing revenue over the
time period the policy is in force. Unearned premium reserves represent an insurer’s
obligation to provide future coverage and the potential obligation to refund the unexpired
portion of the premium to a policyholder, in the event that a policy is cancelled.
While this accrual of unearned premium and the subsequent earning of that premium may
appear to be an attempt to match revenues with expenses, this is not the case. Statutory
accounting requires that expenses related to the acquisition of an insurance policy be realized
as an expense at the time of acquisition. Despite that, the full amount of the written premium
is still recorded as an unearned premium reserve at the inception of the policy. This departure
from the matching principle that is commonly followed in accounting regimes exists to allow
for a more conservative solvency-focused presentation because it results in lower
policyholders’ surplus, which is consistent with the objective of SAP.

FINANCIAL REPORTING THROUGH THE LENS OF A PROPERTY/CASUALTY ACTUARY
Part III. SAP in the U.S.: Fundamental Aspects of the Annual Statement
38
Additional detail of the composition of the unearned premium recorded on page 3 (Liabilities,
Surplus and Other Funds) of the Annual Statement can be found on page 7, which is part of
the U&IE. Page 7 (U&IE Part 1) shows the breakdown of the total unearned premium into the
following four categories:
• Amount unearned (running one year or less from date of policy)
• Amount unearned (running more than one year from date of policy)
• Earned but unbilled premiums
• Reserve for rate credits and retrospective adjustments based on experience
The first two categories above are relatively self-explanatory and separate the unearned
premium related to policies with effective periods that are one year or less and policies with
effective periods that are longer than one year. The third category, earned but unbilled
(EBUB) premiums, includes estimated adjustments that will occur to the premium on audit-
type policies where the actual amount of premium depends on some exposure measure, such
as payroll, and is unknown until the end of the policy period. EBUB premiums are only
recorded if they are reasonably estimable in the aggregate. The fourth category represents
the expected adjustments that will occur on retrospectively rated policies, where the premium
is variable based on the loss experience on the policy.
In addition, SAP and GAAP require an insurer to establish a separate premium liability,
referred to as a premium deficiency reserve, if the unearned premium reserve for a portion of
the business is not sufficient to cover the expected corresponding losses, expenses and other
costs. An actuary in either a reserving or pricing role should be aware of the criteria that
dictate when a premium deficiency reserve is required so they can advise management
accordingly. Different criteria apply for short-duration and long-duration contracts. Additional
discussion of premium deficiency reserves is included in Chapter 10. Notes to Financial
Statements and Chapter 22. U.S. GAAP, including Additional SEC Reporting.
Ceded Reinsurance Premiums Payable (Line 12)
Ceded reinsurance premiums payable represent premiums that are owed to reinsurers for
ceded reinsurance. This liability is recorded net of any commission retained to cover expenses
that were incurred in issuing the reinsured policies. This line item does not include ceded
reinsurance that are owed to the reinsurer or other funds that are being held as a deposit by
the ceding company as collateral for payment of the reinsurer’s obligations under specific
terms of the reinsurance treaty, which is reflected in the next item, “Funds Held Under
Reinsurance Treaties,” discussed below.
Funds Held Under Reinsurance Treaties (Line 13)
These liabilities relate to funds that are held by a ceding company as collateral from a
reinsurer. The funds provide security to the ceding company that the reinsurer will pay losses

FINANCIAL REPORTING THROUGH THE LENS OF A PROPERTY/CASUALTY ACTUARY
Part III. SAP in the U.S.: Fundamental Aspects of the Annual Statement
39
as they come due. This is particularly common in the case of unauthorized reinsurers
(companies not authorized or licensed to do business in the ceding company’s state of
domicile) because it allows the ceding company to avoid a statutory accounting penalty on the
recoverables from the unauthorized reinsurer. This penalty is described in SSAP 62R, which
states that a recoverable from an unauthorized reinsurer that is not sufficiently collateralized
is a nonadmitted asset. As noted above, this category also included ceded reinsurance
premiums that were payable but were held according the terms of the reinsurance
agreement.
Provision for Reinsurance (Line 16)
Although the magnitude of this liability category is not large for most insurers, it is worth
mentioning because it is unique to statutory accounting. The provision for reinsurance is a
statutory liability established for reinsurance recoverables that may not be collectable. The
change in this provision is recorded directly to surplus. This penalty applies to all reinsurers
that are slow to pay or that are disputing amounts owed to the ceding company and
unauthorized reinsurers that do not meet the collateral requirements of the ceding company’s
domiciliary state. The actual details of the calculation of the provision for reinsurance are
shown in Schedule F, Part 3 (Chapter 14. Schedule F) provides the details underlying this
calculation).
Note that the net loss reserves, net unearned premium and the amounts recoverable from
reinsurers for paid losses on page 2 of the Annual Statement are net of reinsurance but are
stated without regard for the provision for reinsurance. The provision for reinsurance appears
on page 3 and is a direct reduction to surplus and does not affect a company’s admitted
assets or income. This direct reduction to surplus and other direct reductions to surplus will
be discussed in Chapter 8. The Statutory Income Statement: Income and Changes to Surplus.
Common Capital Stock (Line 30)
Common capital stock is a surplus account that is equal to the par value of the common stock
issued and outstanding. This account only applies to stock insurance companies and does not
exist for mutual insurance companies. Par value is an amount set by the issuer of a stock (the
insurer, in this case) when the stock is initially offered that serves as a minimum value for
which the stock can be sold in that initial offering. Par value has no relation to the market
value of a stock and is often set at a low amount, so this common capital stock is not a
material item for most insurers (it is only included here to allow for a complete explanation).
Certain state regulators have specific requirements for how the par value of shares is
established. A separate, similar account is maintained for preferred stock.

FINANCIAL REPORTING THROUGH THE LENS OF A PROPERTY/CASUALTY ACTUARY
Part III. SAP in the U.S.: Fundamental Aspects of the Annual Statement
40
Gross Paid in and Contributed Surplus (Line 34)
This account represents amounts received through the sale of stock in excess of the par value
for each share. This account also exists only for stock insurers. As shown Table 3, gross paid
in and contributed surplus makes up 26% of the industry surplus, and it is much larger than
the common capital stock account.
Unassigned Funds (Line 35)
Unassigned funds primarily represents surplus that has been accumulated over time through
retained earnings of the business. For mutual companies, all surplus will generally be
reflected in the unassigned funds account because none of those funds were received due to
the sale of stock. However, there are some cases in which mutual insurance companies have
changed their capital structure through the creation of a mutual holding company. In those
situations, the insurance companies issue stock to the holding company and will have
common capital stock and gross paid in and contributed surplus accounts. Unassigned funds
represented 61% of the industry surplus as of December 31, 2018.
SUMMARY
This chapter has explained the basic structure of the statutory balance sheet and has
introduced some of the more significant and relevant accounts. An actuary’s involvement is
often primarily focused on the loss and LAE reserves, which are the largest liability on the
balance sheet, but it is also important for an actuary to understand the bigger picture of an
insurer’s balance sheet in order to better assess the overall financial health of an insurance
company.
In Chapter 13. Overview of Schedules and Their Purpose, we will discuss other schedules in
the Annual Statement that provide details beyond what we have touched upon here. We will
also discuss how that additional detail can be used with the contents of the balance sheet to
assess the financial health of an insurance company.

FINANCIAL REPORTING THROUGH THE LENS OF A PROPERTY/CASUALTY ACTUARY
Part III. SAP in the U.S.: Fundamental Aspects of the Annual Statement
41
CHAPTER 8. THE STATUTORY INCOME STATEMENT: INCOME AND CHANGES TO
SURPLUS
While the balance sheet is of key importance to regulators and the focal point of statutory
accounting, the income statement is of equal importance to the ongoing viability of an
insurance company. The income statement illustrates the revenue, expenses and net income
of an insurance company.
The income statement is presented on the top portion of the Statement of Income on page 4
of the Annual Statement and provides the three sources of income, before federal and foreign
income taxes and dividends to policyholders, separately: underwriting income, investment
income and other income.
A sample of the statutory income statement for the industry as of December 31, 2018, is
presented in Table 4.
17
TABLE 4
Stateme
nt of Income, Income Section: Total U.S. Property/Casualty Insurance
Industry
U.S. 201
8
Statutory Financials, NAIC Format (USD in 000s)
Line
Description
Amount
1.
Premiums earned
599,736,478
2.
Losses incurred
364,129,084
3.
Loss adjustment expens
es incurred
64,189,428
4.
Other underwriting expenses
incurred
167,668,693
5.
Aggregate write
-
ins for underwriting deductions
1,026,092
6.
Total underwriting deductions
597,093,278
8.
Underwriting income
2,618,240
9.
Net investment income earned
57,036,856
10.
Net realized capital gains (losses) less capital gains tax
10,691,626
11.
Investment income
67,728,482
12.
Net gain (loss) from agents’ or premium balances charged off
(
1,674,331
)
13.
Finance and se
rvice charges not included in
premiums
3,725,717
14.
Aggregate write
-
ins for miscellaneous income
(690,778)
15.
Other income
1,360,608
16.
Net income before dividends to policyholders and federal/
foreign
income tax 71,707,330
17.
Dividends to policyholders
3,709,994
19.
Federal and foreign income taxes incurred
7,244,680
20.
Net income
60,752,655
17
Accessed via a sector-specific information and research firm in the financial information marketplace.

FINANCIAL REPORTING THROUGH THE LENS OF A PROPERTY/CASUALTY ACTUARY
Part III. SAP in the U.S.: Fundamental Aspects of the Annual Statement
42
As shown in Table 4, the net income for the industry during 2018 was $60.8 billion. The
subtotals for each source of income show that the industry experienced gains in underwriting,
investment income and other income during 2018. Each of the three sources of income is
discussed further below.
UNDERWRITING INCOME
Underwriting income is the most familiar and relevant source of income to most actuaries.
Underwriting income is calculated as earned premium minus loss and loss adjustment expense
(LAE), other underwriting expenses incurred, any aggregate write-ins for underwriting
deductions and net income of protected cells (not shown). We note that aggregate write-ins
and net income of protected cells are generally immaterial if not 0.
Actuaries are typically involved in estimating incurred losses and LAE and possibly in the
calculation of earned premium, so these terms should already be familiar. On the income
statement, each of the amounts labeled incurred presented also include the ultimate amount
of those liabilities that occurred in the current year, and any changes in the ultimate amount
of the liabilities that occurred in previous years (as shown in the formula below).
Income statement incurred = Current period ultimate + Change in prior period ultimate
where,
Change in prior period ultimate = (total all periods ultimate at end of period – total all periods
ultimate at beginning of period) - current period ultimate
Actuaries may be less familiar with the item labeled “other underwriting expenses incurred.”
Further discussion on this other underwriting expense category is provided below.
Other Underwriting Expenses Incurred (Line 4)
18
We already encountered other underwriting expenses briefly during our discussion of the
liability for “Other Expenses (Excluding Taxes, Licenses and Fees)” in Chapter 7. Statutory
Balance Sheet: A Measure of Solvency. The “Other Expenses” account represents all other
expenses that were incurred but not paid at the end of the fiscal year, while this line on the
income statement represents the total amount of other expenses incurred during the course
of the year, whether or not they have already been paid.
As shown in Table 4, the amount of the other underwriting expenses that were incurred by
the industry in 2018 was $167.7 billion, which is about 28% of net premiums earned in 2018.
The magnitude of these other underwriting expenses highlights the importance of other
18
Aligns with IASA Chapter 8.

FINANCIAL REPORTING THROUGH THE LENS OF A PROPERTY/CASUALTY ACTUARY
Part III. SAP in the U.S.: Fundamental Aspects of the Annual Statement
43
underwriting expenses to the profitability of the industry and the importance of ensuring that
they are accurately reflected in the financial statements.
Expense accounting requires that expenses be allocated in three ways:
1. NAIC operating expense classifications, which represent various types of expenses,
some of which have sub-types. These 24 types are listed in the rows Underwriting and
Investment Exhibit (U&IE), Part 3. Examples of these expense classifications are
“commission and brokerage,” “salary and related Items,” and “taxes, licenses and
fees.” It is suggested that the reader review the U&IE, Part 3, now to see the full list of
classifications.
2. Expense categories, which are broader groupings of expenses that align with the
different operational functions of an insurance company. There are three of these
broad categories: LAE, other underwriting expenses and investment expenses. These
categories are presented in the columns of the U&IE, Part 3.
3. Line of business, of which there are 33, some of which have sub-lines. These lines of
business are listed in the U&IE, Part 2A. The lines of business used for expense
reporting are similar to those lines of business used in Schedule P, but not the same.
Each time an insurance company has an expense, the appropriate expense classification
needs to be determined and an allocation must be made by line of business and expense
category. In some cases, the entire amount of the expense can be specifically identified with
one expense classification, within one expense category and for one line of business (for
instance, a commission paid on a policy within a specific line of business); however, this is
often not the case, such as the salary of an employee who oversees several products and
functions. In those instances, an allocation of that expense must be made. Some expenses
may require several allocation steps.
When an allocation is required, it will be performed based on information that is relevant to
that expense. Examples of potential allocation bases are policy counts, which may be
appropriate in the case of policy administration expenses; employee headcount, which may be
reasonable for supervisors’ salaries; or other measures of business or employee activity.
An example of a complex expense allocation would be one related to the rent that is paid for a
home office that serves as a center for all operating functions. The allocation process could
take place as follows:
• This expense can be specifically identified as the “rent and rent items” expense
classification and therefore assigned fully to that classification.
• Because the home office is used for all company functions, its expenses would need to
be allocated between all three categories: LAE, other underwriting expenses and

FINANCIAL REPORTING THROUGH THE LENS OF A PROPERTY/CASUALTY ACTUARY
Part III. SAP in the U.S.: Fundamental Aspects of the Annual Statement
44
investment expenses. One possible approach to this is to allocate the rent to those
three categories by headcount of personnel associated with each function.
• The home office is also the base for all lines of business, so the expenses may be
allocated to each line of business by premium volume. This allocation to line of
business could differ by expense category.
The result of the first two of these allocations can be observed in the U&IE, Part 3, and the
line of business allocation is reflected in the Insurance Expense Exhibit, Part 2, which will be
discussed in more detail in Chapter 18. Insurance Expense Exhibit.
Guidance for allocation of expenses is provided in the NAIC Annual Statement Instructions,
and also in Statement of Statutory Accounting Principles (SSAP) 70, Allocation of Expenses.
These are the sources of the uniform classifications and categories that are described above,
as well as additional allocation rules. In general, the guidance indicates that specific
identification of expenses is preferable to allocation but that when allocation is required, it
should be apportioned based on pertinent factors or ratios such as premium, number of
claims or headcount. The decision to allocate and the factors or ratios that are used when
allocation is required will require judgment on the part of a company.
While the topic of expense accounting and specifically other underwriting expenses may seem
of questionable relevance to an actuary, it is important to have a basic awareness and
knowledge of the topic. The reason for this is twofold.
First, the overall level of company expenses will directly affect the pricing (or the adequacy of
pricing) of its insurance products. A company with lower expenses relative to its competitors
has the potential to be more competitive and or more profitable. Actuaries can contribute by
participating in the planning and control of expenses.
Second, if the relative allocation of expenses across functions and products is not accurate, it
can lead to subsidies between products that may obscure the true profitability of those
products and lead to inefficient allocation of resources or even anti-selection. An actuary who
understands expense allocation can prevent or minimize such subsidies and their
consequences by striving to allocate expenses as accurately as possible.
The expense allocation process described above and presented in the U&IE is the driver of the
other underwriting expense account on the income statement, as well as other references to
expenses elsewhere in the Annual Statement.

FINANCIAL REPORTING THROUGH THE LENS OF A PROPERTY/CASUALTY ACTUARY
Part III. SAP in the U.S.: Fundamental Aspects of the Annual Statement
45
INVESTMENT INCOME
19
Investment income is an important source of income to insurance companies and a unique
aspect of an insurer’s business relative to other industries. The importance of investment
income was already highlighted by the summary of the industry income statement. There we
saw that in 2018 the insurance industry’s positive net income was nearly entirely attributable
to investment income, with limited contribution from underwriting and other income.
Because there is a delay (significant in some cases) between the time insurers receive
premiums and the payment of claims, they have an opportunity to earn investment income on
those funds. This makes consideration of investment income fundamental to the pricing of
insurance products, which is not the case for most other industries.
The investment income item on the income statement consists of the following:
• Net investment income earned
• Net realized capital gain (loss)
Net investment income earned is primarily related to interest and dividends received on
investment assets held over the course of the year. Net investment income earned does not
include changes to the prices of invested assets that are sold (those are included in net
realized capital gain described below). Furthermore, it is recorded on an accrual basis,
meaning that it is reflected in the year in which it is earned and not necessarily the year in
which the actual cash related to the income is received. The amount of this income is shown
net of investment expenses and other costs, but gross of federal income taxes, on the income
statement.
Net realized capital gain (loss) generally results from the sale of investments for more or less
than original cost, adjusted for the amortization of premiums or accretion of discounts
(amortized cost). Realized losses also result from impairment adjustments. Certain
investments (primarily common stock) are recorded at fair value. The changes in the value of
these investments (unrealized gains (losses)) are not included as income and instead reflected
as direct adjustments to surplus. These direct adjustments to surplus are necessary because
these items do not flow through net income for the current period, but the surplus must still
be adjusted to maintain the admitted assets equal liabilities plus surplus relationship.
In 2018, industry net investment income earned was $57 billion, and the net realized capital
gain was $10.7 billion. Detail of both the net investment income and the net realized capital
gain (loss) amounts that are shown in the income statement is provided on page 12 of the
Annual Statement, which includes the Exhibit of Net Investment Income and the Exhibit of
Capital Gains (Losses). These exhibits provide the detail of both sources of income by asset
class. The Exhibit of Net Investment Income also differentiates between the amount of income
19
Aligns with IASA Chapter 9.

FINANCIAL REPORTING THROUGH THE LENS OF A PROPERTY/CASUALTY ACTUARY
Part III. SAP in the U.S.: Fundamental Aspects of the Annual Statement
46
collected and the amount of income earned in the year and describes the deductions for
investment expenses and other costs. The Exhibit of Capital Gains (Losses) shows the split of
the gains (losses) between those gains (losses) that were realized on the sale or maturity of
an asset and those that were due to impairments (labeled “other realized adjustments”).
The details underlying these two exhibits are provided in Schedules A, B, D, DA and DB of the
Annual Statement, which describe the assets held in each asset class as of the evaluation date
of the financial statement and the assets that were sold, redeemed or disposed of during the
current year.
While property/casualty actuaries are not typically involved in the investment reporting and
valuation, they should have a basic understanding of these items due to their significance to
product pricing and overall insurer operating results. For that reason, a discussion of the
statutory reporting and valuation guidelines for each major asset class is included below.
More detail will be provided on bonds and stocks because they represent the vast majority of
assets held, but several other asset classes will also be discussed briefly.
Bonds
Bonds represent a majority of the assets held by insurance companies. On the Exhibit of Net
Investment Income and the Exhibit of Capital Gains (Losses), bonds are reported in four
categories: U.S. government bonds, bonds exempt from U.S. tax, other bonds (unaffiliated)
and bonds of affiliates. The underlying detail is primarily provided in Schedule D, Part 1
(Long-Term Bonds Owned) and Schedule D, Part 4 (Long-Term Bonds Sold, Redeemed or
Disposed of). Bonds that mature in one year or less are reported in Schedule DA, Part 1
(Short-Term Investments Owned).
The net investment income earned from bonds, as shown in the Exhibit of Net Investment
Income, is based on the following four amounts:
1. Interest received during the year (Schedule D, Part 1, column 20 and Part 4, column
20).
2. Interest due and accrued (Schedule D, Part 1, columns 19 and 20).
3. Current year’s (amortization)/accretion (Schedule D, Part 1, column 13 and Part 4,
column 12)
4. Interest paid for accrued interest on dividends (Schedule D, Part 3, column 9).
The first of the four items, interest received during the year, represents all coupon payments
that were received on bonds held during the year. This includes coupon payment on bonds
owned at the end of the year and on bonds that were owned at the beginning of the year but
sold, redeemed or disposed of during the year. This is presented on the basis of when the
actual interest coupon was actually received, so an adjustment is required to convert it to an
accrual basis. This adjustment is made by adding the change in the interest due and accrued

FINANCIAL REPORTING THROUGH THE LENS OF A PROPERTY/CASUALTY ACTUARY
Part III. SAP in the U.S.: Fundamental Aspects of the Annual Statement
47
account (the second item from above) over the last year to the interest received during the
year.
The explanation of the third item above, current year’s (amortization)/accretion, requires us
to revisit basic bond valuation. Recall that when a bond is purchased, the actual purchase
price is usually different from the face value due to the difference between the coupon rate
on the bond and the market interest rates at the time of purchase. To provide the buyer with
an effective interest rate equal to the current market interest rate, the bond is sold at either
a discount or a premium to the face value. For financial reporting purposes, that discount or
premium is then realized as either positive (in the case of a discount) or negative (in the case
of a premium) interest income over the life of the bond. This is referred to as either the
amortization of the premium or the accretion of the discount and is reported for each bond in
Schedule D, Parts 1 and 4.
The following example illustrates the accounting for a bond purchased at a discount. Assume
a five-year bond with face value of $100 is purchased for $90. The purchase price is less
than the face value because the coupon rate on the bond is less than the current market
interest rate. This difference between the face value and purchase price is referred to as a
discount, and the amount of the discount is set such that the effective yield on the bond will
equal the current market interest rates at the time of purchase. The $10 discount is realized
over the remaining five-year duration of the bond as investment income in addition to the
actual coupon payments, such that the effective yield in each period also matches the market
interest rate at the time of purchase.
The same example can be reversed for bonds that are purchased at premium (when the
coupon rate exceeds the market interest rate), and that premium is amortized as negative
investment income over the life of the bond to achieve an overall investment income equal to
the market interest rate at the time of purchase.
The fourth and final item above, interest paid on accrued interest and dividends, is related to
coupon payments that are received on bonds acquired during the year. When a bond is
acquired between coupon payments, the buyer of the bond (in this case the insurance
company) is required to pay the seller of the bond the portion of the coupon payment that
was earned while they owned the bond. This amount is presented on Schedule D, Part 3
(Long-Term Bonds and Stocks Acquired During Current Year), column 9 (Paid for Accrued
Interest and Dividends).
Each of these three items (interest received, accrual/amortization of discount/premium,
interest due and accrued, and payments for accrued interest on purchases) is reflected in the
investment income collected and earned columns in the Exhibit of Net Investment Income.
The other aspect of investment income related to bonds, net realized capital gains (losses),
comprises the following components:

FINANCIAL REPORTING THROUGH THE LENS OF A PROPERTY/CASUALTY ACTUARY
Part III. SAP in the U.S.: Fundamental Aspects of the Annual Statement
48
• Realized gain (loss) on sale or maturity (Schedule D, Part 4, column16)
• Foreign exchange gain (loss) on disposal (Schedule D, Part 4, column 17)
• Other than temporary impairments recognized (Schedule D, Part 1, column 14 and
Part 4, column 13)
Before we discuss these items in more detail, we will first review the basic statutory
accounting concepts for bonds. When a bond is purchased, it is recorded at actual cost,
including brokerage and other fees. This amount is recorded as the “actual cost” in Schedule
D, Part 1, column 7 and Schedule D, Part 4, column 7. In each statutory Annual Statement
after the purchase of the bond, the bond is recorded at “adjusted carrying value,” which is
based on one of two amounts:
• Amortized cost
• The lower of amortized cost or fair value
Amortized cost represents the actual cost of the bond adjusted for the amortization of any
premium or discount from the face amount (as described in the paragraphs above). Fair value
generally refers to the value that an asset could be sold for in the open market.
For bonds that are designated as National Association of Insurance Commissioners (NAIC) 1
and 2 and carried at amortized cost, the adjusted carrying value of the bond is updated each
year to reflect the amortization of premium or the accretion of discount. As a result, the
adjusted carrying value of the bond will converge with the par value as a bond matures. For
bonds that are designated as NAIC 3 through 6, the value of the bond is shown as the lesser
of fair value or amortized cost. All of this information is summarized on Schedule D, Part 1,
including the NAIC designation, actual cost, fair value, par value and book/adjusted carrying
value.
To the extent the adjusted carrying value of a bond is adjusted to fair value, the adjustment is
considered an unrealized loss and is reflected in Schedule D, Part 1, column 12. Once the
bond is sold, the difference between the consideration received and the adjusted carrying
value is considered a realized gain or loss and is recorded in Schedule D, Part 4, column 18.
Many bonds held by insurance companies are designated as NAIC 1 or 2 and held to maturity,
so there is never any capital gain or loss over the life of the bond.
Bonds denominated in a foreign currency will also be affected by changes in foreign exchange
rates over time. These changes are reflected in the adjusted carrying value but are unrealized
until the bond is sold, redeemed or otherwise disposed of. The change in the unrealized
amount of this foreign exchange gain or loss is found on Schedule D, Part 1, column 15, and
the amount of foreign exchange gain or loss that is realized upon disposal is found on
Schedule D, Part 4, column 17.

FINANCIAL REPORTING THROUGH THE LENS OF A PROPERTY/CASUALTY ACTUARY
Part III. SAP in the U.S.: Fundamental Aspects of the Annual Statement
49
The sum of the realized gain or loss on disposal and the foreign exchange gain or loss on
disposal equals the total gain or loss on disposal, which is shown on Schedule D, Part 4,
column 19.
One important exception to the reporting and valuation rule described above relates to the
third source of the net realized capital gains and losses, which is referred to as “other than
temporary impairments recognized.” In general, an impairment occurs when it is deemed
probable that the insurer will not collect all amounts due according to the contractual terms
of a debt security at the date of acquisition. Whether or not impairment is temporary is a
subjective judgment of the company. Impairments can occur on bonds with any NAIC
designation, and they result in the realized capital losses even though a bond has not been
sold, redeemed or disposed.
The total realized capital gain or loss for a year is calculated in the Exhibit of Capital Gains
(Losses). Column 1 represents the “Realized Gain (Loss) On Sales or Maturity,” which is
calculated in Schedule D, Part 4, and shown in column 18 of that exhibit. Column 2 is labeled
“Other Realized Adjustments” and includes the foreign exchange gain (loss) on disposal and
other than temporary impairments recognized in the first year.
Stocks
Like bonds, investment income from stocks comprises investment income earned and realized
capital gains.
Preferred stocks and common stocks are reported on separate lines on the Exhibit of Net
Investment Income and the Exhibit of Capital Gains (Losses), and they have separate
supporting schedules, Schedule D, Part 2, Section 1 and Section 2, respectively. Disposals of
preferred and common stocks are reflected in Schedule D, Part 4.
Investment income for stocks is simply the amount of dividends received during the year plus
the change in the accrual for dividends declared but unpaid (dividends are accrued on the ex-
dividend date). These dividends are included in Schedule D, Part 2-Section 2, column 11 for
stocks owned at year end and in Schedule D, Parts 4 and 5, column 20 for stocks sold during
the year.
When either common stocks or preferred stocks are purchased, the actual cost plus any
commissions or taxes becomes the initial carrying value. Subsequently, the valuation of
preferred stocks and common stocks differ, so each is discussed separately.
Common stocks of unaffiliated companies listed on the major U.S. exchanges (NYSE and
NASDAQ) are recorded at fair value. Changes to fair value after purchase are recorded as
unrealized valuation increases (decreases) in Schedule D, Part 2, Section 2, column 13. When
a stock (common or preferred) is disposed of, the difference between the consideration

FINANCIAL REPORTING THROUGH THE LENS OF A PROPERTY/CASUALTY ACTUARY
Part III. SAP in the U.S.: Fundamental Aspects of the Annual Statement
50
received and the original cost is recorded as a realized gain (loss) on disposal and a foreign
exchange gain (loss) on disposal (if applicable) in Schedule D, Part 4, columns 17 and 18.
The rules governing the accounting for investments in subsidiaries, controlled and affiliated
entities are complex and beyond the scope of this publication. A brief description of the
accounting for investments in insurance company affiliates is discussed in the RBC chapter of
this publication (see Chapter 19. Risk-Based Capital), where accounting background is needed
on the accounting for determination of the asset risk charge.
The valuation of preferred stock of unaffiliated entities is dictated by the form of the
instrument and the designation assigned by the NAIC Securities Valuation Office. The two
common forms of preferred stock are redeemable and perpetual (i.e., non-redeemable)
preferred stock. Redeemable preferred stock, also known as callable preferred stock, is
preferred stock that is redeemable at the option of the issuer at a specified maturity date or
after a specific period of notice, for a preset price. Perpetual preferred stock is preferred
stock with no maturity date that cannot be redeemed by the issuer. For redeemable preferred
stock, the highest two designation categories are recorded at the original purchase price (i.e.,
cost) plus brokerage and other related fees, with any discount or premium amortized over the
life of the redeemable preferred stock; for perpetual preferred stock, the highest two
designation categories are recorded at fair value; for redeemable and perpetual preferred
stock, the lower four designation categories are recorded at the lower of cost, amortized cost
or fair value.
As with fair value changes, market value changes to common and preferred stock after
purchase are also shown in Schedule D, Part 2, Section 2, column 13 as unrealized valuation
increases (decreases). Again, when a stock is disposed of, the difference between the
consideration received and the original cost is recorded in Schedule D, Part 4, columns 17
and 18 as a realized gain (loss) on disposal and a foreign exchange gain (loss) on disposal (if
applicable).
Both common stocks and preferred stocks are subject to impairment charges if there is a
decline in fair value that is deemed to be “other than temporary” by the company. This
determination must be made by the company based on available information (e.g., published
reports, bankruptcy notifications). When impairment is made, it is recorded in Schedule D,
Part 2, Section 1, column 17 and Schedule D, Part 2, Section 2, column 14 (as well as Part 4
for stocks that are disposed of during the year). Impairments made in a given year are
included in the “Other Realized Adjustments” of the Exhibit of Capital Gains.
Each component of investment income from stocks is included in the Exhibit of Net
Investment Income (page 12). Dividends received plus the change in dividends declared but
unpaid are shown in the Exhibit of Net Investment income. In the Exhibit of Capital Gains
(Losses), the realized gain or loss on disposal is shown in column 1, and the realized foreign

FINANCIAL REPORTING THROUGH THE LENS OF A PROPERTY/CASUALTY ACTUARY
Part III. SAP in the U.S.: Fundamental Aspects of the Annual Statement
51
exchange gain (loss) on disposal and other than temporary impairments are shown in column
2.
Cash, Cash Equivalents and Short-Term Investments
This class includes assets that are immediately convertible to cash and have an original
maturity of one year or less. Short-term investments are reported in Schedule DA, Part 1,
cash is reported in Schedule E, Part 1, and cash equivalents are reported in Schedule E, Part
2.
The short-term investments presented in Schedule DA, Part 1 are composed of bonds or
other securities with a maturity of one year or less (at acquisition) and follow the same
reporting and valuation rules as long-term bonds. When a short-term bond or other
investment is purchased, the security is recorded at cost and the premium or discount (if any)
is amortized or accreted until maturity. Other than temporary impairments are also possible,
though they are less common given the short duration of these investments.
The reporting and valuation of cash and cash equivalents is similar but relatively simpler than
short-term investments, as evidenced by the fewer columns that are included in Schedule E,
Parts 1 and 2 relative to Schedule DA.
Derivatives
Derivatives are financial contracts between two parties for which the value depends on the
performance of other assets or variables. While derivatives are not a major asset class for
most property/casualty insurance companies, they are becoming more common, and they are
of heightened importance due to the financial crisis that occurred in the late 2000s. During
the financial crisis, one large insurance group nearly collapsed due to derivatives that had
been sold by one of its units.
A list of outstanding derivatives owned, sold (“written”), and terminated during the year is
provided in Schedule DB. Companies that are not involved in any open derivatives may omit
Schedule DB.
Schedule DB provides the number of contracts for each derivative and the notional amount,
which represents the number of units of the underlying asset that are involved. The original
trade date and the maturity or expiration date are also provided. The two prices listed are the
transaction price, which is the price that the company agreed to buy or sell at, and the
reporting date price, which is the current price.
One common reason a company may buy or sell derivatives is to hedge, or offset, the
exposure they have to changes in price for an underlying asset or variable, such as an interest
rate. For this reason, Schedule DB includes information on the item that is hedged with each
derivative position and on the type of risk being hedged.

FINANCIAL REPORTING THROUGH THE LENS OF A PROPERTY/CASUALTY ACTUARY
Part III. SAP in the U.S.: Fundamental Aspects of the Annual Statement
52
If a derivative position is held for hedging purposes and a company can demonstrate that the
hedge has sufficiently reduced the risk related to the specific underlying asset or assets
(known as a “highly effective” hedge), then that derivative may qualify for hedge accounting.
Under hedge accounting, the derivative is accounted for in the same way as the asset that is
hedged, which allows for any changes in the value of the hedged asset and the derivative to
offset (or be unrecorded in cases where the hedged item is recorded at amortized cost). For
instance, if an interest rate swap is held to specifically hedge the value of a bond portfolio and
that interest rate swap qualifies as a highly effective hedge (i.e., effectively neutralizes any
changes in the value of the bond portfolio), then that interest rate swap can be accounted for
on an amortized cost basis.
If a derivative no longer qualifies for hedge accounting (i.e., is no longer highly effective),
then the mark-to-market accounting method should be used, and any changes in the fair value
of the derivative should be recorded as unrealized gains (losses) directly to surplus in the
current period. The accounting for derivatives used in income-generation transactions
depends on the nature of the transaction and the accounting for the covering asset or
underlying interest.
Schedule E is also related to derivatives and lists the counterparty exposure for all derivatives
that are open at year-end. Counterparty is the person or institution on the other side of a
transaction. This is important because it provides information to the regulators and any other
users of the financial statements regarding any concentration of exposure to a specific
counterparty. If the exposure to a counterparty becomes large enough that it is material
relative to the surplus of a company, it should be considered as a potential warning sign.
Derivative accounting is very complex and beyond the scope of this publication. More detail
regarding derivative accounting can be found in SSAP 86, Derivatives.
Other Sources of Investment Income
Although we have covered the largest and most common sources of investment income, there
are other sources. For additional information on those other sources, or for additional detail
regarding any of the sources discussed here, refer to the corresponding statutory accounting
guidance.
Investment Guidelines
As discussed, there is a variety of investment asset classes available to insurers, and there is
a wide range of specific assets within each class. When purchasing a bond, an insurer needs to
make decisions on the type of issuer (e.g., government, corporate, asset-backed), industry,
quality, maturity and country. Each company will make these decisions based on a set of
investment guidelines, which are governed by state investment laws applicable to insurers.
Each state has established investment laws, which provide guidance and limits regarding the

FINANCIAL REPORTING THROUGH THE LENS OF A PROPERTY/CASUALTY ACTUARY
Part III. SAP in the U.S.: Fundamental Aspects of the Annual Statement
53
allowable investments for insurers domiciled in their jurisdiction. Although the NAIC has
established model laws governing various aspects of insurers’ operations (including
investments), the laws adopted by individual states may vary from those model laws. For
purposes of this discussion, we will focus on the NAIC Model Investment Law.
20
The NAIC
Model Investment Law allows for two alternative types of investment guidelines, which are
referred to as Defined Limits and Prudent Person.
The Defined Limit system of investment guidelines follows a rule-based approach and
prescribes specific quantitative limits for the invested assets that a company may hold.
Examples of some of the prescribed limits include the following:
• 5% limit of admitted assets with any single issuer (exceptions for government bonds)
• 1% limit of admitted assets with any single issuer with a designation of NAIC 3
• 0.5% limit of admitted assets with any single issuer with a designation of NAIC 4 or
lower
• 20% limit of admitted assets in all securities designated NAIC 3 or lower
• 10% limit of admitted assets in all securities designated NAIC 4 or lower
• 5% limit of admitted assets in all securities designated NAIC 5 or lower
• 1% limit of admitted assets in all securities designated NAIC 6
• 25% limit of admitted assets or 100% of surplus in all common stocks
The Prudent Person system of investment guidelines follows a principles-based approach and
requires an insurance company to develop its own investment guidelines. If a company
chooses to use the Prudent Person approach, it should develop the investment guidelines with
the protection of the policyholder in mind, and it should consider the specific investment
expertise and resources available.
Measuring Investment Performance
Although investment income is a critical aspect of an insurer’s profitability, it can be difficult
to measure investment performance and make comparisons between insurance companies.
Several factors to consider are the size of the asset base of a company, the level of risk
inherent in a company’s investment portfolio and the impact of taxes on a company’s
investment income. Each of these considerations will be discussed below.
It may be tempting to compare the amount of investment income from one company to
another or to create the ratio of investment income to written or earned premium. Neither of
these approaches is an accurate measure of investment performance because they ignore the
size of a company’s invested assets. All things being equal, a company with 10 times the
invested assets of another company would also be expected to generate 10 times the
20
NAIC, Model Laws, Regulations, Guidelines and Other Resources MDL-280, 282, 283, and 340,
https://www.naic.org/prod_serv_model_laws.htm2019.

FINANCIAL REPORTING THROUGH THE LENS OF A PROPERTY/CASUALTY ACTUARY
Part III. SAP in the U.S.: Fundamental Aspects of the Annual Statement
54
investment income. For that reason, one metric to consider is the ratio of the investment
income for the year to the average invested assets.
That ratio will provide a basic comparison between two companies and how much investment
income they are generating relative to their invested assets. However, this ratio does not
consider the inherent risk to the assets that are being held. If one company has a significantly
higher percentage of its assets in common stocks or lower-rated bonds, it would be expected
to achieve a higher investment return during a good year, but the level of risk is significantly
higher. While there may not be a single ratio or metric that measures this inherent level of
risk, it is at least possible to qualitatively compare the types of assets held by two companies
to see if there are significant differences.
Measurement and comparison of investment performance is also difficult due to taxes. As
discussed earlier in this chapter, net investment income earned is presented on the income
statement before the effects of federal income taxes. On the other hand, net realized capital
gain (loss) is presented after capital gains tax. Two companies that had the same net
investment income earned may be subject to different taxation. The full implications of the
impact of taxes on investment income are beyond the scope of this publication, but a user of
the financial statements should be aware of this potential difference and seek input from a tax
professional as needed.
OTHER INCOME
As shown in the summary of the industry income statement, the other income category is
relatively small compared to the other two categories. For that reason, only a few of the
significant sources of other income will be discussed below. Although they are not technically
considered to be part of other income, dividends to policyholders and federal and foreign
income taxes are also discussed below because they are part of the consideration of net
income.
Net Gain (Loss) from Agents' or Premium Balances Charged Off (Line 12)
In Chapter 7. Statutory Balance Sheet: A Measure of Solvency, we discussed the assets
related to uncollected and deferred agents’ balances. If a company determines that a portion
of those balances will not be collected, those balances should be charged off as a loss and are
recorded as an expense under this category in other income. Conversely, if an agents’ balance
that was previously written off is recovered, that recovery would be included as a gain in this
category. Losses can be used to offset gains that occur during the same period.
Finance and Service Charges not Included in Premiums (Line 13)
Insurers will often offer financing or payment plans to the insured that allow the insured to
spread out premium payment over time. Typically, the insured will pay an additional flat
service charge to pay through these financing or payment plans. Those service charges are

FINANCIAL REPORTING THROUGH THE LENS OF A PROPERTY/CASUALTY ACTUARY
Part III. SAP in the U.S.: Fundamental Aspects of the Annual Statement
55
not recorded as a part of written or earned premium and are instead included in this category
under other income.
Aggregate Write-ins for Miscellaneous Income (Line 14)
While the amounts included as miscellaneous write-ins are not usually material, several of the
common entries are the following:
• Gain or Loss on Sale of Equipment: When furniture, equipment or automobiles are
sold, the sale price may differ from the current depreciated cost. That difference may
be recorded as either a gain or a loss under other income.
• Retroactive Reinsurance: An insurer may purchase reinsurance on existing liabilities,
and the reinsurance premium paid may be more or less than the previously recorded
value of the liabilities transferred. That gain or loss is recorded as other income.
• Gain or Loss on Foreign Exchange: When payments are made or received in a foreign
currency, the ultimate settlement of the payment may be at a different exchange rate
than the exchange rate at which the payment was originally recorded, and the
resulting gain or loss is recorded as other income. This does not include changes in
investment income due to foreign exchange, which were already discussed.
• Corporate Expense: Some insurers will record some corporate expenses that are not
allocable to underwriting or investments, such as national advertising, to other
expenses.
• Fines and Penalties of Regulatory Authorities: As per the Annual Statement
Instructions, all fines and penalties imposed by regulatory authorities must be
disclosed separately, regardless of materiality.
Dividends to Policyholders (Line 17)
The board of directors of a mutual insurance company may elect to pay a dividend to the
policyholders. A dividend is effectively a return of a portion of the premium that was originally
paid by the policyholder, and for a dividend to be paid, there are typically state requirements.
When the decision is made to pay a dividend, it is considered to have been “declared,” and
payment won’t actually be issued until a later date.
This item on the income statement includes dividends that were actually paid plus the change
in accrued dividends.
Federal and Foreign Income Taxes Incurred (Line 19)
All foreign and federal income taxes that are incurred during the current year, including
amounts related to prior years, are recorded on this line. This amount of income taxes

FINANCIAL REPORTING THROUGH THE LENS OF A PROPERTY/CASUALTY ACTUARY
Part III. SAP in the U.S.: Fundamental Aspects of the Annual Statement
56
incurred represents an estimate of the current income taxes incurred during the reporting
period and excludes any amounts that would be deferred to later years. Further detail on
taxation appears in Chapter 26. Taxation in the U.S.

FINANCIAL REPORTING THROUGH THE LENS OF A PROPERTY/CASUALTY ACTUARY
Part III. SAP in the U.S.: Fundamental Aspects of the Annual Statement
57
CHAPTER 9. CAPITAL AND SURPLUS ACCOUNT
In addition to various income items that have already been discussed, the Statement of
Income within the Annual Statement also includes a section referred to as the “Capital and
Surplus Account.” This section is important because it reflects certain changes in surplus that
are not recorded in the income statement and it reconciles the beginning surplus to the
ending surplus for the reporting period.
In its simplest form, the key components of the Capital and Surplus Account are listed in Table
5 as follows:
Current Year Surplus (line 39) =
Prior Year Surplus (line 21)
+ Current Year’s Net Income (line 22)
+ Other Surplus Changes (lines 24 through 31)
+ Additional Capital Contributions (lines 32 and 33)
+ Stockholder Dividends (line 35)
21
Under Statutory Accounting Principles, certain transactions are recorded directly to surplus,
so the Other Surplus Changes component includes a number of important subcomponents.
Table 5 is an excerpt of the Capital and Surplus Account for the U.S. property/casualty
insurance industry as of December 31, 2018.
22
21
Stockholder dividends represent a charge to surplus for amounts paid during the year plus the change in the
amount of dividends declared but unpaid during the year. These amounts are shown as a negative number in line
35 of the Capital and Surplus Account and therefore added, as a negative number, to calculate current year
surplus. Table 5 demonstrates this calculation.
22
Accessed via a sector-specific information and research firm in the financial information marketplace.

FINANCIAL REPORTING THROUGH THE LENS OF A PROPERTY/CASUALTY ACTUARY
Part III. SAP in the U.S.: Fundamental Aspects of the Annual Statement
58
TABLE 5
Statement of Income, Capital and Surplus Account Section: Total
U.S. Property/Casualty Insurance Industry
U.S. 201
8
Statutory Financials, NAIC Format (USD in 000s)
Line Description Amount
21. Surplus as of December 31 of prior year 765,448,283
22. Net income 60,752,655
24. Change in net unrealized capital gains (losses) less capital gains tax (45,399,542)
25. Change in net unrealized foreign exchange capital gain (loss) (585,099)
26. Change in net deferred income tax 324,683
27. Change in nonadmitted assets (818,259)
28. Change in provision for reinsurance 139,053
31. Cumulative effect of changes in accounting principles 58,650
32. Capital changes (197,375)
33. Surplus adjustments 9,197,233
35. Dividends to stockholders (32,085,308)
37. Aggregate write-ins for gains or losses to surplus 235,593
38. Changes to surplus for the year (lines 22 through 37 and **) (8,526,468)
39. Surplus as regards policyholders, December 31 current year 756,921,815
The first item of Table 5, surplus as of December 31 of prior year, is taken directly from the
Capital and Surplus Account from the prior year. Net income comes from the Statement of
Income. The remaining rows describe the direct adjustments to surplus. An explanation of
some of the important adjustments is below.
Change in Unrealized Capital Gains (Losses) (Line 24)
We previously discussed the concept of realized and unrealized capital gains in the discussion
of investments and investment income. Capital gains (losses) occur when the carrying value
of an asset changes, but those capital gains (losses) are only realized when an asset is either
disposed of or impaired.
Recall that in the investment income section of the Statement of Income, realized capital
gains (losses) are recorded in income, but unrealized capital gains (losses) are not. Unrealized
capital gains (losses) occur when the fair value of investments carried at fair value changes
during the reporting period. Because these unrealized capital gains (losses) are reflected in
the balance sheet but not in net income, an adjustment to surplus is required to maintain the
Admitted Assets – Liabilities = Surplus relationship.
Because the current year’s surplus is being calculated with the prior year’s surplus as a
starting point, the required adjustment is the change in net unrealized capital gains (losses)

FINANCIAL REPORTING THROUGH THE LENS OF A PROPERTY/CASUALTY ACTUARY
Part III. SAP in the U.S.: Fundamental Aspects of the Annual Statement
59
relative to the prior year, not the absolute amount of unrealized capital gains for the current
year. This amount can be found in column 4 of the Exhibit of Capital Gains (Losses).
Unrealized capital gains (losses) most frequently occur with respect to stock holdings that are
held at fair value because any change in the fair value from year to year affects capital gains
(losses). Bonds may also produce unrealized capital gains, but this would typically only occur
when a bond is designated as National Association of Insurance Commissioners (NAIC) 3 or
lower and is therefore recorded at fair value. Perpetual preferred stock and redeemable
preferred stock that is designated in the four lowest NAIC categories could also produce
unrealized gains since they also may be recorded at fair value.
Change in Net Unrealized Foreign Exchange Capital Gains (Losses) (Line 25)
This item is similar to the change in unrealized capital gains (losses), but it is specifically
related to unrealized capital gains (losses) due to changes in the foreign exchange rate. When
an asset is purchased in a foreign currency, any subsequent change in value due to changes in
foreign exchange rates as long as that asset is held are considered to be unrealized capital
gains (losses). This amount can be found in column 5 of the Exhibit of Capital Gains.
Change in Net Deferred Income Tax (Line 26)
Deferred tax assets (DTAs) and deferred tax liabilities (DTLs) were already discussed in the
previous discussion of the balance sheet (Chapter 7. Statutory Balance Sheet: A Measure of
Solvency). DTAs and DTLs can arise for a variety of reasons, but the most common are
differences in statutory and tax accounting (such as in the discounting of loss reserves,
unrealized gains/losses and unrealized foreign exchange gains/losses) and carryforward of
previous operating losses to future tax years. DTAs are only considered admitted assets if a
strict admissibility test is met. All surplus adjustments are recorded net of deferred taxes if
there is a difference in the treatment of the item for statutory accounting and tax purposes.
Similar to unrealized capital gains, net DTAs affect the balance sheet but do not flow through
to income. As a result, a direct adjustment is required to surplus to maintain the equality of
Admitted Assets – Liabilities = Surplus. The change in deferred taxes is determined before
consideration of the nonadmitted portion because the change in nonadmitted DTAs is
captured with all the other nonadmitted assets.
Change in Nonadmitted Assets (Line 27)
The concept of nonadmitted assets was introduced in the previous discussion of the balance
sheet. Nonadmitted assets are assets that are not allowed to be considered part of surplus for
the purpose of statutory accounting. This creates a violation of the Admitted Assets –
Liabilities = Surplus relationship.
As with the previous items, the adjustment required is based on the change in nonadmitted
assets relative to the prior year, not the current absolute amount. There is a specific exhibit in

FINANCIAL REPORTING THROUGH THE LENS OF A PROPERTY/CASUALTY ACTUARY
Part III. SAP in the U.S.: Fundamental Aspects of the Annual Statement
60
the Annual Statement, the Exhibit of Nonadmitted Assets (page 13 of the 2018 Annual
Statement), which calculates the change in nonadmitted assets relative to last year by asset
class and in total. The total change in nonadmitted assets from that exhibit is the source for
the amount used as the change in nonadmitted assets in the Capital and Surplus Account.
Change in Provision for Reinsurance (Line 28)
Like nonadmitted assets, the provision for reinsurance is a concept that reduces surplus and
is unique to statutory accounting. While nonadmitted assets are essentially treated as assets
that are excluded from surplus, the provision for reinsurance is treated as an additional
liability on the balance sheet (though no real liability exists). The provision for reinsurance is
included on the balance sheet, but it does not flow through to the Statement of Income, which
is why a direct adjustment to surplus is required.
The Liabilities page of the balance sheet shows the current year and the prior year provision
for reinsurance, so the change in the provision for reinsurance can be calculated from those
amounts. The amount of the change in the provision for reinsurance is included in the Capital
and Surplus Account.
Cumulative Effect of Changes in Accounting Principles (Line 31)
Sometimes a company must adopt changes in accounting principles, either due to new
accounting guidance, or a change in accounting policy. When such a change occurs, a
company must determine the cumulative effect of the change (as if the accounting principle
had always been in place) as of the beginning of the reporting period the change is made. The
cumulative effect of the change is recorded as a direct adjustment to surplus.
Although an entry for a cumulative effect of changes in accounting principles could be
required for many reasons, here are two examples:
• Anticipated salvage and subrogation: Companies have the option to record unpaid
losses net of anticipated salvage and subrogation. When a company elects to change
the recording from gross of salvage and subrogation to net of salvage and
subrogation, the cumulative effect of this change should be reported here.
• Tabular discounting: When companies record loss reserves for life pension reserves,
they have the option to discount for interest and mortality according to a prescribed
actuarial table and interest rate. This is referred to as tabular discounting. When a
company makes a change in its use of tabular discounting, the cumulative impact of
that change should be recorded here.

FINANCIAL REPORTING THROUGH THE LENS OF A PROPERTY/CASUALTY ACTUARY
Part III. SAP in the U.S.: Fundamental Aspects of the Annual Statement
61
Capital Changes and Surplus Adjustments (Lines 32 and 33)
The lines for capital changes and surplus adjustments primarily describe inflows and outflows
of capital from the new issuance of stock or return of capital, as well as transfers from surplus
to capital when stock dividends are issued. When new stock is issued, the portion of the
proceeds related to the par value of that stock is recorded as paid-in capital on line 32.1. The
portion of the proceeds in excess of the par value is recorded as paid-in surplus on line 33.1.
Dividends to Stockholders (Line 35)
The board of directors of an insurance company may elect to pay a dividend to the
stockholders, which serves as a return on the stockholders’ investment. Stockholder
dividends may only be paid out of unassigned surplus, which is surplus that is not assigned to
the par value or paid in value of stock, special surplus funds, surplus notes or treasury stock.
There are also specific state requirements that must be met for a stockholder’s dividend to be
paid.
The amount shown as dividends to stockholders equals the actual amount paid during the
year plus the change in the amount of dividends declared but unpaid during the year.
SUMMARY
This section described the three sources of income on the Statement of Income (underwriting,
investment and other) and discussed the Capital and Surplus Account within the Statement of
Income, where total change in surplus is determined.
While actuaries are most familiar with the aspects relating to underwriting income, they
should also be familiar with investment income, given the significance of investment income
to the pricing and profitability of an insurer. Understanding the various items that affect the
change in surplus is also important because this not only provides the link between the
profitability and the solvency of a company (or the income statement and the balance sheet),
but it also highlights several direct adjustments to surplus that may require input from an
actuary.

FINANCIAL REPORTING THROUGH THE LENS OF A PROPERTY/CASUALTY ACTUARY
Part III. SAP in the U.S.: Fundamental Aspects of the Annual Statement
62
CHAPTER 10. NOTES TO FINANCIAL STATEMENTS
We have now covered the numerical aspects of three of the primary financial statements: the
balance sheet, income statement, and statement of capital and surplus. For some of the
balances, Statutory Accounting Principles (SAP) requires additional qualitative or quantitative
information in order to more fully portray the financial condition of an insurer. The Notes to
Financial Statements include some of this additional qualitative and quantitative information.
This publication will focus on specific notes that often require direct involvement by actuaries
and the notes that are potentially relevant to actuaries. The notes within each of those two
categories are described below:
• Notes often requiring direct involvement by actuaries:
• Reinsurance (23)
• Change in incurred loss and loss adjustment expense (LAE) (25)
• Premium deficiency reserves (30)
• Discounting of liabilities for unpaid loss and LAE (32)
• Asbestos/environmental reserves (33)
• Notes that are potentially relevant to actuaries:
• Summary of significant accounting policies and going concern (1)
• Events subsequent (22)
• Intercompany pooling arrangements (26)
• Structured settlements (27)
• High deductibles (31)
The numbers listed next to each note above are the numbers corresponding to that note in
the 2018 Notes to Financial Statements included in the Annual Statement Blank, which are
the same as those in 2011. These numbers may change from year to year due to the addition
or subtraction of the notes that are required, so these numbers will not be used in the rest of
this discussion. Examples will be drawn from the 2018 Notes to Financial Statements for
Fictitious Insurance Company (referred to as the 2018 Fictitious Notes). It is also suggested
that the reader review an example of the Notes to Financial Statements from a current
insurance company Annual Statement as they review this section.
23
For each of the notes described, the following information will be provided:
• Information contained in the note
• Importance of the note to actuaries
• Example of information from the 2018 Fictitious Notes
23
The Notes to the Financial Statements are included only in individual company Annual Statements, not in group
Annual Statements.

FINANCIAL REPORTING THROUGH THE LENS OF A PROPERTY/CASUALTY ACTUARY
Part III. SAP in the U.S.: Fundamental Aspects of the Annual Statement
63
Readers seeking more detail on any notes listed above or on other notes to financial
statements can refer to either the National Association of Insurance Commissioners (NAIC)
Annual Statement Instructions or the paper Notes to the NAIC Property/Casualty Annual
Statement by Sholom Feldblum and Ralph Blanchard (October 2010).
NOTES OFTEN REQUIRING DIRECT INVOLVEMENT BY ACTUARIES
These five notes typically require direct input from the actuaries at an insurance company,
though in each case the management of the company is ultimately responsible (and in some
cases the actuary may be a member of management). Because actuaries will likely be the
primary source of input in these cases, readers should review these notes in detail and
understand what information is needed to complete them.
Reinsurance
The loss and LAE reserve liabilities on the balance sheet and the underwriting income on the
income statement are expressed net of reinsurance. Given that reinsurance can significantly
lower the loss and LAE reserves on the balance sheet and affect the level of surplus,
disclosures regarding the reinsurance in place are important to assessing the financial health
of a company. Actuaries typically estimate the ceded reserves on reinsurance contracts and
are therefore directly involved in the preparation of this note.
In particular, it is important to understand the potential credit risk associated with the
assumed reinsurance recoverables (the risk that the reinsurer will not pay). This note
provides information on specific liabilities for which the credit risk may be heightened, such as
unsecured recoverables, recoverables in dispute and recoverables that have been deemed
uncollectible.
In addition to the assessment of credit risk, there are also some specific accounting rules
related to reinsurance that require additional disclosure. The note includes several of these
matters, namely the commutation of ceded reinsurance, retroactive reinsurance, reinsurance
accounted for as a deposit and run-off agreements.
There are nine sections of this note labeled A through I. A brief summary is provided on each
of these sections:
• Unsecured Reinsurance Recoverables (Section A): The credit risk related to
recoverables with a specific reinsurer is often mitigated by the reinsured having
access to a letter of credit, trust agreement or funds withheld. This note discloses
reinsurers for which no such security exists, but only in cases where the recoverable
from that reinsurer exceeds 3% of the reporting entity’s (i.e., the reinsured’s)
policyholder surplus. The mention of a reinsurer in this note is not necessarily a
problem because those reinsurers may be highly rated and financially sound. The

FINANCIAL REPORTING THROUGH THE LENS OF A PROPERTY/CASUALTY ACTUARY
Part III. SAP in the U.S.: Fundamental Aspects of the Annual Statement
64
amounts shown for each include paid losses billed but not yet collected, ceded
reserves and ceded unearned premium.
• Reinsurance Recoverables in Dispute (Section B): Even when a recoverable is secured,
it is possible for a reinsurer to dispute (or refuse to pay) a recoverable. A reinsurer
may dispute either because they are unwilling to pay due to a disagreement on the
coverage or amount or because they are unable to pay due to insolvency. A
recoverable is considered to be in dispute once a formal written refusal to pay is
received from the reinsurer. In addition to identifying a credit risk, recoverables in
dispute might represent attempts by a financially troubled insurer to over-recover
from reinsurers.
• Reinsurance Assumed and Ceded (Section C): Although unclear from the vague
naming, this section includes information on ceding commissions to reinsurers related
to the ceded unearned premium reserve. These ceding commissions received from
reinsurers are treated as revenue by the insurer and therefore benefit the insurers’
surplus position. This section helps regulators to identify situations where an insurer
may be abusing ceding commissions to artificially enhance its surplus position, and it
provides information on ceding commissions that would need to be returned in the
event of cancellation. Specific disclosure is also required for contingent ceding
commissions.
• Uncollectible Reinsurance (Section D): If an insurer deems that it is unlikely to collect a
specific reinsurance recoverable, it must write off that recoverable as uncollectible
and treat it as an expense. This section of the note includes a description of any
recoverables that were written off as uncollectible during the course of the year. The
disclosures in this note may help an actuary or other user of the financial statements
to assess provisions set aside for future uncollectible reinsurance, which is reflected in
the Provision for Reinsurance derived in Schedule F.
• Commutation of Ceded Reinsurance (Section E): A commutation is a “transaction
which results in the complete and final settlement and discharge of all, or the
commuted portion thereof, present and future obligations between the parties arising
out of a reinsurance agreement.”
24
This note requires disclosure of any commutations
that occurred during the year. This information is important to a user of the financial
statements because a commutation may cause a distortion to the income statement
and balance sheet because the commutation payment received from the reinsurer may
be reflected as a negative paid loss and the net loss reserves may increase to reflect
the elimination of the reinsurance.
24
SSAP 62R.

FINANCIAL REPORTING THROUGH THE LENS OF A PROPERTY/CASUALTY ACTUARY
Part III. SAP in the U.S.: Fundamental Aspects of the Annual Statement
65
• Retroactive Reinsurance (Section F): Retroactive reinsurance refers to reinsurance
that is purchased for liabilities that occurred prior to the effective date of the
reinsurance contract. Retroactive reinsurance must be accounted for differently than
normal prospective reinsurance to avoid distortion of the balance sheet and income
statement. Instead of reducing the net loss reserves, retroactive reinsurance reserves
are recorded separately as a write-in item on the balance sheet with any gain recorded
in the income statement and as a restricted special surplus amount. This section of the
note includes disclosure of any retroactive reinsurance, including reserves
transferred, consideration paid or received, paid losses reimbursed or recovered,
special surplus generated, and other reinsurers involved in the transaction. This
section allows a user of the financial statements to verify that retroactive reinsurance
is being accurately accounted for and to understand its impact on the financial
statements.
• Reinsurance Accounted for as a Deposit (Section G): To be accounted for as
reinsurance, a reinsurance contract must meet certain risk transfer criteria. When a
reinsurance contract does not qualify for reinsurance accounting, it must be
accounted for as a deposit. This means that it is directly accounted for as a deposit
asset or liability (depending on if amounts are owed from or to, respectively, other
parties under the contract), instead of flowing through underwriting income. If a
company has any reinsurance contracts that are accounted for as deposits, a schedule
showing the historical changes to the balance since inception of each contract is
included.
• Disclosures for the Transfer of Property and Casualty Run-off Agreements (Section H):
Run-off agreements are reinsurance agreements intended to transfer the risks and
benefits of a specific line of business or market segment that is no longer actively
marketed by the transferring insurer to a third party. This third party is often another
insurance or reinsurance company. If certain criteria are met, a run-off agreement can
be accounted for differently than is typically required for retroactive reinsurance. If
these criteria are met, the transferring entity records the consideration paid to the
assuming entity as a paid loss. If the consideration paid by the transferring entity is
less than the loss reserves transferred, the difference is recorded by the ceding entity
as a decrease in losses incurred. As noted above, retroactive reinsurance that is not
considered a run-off agreement is recorded as a separate item on the balance sheet
with no reduction in incurred losses at the time of the transaction.
• Certified Reinsurer Rating Downgraded or Status Subject to Revocation (Section I): A
certified reinsurer is an assuming insurer that has been certified as a reinsurer in the
domiciliary state of the ceding insurer and secures its obligations in accordance with
the requirements of Appendix A-785, Credit for Reinsurance of the NAIC Accounting
Practices and Procedures Manual. Certified reinsurers that have their ratings reduced

FINANCIAL REPORTING THROUGH THE LENS OF A PROPERTY/CASUALTY ACTUARY
Part III. SAP in the U.S.: Fundamental Aspects of the Annual Statement
66
or their certified status revoked by the ceding company’s state of domicile may have
to provide increased collateral. This footnote requires disclosure of the impact on any
reporting period in which a certified reinsurer’s rating has been downgraded or its
certified reinsurer status is subject to revocation and additional collateral has not been
received as of the filing date.
In summary, this note is helpful to an actuary or other user of the financial statements
because it identifies potential credit risks (Sections A, B, D and I) and identifies types of
reinsurance that are subject to specific accounting treatment (Sections C, E, F, G and H). For
the sections related to credit risk (A, B, D and I), the user of the financial statements may ask
the following kinds of questions if material balances exist:
• Section A (Unsecured Recoverables): Why wasn’t security provided? Are there
concerns of the financial health of either the reinsurer or the reinsured? Was there a
catastrophe that led to a large amount of recoverables? Are all of these unsecured
recoverables concentrated with one reinsurer?
• Section B (Recoverables in Dispute): What is the point of disagreement with the
reinsurer? Is the amount in dispute material to either the reinsured or the reinsurer?
Are there legal opinions available on the validity of each side’s claim?
• Section D (Uncollectible Reinsurance): What was the reason for the uncollectible
reinsurance? Could other outstanding recoverables also be uncollectible in the future
for the same or similar reasons? How long did it take the company to write off any
uncollectible reinsurance that was disclosed?
• Section I (Certified Reinsurer Rating Downgraded or Status Subject to Revocation):
What was the reason for the downgrade or revocation? Why wasn’t the additional
collateral provided as of the filing date?
The disclosures in this note are of specific interest to an actuary who is opining on a
company’s loss reserves because several of these items are referred to explicitly in the
Statement of Actuarial Opinion (SAO).
A review of the 2018 Fictitious Notes indicates that Fictitious provided disclosures related to
unsecured reinsurance, commissions and retroactive reinsurance. The other items were not
applicable for the 2018 year.
Change in Incurred Loss and Loss Adjustment Expense
The total incurred loss and LAE for a year can be thought of in two categories: (1) loss and
LAE that were incurred on liabilities occurring during the current accident year and (2) any
changes in incurred loss and LAE from previous accident years. This note relates only to the

FINANCIAL REPORTING THROUGH THE LENS OF A PROPERTY/CASUALTY ACTUARY
Part III. SAP in the U.S.: Fundamental Aspects of the Annual Statement
67
second of these two items. The content of this note should include the amount of the change
(i.e., reserve strengthening or weakening) in liabilities for previous accident years, the
segments or lines of business that led to that change, and the reason for the change.
The importance of this note to the financial health of an insurance company is two-fold. First,
the existence of a material change in prior accident years’ incurred losses and LAE affects the
current year’s underwriting income and could obscure the true underlying experience of the
current in-force business. A company that achieved positive underwriting income solely as a
result of decreases to prior years’ loss and LAE estimates may have profitability issues on
their current business.
Second, recurring material changes in prior accident year incurred loss and LAE may be
indicative of a bias or problem with a company’s reserving process. For instance, if a company
consistently experiences significant decreases in their estimates of prior accident years’
losses, then there may be inherent conservatism to the company’s process for establishing
loss and LAE reserves. Schedule P provides additional information that may assist in this
assessment, and it will be discussed in more detail in Chapter 15. Schedule P.
Actuaries should be familiar with the required content of this note so that they are prepared
to provide input to management. Also, when reviewing a company’s financial statements,
actuaries may be in the best position to identify one of the two problems noted above. This
note should be consistent with information included in a similar note to the annual Generally
Accepted Accounting Principles financial statements and also to the one-year development
column from Schedule P, Part 2 (with the exception of Adjusting & Other Loss Adjustment
Expenses, which are included in this note but not in Schedule P, Part 2).
Finally, if the actuary is the Appointed Actuary for the company, the actuary may be called on
to understand the difference in estimates underlying the loss reserves since the prior year’s
estimates and comment on those changes in the Appointed Actuary’s Statement of Actuarial
Opinion. For that reason, the actuary needs to be aware of the content of this note.
In the case of the 2018 Fictitious Notes, it is disclosed that the prior year-end total loss and
LAE reserves developed favorably by $875,000, and several specific segments were cited as
the major drivers of this favorable development. According to Fictitious’ income statement,
the company’s net income in 2018 was $2.2 million. This tells the user of the financial
statements that the favorable reserve development was a significant factor in the financial
results of the company for the year. Chapter 12. Five-Year Historical Data Exhibit will provide
guidance on how to assess whether this favorable development has been occurring
consistently over time.

FINANCIAL REPORTING THROUGH THE LENS OF A PROPERTY/CASUALTY ACTUARY
Part III. SAP in the U.S.: Fundamental Aspects of the Annual Statement
68
Premium Deficiency Reserves
Premium deficiency reserves must be recorded when the unearned premium of in-force
business is not sufficient to cover the losses, LAE and maintenance expenses that will arise as
that premium is earned. Companies have the option to consider investment income when
performing this calculation. Also, before performing the calculation, the business should be
grouped in a manner that is consistent with how it is marketed, serviced and measured.
Most insurance policies sold by insurance companies are priced with rates that are greater
than the expected losses and expenses, especially after consideration of investment income.
Furthermore, if there is a segment of the business that is underpriced, it may be a part of a
larger grouping where the deficiency in that segment is offset by other more profitable
segments. For these reasons, the premium deficiency reserve will be zero for a majority of
companies. However, there are cases where a non-zero premium deficiency reserve exists
due to regulatory, competitive or other conditions that led to inadequate rates.
When a non-zero premium deficiency reserve does exist, a company may record it as either a
write-in liability or a part of the unearned premium reserve on the balance sheet. When it is
recorded as a part of the total unearned premium reserve liability, the Notes to Financial
Statements is the only way to identify whether a premium deficiency reserve exists and the
amount of the reserve.
In the note relating to premium deficiency reserves, the company must disclose the amount of
the premium deficiency reserve. The company also needs to disclose whether investment
income was considered in the determination of the premium deficiency reserve (although this
is often disclosed in the accounting policy note).
This note is relevant to users of the financial statements because the existence of a premium
deficiency reserve is usually a clear indication that issues of rate adequacy exist for at least
the affected segment. However, the absence of a non-zero premium deficiency reserve does
not necessarily indicate that rates for all business segments are adequate, due to the ability
to consider investment income and to group segments into broad categories.
As a result of actuaries’ involvement in the pricing and reserving of business, actuaries are in
a position to provide input on whether a premium deficiency reserve is necessary and on the
amount of the premium deficiency reserve. The analytical approach for this is beyond the
scope of this publication, but there are other resources available that provide direction.
In the 2018 Fictitious Notes, the note on premium deficiency reserves indicates that at
December 31, 2018, the company had liabilities of $0 related to premium deficiency
reserves, and anticipated investment income was considered in that determination. If an
insurer were to elect to change its consideration of investment income from one year to the
next for the purposes of calculating the premium deficiency reserve, that change would likely

FINANCIAL REPORTING THROUGH THE LENS OF A PROPERTY/CASUALTY ACTUARY
Part III. SAP in the U.S.: Fundamental Aspects of the Annual Statement
69
need to be disclosed, along with the amount of the impact, in the Note called “Accounting
Changes and Correction of Errors.”
Discounting of Liabilities for Unpaid Loss and Loss Adjustment Expenses
This note indicates whether a company discounts loss reserves, and if so, it also describes the
basis for calculating the amount of the discount. There are two types of discounting that need
to be disclosed: tabular discounting and non-tabular discounting.
Tabular discounting applies specifically to outstanding annuity-type claims that pay pension
benefits. These claims arise most commonly from workers’ compensation coverage but may
also arise from other types of liability coverage. A tabular discount reflects mortality
assumptions according to a specific life table and a defined interest rate. Both the life table
and the interest rates may be specified by the state regulator. Not all insurance companies
that have these eligible liabilities choose to utilize tabular discounts.
In the first part of this note, the company needs to indicate whether any liabilities are
discounted using tabular discounting. If any tabular discounting is used, the company also
needs to indicate the basis and assumptions used in calculating the tabular discount. For
instance, in the 2018 Fictitious Notes, the company disclosed that tabular workers’
compensation case reserves were discounted under various state laws, reflected a discount
rate of 3.5% or a rate prescribed by the state regulator, and were derived based on a defined
set of U.S. life tables.
In the second part of this note, any non-tabular discounting needs to be disclosed and
described. This should reconcile to the amount of the non-tabular discount that was disclosed
in Schedule P, Part 1, columns 32 and 33. Non-tabular discounting is less common than
tabular discounting and is typically only done in specific cases where a company has been
permitted by its state regulator to discount a specific type of liability. Two lines of business
most commonly used for non-tabular discounting are workers’ compensation and medical
professional liability.
While tabular discounts are calculated for specific pension claims, non-tabular discounts are
typically calculated on the aggregate amount of a specific segment of reserves by using a
projected payment pattern and an assumed discount rate. If a company applies any non-
tabular discounting, they must disclose that and describe the basis in this note. We can see
from the 2018 Fictitious Notes that the company did not apply non-tabular discounting.
The note also requires a company to disclose whether any of the key assumptions used to
discount loss reserves (whether for tabular or non-tabular discounting) have changed relative
to the prior year.
It is important for actuaries and other users of the financial statement to be familiar with this
note because different companies have different discounting policies, and those differences

FINANCIAL REPORTING THROUGH THE LENS OF A PROPERTY/CASUALTY ACTUARY
Part III. SAP in the U.S.: Fundamental Aspects of the Annual Statement
70
must be considered to make a consistent comparison. Non-tabular discounts may be of
particular interest because they usually exist due to a specific exception granted by the
regulator, which may relate to the solvency of an insurer. Furthermore, an actuary that is
opining on the loss reserves of a company must disclose and describe any discounting of loss
reserves in the SAO.
Asbestos/Environmental Reserves
Asbestos and environmental liability reserves have developed adversely over the past several
decades. Therefore, exposure to asbestos or environmental liabilities can represent a
significant source of uncertainty in a company’s loss and LAE reserves. Furthermore,
asbestos and environmental liabilities have consistently developed adversely over the past
several decades. For these reasons, specific qualitative and quantitative disclosure is required
regarding a company’s asbestos and environmental reserves.
This note requires a company to disclose whether it has identified a potential exposure to
asbestos or environmental reserves. These disclosures specifically exclude exposures relating
to policies that were issued specifically to cover asbestos and environmental exposure. If the
company answers affirmatively for either asbestos or environmental exposures, it must
disclose the lines of business affected, the nature of the exposures and the reserving
methodology used to estimate the liability. In addition to those qualitative disclosures, the
company must complete a table that provides the following information for each of the past
five years:
• Beginning reserves (including case, bulk + IBNR Loss & LAE)
• Incurred loss and LAE
• Calendar year payments for losses and LAE
• Ending reserves (including case, bulk + IBNR Loss & LAE)
This information must be provided separately for asbestos and environmental reserves on a
direct, assumed and net of reinsurance basis. The company must also disclose the amount of
the reserves that relate to unreported claims (i.e., pure incurred but not reported (IBNR)).
This note is important to the users of the financial statements because it discloses the
existence of asbestos and environmental exposure, the magnitude of that exposure and the
recent development of that exposure. In cases where these liabilities are material relative to a
company’s overall reserves and/or have consistently been developing adversely, it should
serve as a potential warning sign to the financial health of the company.
Actuaries at insurance companies are often directly involved in the estimation, monitoring
and reporting of asbestos and environmental reserves. In situations where the financial
statements of a company are under financial review, actuaries may also be in the best
position to evaluate the disclosures made here for potential impact on the financial health of
the company.

FINANCIAL REPORTING THROUGH THE LENS OF A PROPERTY/CASUALTY ACTUARY
Part III. SAP in the U.S.: Fundamental Aspects of the Annual Statement
71
In the 2018 Fictitious Notes, the company acknowledged exposure related to asbestos and
environmental liabilities. The company then described its process for identifying, monitoring
and estimating these exposures.
The excerpt below in Table 6 shows an example of the five-year history of the calendar year
incurred and paid asbestos losses and LAE on a net of reinsurance basis for Fictitious. In this
case, we see that the net asbestos liability as of December 31, 2018, was $3.28 million. We
also see that there was adverse development in Fictitious’ asbestos reserves from 2015
through 2018, as evidenced by the incurred losses and LAE each year.
TABLE 6
Net of Ceded Reinsurance
—
Asbestos
20
14
20
15
20
16
201
7
201
8
a.
Beginning reserves (including Case; Bulk +
IBNR Loss & LAE) $5,450,000 $5,023,000 $3,920,000 $3,709,000 $3,426,000
b.
Incurred losses and LAE
— $49,000 $249,000 $188,000 $236,000
c.
Calendar-year payments for losses and LAE
$427,000 $1,153,000 $459,000 $471,000 $382,000
d.
Ending reserves (including Case, Bulk +
IBNR Loss & LAE) $5,023,000 $3,919,000 $3,710,000 $3,426,000 $3,280,000
The excerpt below in Table 7 includes the information on the portion of these reserves that
relates to unreported claims.
TABLE 7
Ending Loss and LAE Reserves for Unreported Claims Included in
Part A Above
1.
Direct basis
$3,116,000
2.
Assumed reinsurance basis
$0
3.
Net of ceded reinsurance basis
$2,782,000
From Tables 6 and 7 we see that $2.78 million out of the total $3.28 million in asbestos
reserves (85%) related to unreported claims. The majority of the liability that is related to
unreported claims underscores the high level of uncertainty in these liabilities.
NOTES THAT MAY BE POTENTIALLY RELEVANT TO ACTUARIES
In addition to the five notes described above, there are several other notes that may be
potentially relevant to actuaries. Actuaries should be familiar with these notes and their
significance, and they may need to review them when they are evaluating the reserves for a
company (particularly if they are the opining actuary).

FINANCIAL REPORTING THROUGH THE LENS OF A PROPERTY/CASUALTY ACTUARY
Part III. SAP in the U.S.: Fundamental Aspects of the Annual Statement
72
Summary of Significant Accounting Policies and Going Concern
This note describes the accounting rules used to produce the Annual Statement, including:
• The source of the accounting rules (typically the NAIC Accounting Practices and
Procedures Manual)
• Any exceptions that were made in applying those rules and the basis for those
exceptions, such as an exception that made with specific state approval
• Additional detail on the company’s significant accounting policies
Where exceptions are made to the rules in the NAIC Accounting Practices and Procedures
Manual, they must be either prescribed or permitted by the domiciliary state. “Prescribed”
refers to practices that are required by state law, and “permitted” refers to approval by the
state regulator.
An actuary who is evaluating the reserves of a company will want to review this note to
identify prescribed or permitted practices or other accounting policies that relate to loss
reserves. Any unexpected deviations described in this note should be evaluated for their
impact on the reserves and general financial health of the insurance company.
The following provides an excerpt of this note as provided in the 2018 Annual Statement for
Fictitious:
1. SUMMARY OF SIGNIFICANT ACCOUNTING POLICIES AND GOING CONCERN
A. Fictitious Insurance Company prepares its statutory financial statements in
conformity with accounting practices prescribed or permitted by the state of
Florida. The state of Florida requires that insurance companies domiciled in
Florida prepare their statutory basis financial statements in accordance with the
National Association of Insurance Commissioners (NAIC) Accounting Practices
and Procedures Manual, subject to any deviations prescribed or permitted by the
Florida Insurance Commissioner. The impact of any permitted accounting
practices on policyholder surplus of the Company is not material.
As shown in this excerpt, the company prepared its statutory financial statements in
conformity with the practices prescribed or permitted by the State of Florida and with the
NAIC Accounting Practices and Procedures Manual, subject to deviations prescribed or
permitted by the Florida Insurance Commissioner. Further, the note indicates that the impact
of any permitted practices on policyholder surplus was not material.
Events Subsequent
Subsequent events are broadly defined as events that occur between the date of the financial
statements (for instance, December 31) and the date that the financial statements are issued

FINANCIAL REPORTING THROUGH THE LENS OF A PROPERTY/CASUALTY ACTUARY
Part III. SAP in the U.S.: Fundamental Aspects of the Annual Statement
73
(for instance, March 1). Within the broad category of subsequent events, there are also two
specific types that should be defined:
• Type 1 (Recognized Subsequent Events) subsequent events provide “additional
evidence with respect to conditions that existed as of the date of the Balance Sheet.”
An example of this type of information would be if updated information was received
on a large claim on January 15, when that claim had already been reported and known
of prior to December 31, and the company deemed that insufficient IBNR was carried
to cover the additional needed reserve.
• Type 2 (Nonrecognized Subsequent Events) subsequent events provide “evidence with
respect to conditions that did not exist at the time of the Balance Sheet.” An example
of a Type 2 subsequent event would be if a new large claim occurred on January 15
and was not previously known.
Type 1 subsequent events should already be reflected in the recorded amounts of the
financial statements because the financial statements should reflect all information that is
known up until the day that the financial statements are issued relating to the conditions that
existed as of the accounting date. Disclosure is not needed unless it is “necessary to keep the
financial statements from being misleading.” For example, if the booked reserves could not be
adjusted in time to incorporate the revised reserve amount necessary to reflect the Type 1
event, this note would disclose the amount by which the reserves need to be adjusted. Note
that changes that are made to reserves due to their normal continual review are not
considered Type 1 events.
Type 2 subsequent events are not already, and should not be, reflected in the financial
statement. However, they should be described in this note if they “may have a material effect
on the financial condition of the company.” The guidance says “may have,” which means that
even if a company has determined that the impact is not material, it should still be disclosed
as long as it “may have” a material impact. Type 2 subsequent event disclosure, of course,
requires use of management’s judgment.
An actuary or other user of the financial statement may consider reviewing this note to verify
whether there are any material subsequent events that are not reflected in the financial
statements. This is of specific importance to an actuary that is opining on a company’s loss
reserves because the opining actuary will need to determine whether a subsequent event is
material to the estimate of the loss reserves and whether that subsequent event should be
considered.
Review of the 2018 Fictitious Notes indicates that no subsequent events were disclosed.

FINANCIAL REPORTING THROUGH THE LENS OF A PROPERTY/CASUALTY ACTUARY
Part III. SAP in the U.S.: Fundamental Aspects of the Annual Statement
74
Intercompany Pooling Arrangements
Intercompany pooling is a common arrangement among companies in a group in which each
of the participants fully cedes all of its business to the pool leader, and then each participant
assumes back a specific percentage of the total.
In these situations, it is important for a regulator or any other user of the financial statements
to understand the pooling arrangement to assess the solvency of the group as a whole. This
note discloses the existence of the pooling arrangement and also describes the cessions and
assumptions that occur. Typically, this includes identification of each company in the group,
the lead company and the pooling percentages for each participant.
In cases where pooling exists, it will affect the various aspects of the Annual Statement in
different ways. Some examples include the following:
• The Underwriting and Investment Exhibit will show direct business written by each
company and the amounts ceded to the lead company in the pool and the portion of
the pool assumed specifically by affiliates.
• Schedule F will show the cessions to the lead company as ceded reinsurance in Part 3
and the assumed business in Part 1.
• Schedule P will show only the pool member’s share of the pooled results.
The 2018 Fictitious Notes indicate that this company did not participate in any intercompany
pooling.
Structured Settlements
A structured settlement refers to a situation where an insurance company settles a claim by
purchasing an annuity on behalf of a claimant. This is most commonly observed on workers’
compensation or general liability claims, and the annuity is usually purchased from a life
insurance company.
When the annuity is purchased (and the claimant is the payee), it is recorded as a paid loss by
the original insurance company, and the claim is considered to be closed. However, if the life
insurance company providing the annuity was ever to become insolvent, it is possible that the
original insurer could still be liable for the remaining portion of the annuity payments.
The purpose of this note is to disclose the total amount of structured settlement payments for
which an insurer could be held liable. Furthermore, if the amount of these remaining
payments from a single life insurance company exceeds 1% of surplus, specific disclosure of
the amount and the company from which the structured settlement was purchased is
required.

FINANCIAL REPORTING THROUGH THE LENS OF A PROPERTY/CASUALTY ACTUARY
Part III. SAP in the U.S.: Fundamental Aspects of the Annual Statement
75
This note is relevant to users of the financial statements because it describes a potential
liability, or credit risk, that is not reflected on the balance sheet. The identification of life
insurers that provide coverage for remaining payments exceeding 1% of surplus allows for
further review of their financial condition to identify any significant issues.
Review of this note in the 2018 Fictitious Notes indicates that in total the company purchased
structured settlements with a statement value of $4.3 million.
High Deductibles
High-deductible policies are commercial insurance policies that have a significant deductible,
such as $250,000, giving the insured a substantial retention on each claim. Under these high-
deductible policies, the insurer pays the full amount of the claim and then seeks
reimbursement from the insured for the portion within the deductible. These types of policies
are most commonly seen in workers’ compensation but also may be used for liability business.
Similar to the situation with structured settlements, these policies can present a credit risk to
the insurer that is not apparent in the financial statements. For unpaid claims, the portion of
the unpaid amount within the deductible is not included within the insurance company’s
booked loss reserve in the Annual Statement. The treatment for both paid and unpaid
deductible losses creates a credit risk for the insurer due to the possibility that the insured
will not reimburse them for the deductible portion of the loss.
This note requires disclosure of the following:
• The amount of reserve credit (i.e., the amount of case reserves established for the
deductible portion of a loss) recorded by the company for unpaid claims.
• The amount of billed but not yet collected deductible reimbursements for paid claims.
To understand the potential impact of this credit risk, an actuary or other user of the financial
statements who is reviewing the financial health of a company can consider the total amount
of credit risk relative to the total unpaid claims and to the company’s surplus.
As noted in the Notes to Financial Statements for Fictitious, Fictitious does not issue any
policies with high deductible plans.
SUMMARY
Notes to financial statements provide additional qualitative and quantitative disclosure to
support the numerical information provided in the statutory financial statements. The Notes
provide additional detail to assist the user of the financial statement in understanding the
numerical exhibits and provide a source of publicly available information on off-balance sheet
items.

FINANCIAL REPORTING THROUGH THE LENS OF A PROPERTY/CASUALTY ACTUARY
Part III. SAP in the U.S.: Fundamental Aspects of the Annual Statement
76
CHAPTER 11. GENERAL INTERROGATORIES
In the previous chapter we discussed the Notes to Financial Statements. These notes provide
additional information at the end of the financial statements in the interest of full disclosure
of a company’s financial condition. The notes address accounting policy and provide
explanatory data and supplemental information to the financial statements. They assist the
reader in interpreting some of the more complex items within a company’s financial
statements by expanding upon and adding clarity to specific items contained in the balance
sheet and income statement. In contrast, the General Interrogatories are a series of questions
within the statutory Annual Statement to which the insurance company is required to
respond. The questions are divided into two parts:
• Part 1, Common Interrogatories, provides general questions applicable to life, health
and property/casualty insurers.
• Part 2 provides questions that are specific to the type of insurance company (e.g., life,
health or property/casualty). In the Property/Casualty Annual Statement, this section
is Property & Casualty Interrogatories.
Similar to the Notes to Financial Statements, the responses provided in the General
Interrogatories provide additional clarity to the reader of the Annual Statement but also serve
to identify additional areas that warrant closer review by regulatory officials.
COMMON INTERROGATORIES
Part 1 contains of the following subheadings: General, Board of Directors, Financial,
Investment and Other. The purpose of each section is to give the reader an understanding of
the company’s operations, business practices, and the types of internal and external controls
in place.
General
The General subsection asks questions pertaining to the following topics:
• Holding company relationships
• Latest regulatory financial examinations
• Excessive sales commission levels
• Merger activity
• Suspension of licenses
• Foreign control
• Exemptions from required regulations
• Whether senior management is subject to a code of ethics

FINANCIAL REPORTING THROUGH THE LENS OF A PROPERTY/CASUALTY ACTUARY
Part III. SAP in the U.S.: Fundamental Aspects of the Annual Statement
77
Answers to these questions provide the reader with additional information about the company
and its discipline in following the “rules.” For example, if a company has suspended licenses or
does not comply with recommendations from the latest financial examinations, there may be
a lack of internal discipline, and this company would therefore be looked at with further
scrutiny by external parties. Likewise, further inquiry may be appropriate if a company
reports excessive commission levels, as this might be a sign that the company is conceding on
commission to maintain business or achieve growth.
The General subsection also provides the name and address of the independent certified
public accountant (CPA) or accounting firm (the auditor) conducting the annual audit and the
appointed actuary.
While important to peruse all the interrogatories, knowledge of the auditor, appointed actuary
and latest financial exam(s) are of particular relevance to the property/casualty actuary.
Audit firm: The CPA opines as to whether the insurance company’s financial statements are
free of material misstatement and prepared in accordance with the accounting principles
used. The audit firm is responsible for reconciling figures contained in a company’s financial
statements to detailed underlying balances and confirming amounts due to or from third
parties.
It is important for the actuary to be aware of any misstatements in the financial statements or
errors in the underlying data relied upon. Further, in accordance with National Association of
Insurance Commissioners (NAIC) data testing requirements,
25
a company’s independent
accountant and appointed actuary are required to communicate so the accountant can
determine which data relied upon by the actuary should be subject to audit testing
procedures.
Actuary: The name, address and affiliation of the appointed actuary are provided in the
General Interrogatories. The appointed actuary is the actuary explicitly appointed by the
insurance company’s board of directors, or equivalent body, to opine on the loss and loss
adjustment expense (LAE) reserves reported in the company’s Annual Statement. It is
important for the user of the Annual Statement to know who the appointed actuary is;
questions pertaining to the Statement of Actuarial Opinion should be addressed to the
appointed actuary.
Latest financial examination: The General Interrogatories also provide information regarding
the latest financial examination performed by state regulatory officials. The interrogatories
include:
• The date of the latest financial exam
25
2018 NAIC Annual Statement Instructions Property/Casualty, page 19.

FINANCIAL REPORTING THROUGH THE LENS OF A PROPERTY/CASUALTY ACTUARY
Part III. SAP in the U.S.: Fundamental Aspects of the Annual Statement
78
• The date through which financial statements were evaluated
• The release date of the examiner’s report
• The name of the department performing the exam
• Whether the insurance company has complied with all adjustments and
recommendations from the examination report
Regulatory examination reports are generally available to the public through the state
insurance department in which the exam was performed. The examination report will provide
the state’s findings with respect to the adequacy of the company’s loss and LAE reserves.
Board of Directors
The Board of Directors subsection of the Common Interrogatories focuses on the board’s role
in overseeing the company’s operations. In particular, it includes questions regarding the
board’s approval of the purchase or sale of investments and whether the company has a
process in place to notify the board of conflicts of interest within the company’s senior
management. The company is also asked whether permanent records of board proceedings
are retained; this enables tracking and monitoring of the board’s oversight role.
Financial
While it is generally assumed that the Annual Statement is prepared in conformity with
Statutory Accounting Principles (SAP), the first question within the Financial subsection asks
if the statement was prepared using another basis (e.g., Generally Accepted Accounting
Principles). The basis of accounting is important for users of the statement and should
probably be read first when opening an Annual Statement. If it is assumed that the Annual
Statement is prepared in conformity with SAP, but it is prepared using a different accounting
basis, then the user may misinterpret individual figures and ultimately a company’s financial
position.
The questions within the remainder of the Financial subsection pertain to loans made to
senior leadership and other stakeholders of the company, assets that the company was
obliged to transfer to another party that were not reported as a liability in the statement,
assessments other than those to a guaranty fund or guaranty association, and amounts due
from affiliates. The purpose is to understand if the company has financial obligations that
have not previously been reported in the Annual Statement and/or if the company is
providing financial support or a lifeline to stakeholders or affiliates.
Investment
The Investment subsection has the most questions within the General Interrogatories (more
than 30). They cover control over assets and investment decisions, security lending programs
and associated collateral, hedging programs, mandatorily convertible preferred stocks or

FINANCIAL REPORTING THROUGH THE LENS OF A PROPERTY/CASUALTY ACTUARY
Part III. SAP in the U.S.: Fundamental Aspects of the Annual Statement
79
bonds, and compliance with the Purposes and Procedures Manual of the NAIC Securities
Valuation Office, among other topics. Here again, the questions pertain to the level of control
the company has over its operations and compliance with the rules.
Other
The Other subsection captures information about payments made to trade associations,
service organizations, statistical or rating bureaus, attorneys or others in connection with
legislative or regulatory matters. Examples of such organizations include the Insurance
Services Office and A.M. Best Company. The company is required to list the names of
organizations where payment exceeded 25% of the subtotal so that the reader can get an idea
of the amount of influence or reliance that the company has on a particular organization,
bureau or legislative matter.
PROPERTY & CASUALTY INTERROGATORIES
Part 2 of the General Interrogatories is specific to property/casualty insurers and provides
more details about the company’s exposures that are not readily determinable based on the
quantitative information contained in the schedules and exhibits within the Annual Statement.
Many of these questions focus on specific exposures that are not generally dealt with by the
property/casualty actuary on a daily basis, such as those pertaining to Medicare supplement
insurance, health lines of business or health savings accounts. However, other questions are
of major interest to actuaries. For example, certain questions center on the company’s
exposure to catastrophic events and excessive loss, the process by which probable maximum
loss is determined and the level of reinsurance protection afforded to protect the company’s
net results against catastrophic losses. These questions (requests) include the following:
• “What provision has this reporting entity made to protect itself from an excessive loss
in the event of a catastrophe under a workers’ compensation contract issued without
limit of loss?”
26
• “Describe the method used to estimate this reporting entity’s probable maximum
insurance loss, and identify the type of insured exposures comprising that probable
maximum loss, the locations of concentrations of those exposures and the external
sources (such as consulting firms or computer software models), if any, used in the
estimation process.”
27
• “What provision has this reporting entity made (such as a catastrophic reinsurance
program) to protect itself from an excessive loss arising from the types and
26
2018 Property/Casualty Annual Statement, General Interrogatory 6.1 (Part 2 Property & Casualty
Interrogatories).
27
Ibid., General Interrogatory 6.2 (Part 2 Property & Casualty Interrogatories).

FINANCIAL REPORTING THROUGH THE LENS OF A PROPERTY/CASUALTY ACTUARY
Part III. SAP in the U.S.: Fundamental Aspects of the Annual Statement
80
concentrations of insured exposures comprising its probable maximum property
insurance loss?”
28
• “Does the reporting entity carry catastrophe reinsurance protection for at least one
reinstatement, in an amount sufficient to cover its estimated probable maximum loss
attributable to a single loss event or occurrence?”
29
• “If no, describe any arrangements or mechanisms employed by the reporting entity to
supplement its catastrophe reinsurance program or to hedge its exposure to
unreinsured catastrophic loss.”
30
Although the General Interrogatories are not included for Fictitious Insurance Company, the
aforementioned questions would be of particular interest to users of Fictitious’ Annual
Statement in light of the company’s catastrophic loss experience in 2018. Review of answers
to the above questions in conjunction with the information provided in Schedules F and P
about Fictitious’ reinsurers and ceded loss ratios would assist the user in evaluating the
adequacy of Fictitious’ reinsurance protection relative to its catastrophe exposures. Other
questions within the Property & Casualty Interrogatories that are of interest include those
pertaining to the use of finite reinsurance. Finite reinsurance was a hot topic in the
property/casualty insurance industry in 2005 when several large insurance companies were
fined by the Securities and Exchange Commission for accounting for finite reinsurance deals
in a way to bolster their financial position.
In its simplest form, finite reinsurance does not transfer underwriting risk; rather it is a play
on interest. Assume an insurance company knows it will have to pay a fixed amount in losses,
say $10 million, in two years. Under a finite reinsurance deal, the insurance company could
take the present value of $10 million and give it to a reinsurance company as “premium,” in
exchange for an agreement that the reinsurer pay the $10 million in losses two years from
now. The amount the reinsurer will have to pay is fixed ($10 million), and the time the
reinsurer will have to pay the losses is fixed (two years); there is no underwriting or timing
risk involved in the transaction.
Using a simplified example, assuming a 5% rate of interest, if the insurance company were to
account for this contract as reinsurance, its balance sheet would show a reduction of
approximately $9 million in cash for premium paid (the present value of $10 million at 5%
interest per year for two years) in return for a corresponding reduction of $10 million in loss
reserves, resulting in a net increase to surplus of approximately $1 million. However, since
there is no underwriting or timing risk, this is more akin to a deposit, such as one with a bank,
and this is how such contracts must be accounted for. There is no surplus relief as a result of
this contract; the insurer still has to pay $10 million in two years.
28
Ibid., General Interrogatory 6.3 (Part 2 Property & Casualty Interrogatories).
29
Ibid., General Interrogatory 6.4 (Part 2 Property & Casualty Interrogatories).
30
Ibid., General Interrogatory 6.5 (Part 2 Property & Casualty Interrogatories).

FINANCIAL REPORTING THROUGH THE LENS OF A PROPERTY/CASUALTY ACTUARY
Part III. SAP in the U.S.: Fundamental Aspects of the Annual Statement
81
Several high-profile insurance companies engaged in finite reinsurance arrangements in the
early 2000s to boost their financial results through improper accounting. This behavior
prompted the NAIC to adopt additional disclosure requirements, including an expansion of the
Property & Casualty Interrogatories. One such interrogatory requires insurers to answer
affirmatively if they ceded reinsurance that:
1. Resulted in underwriting gain (or loss) of more than 5% of prior year surplus or ceded
premiums or loss and LAE reserves of more than 5% of surplus.
2. Was accounted for as reinsurance rather than as a deposit.
3. Had one or more of the following features (“or other features that would have similar
results”
31
):
a. Duration of at least two years and is non-cancelable during the term.
b. Limited cancellation provisions such that the ceding company is required to
enter into a new contract with the same reinsurer or its affiliate.
c. Aggregate stop loss coverage.
d. The right by either party to commute, unless triggered by a downgrade in the
credit rating of the other party.
e. The ability to report or pay losses less frequently than quarterly.
f. Delayed timing of reimbursement to the ceding company.
32
A following interrogatory requires insurers to answer affirmatively if they have entered any
ceded reinsurance contracts where ceded premium is 50% or more than the insurer’s gross
written premium, or 25% or more of the ceded written premium is retroceded to the insurer.
Reinsurance ceded to entities other than captives under the insurer’s control or approved
pooling arrangements is excluded from this interrogatory.
33
If either interrogatory is answered affirmatively by the insurance company, the insurer is
required to file the Reinsurance Summary Supplemental Filing to the Annual Statement. This
filing is due on March 1. Within this filing the insurer is required to disclose:
1. The financial impact on the balance sheet and statement of income if such contracts
were excluded (i.e., the restatement of assets, liabilities, surplus and net income gross
of the reinsurance contract(s)).
2. A summary of the applicable terms of the contract(s) that triggered the affirmative
response.
3. The reasons management entered into the contract, including the expected financial
gain.
34
31
Ibid., General Interrogatory 9.1 (Part 2 Property & Casualty Interrogatories).
32
Ibid., General Interrogatory 9.1 (Part 2 Property & Casualty Interrogatories).
33
Ibid., General Interrogatory 9.2 (Part 2 Property & Casualty Interrogatories).
34
2018 NAIC Annual Statement Instructions Property/Casualty, page 440.

FINANCIAL REPORTING THROUGH THE LENS OF A PROPERTY/CASUALTY ACTUARY
Part III. SAP in the U.S.: Fundamental Aspects of the Annual Statement
82
The intent of these additional interrogatories and the supplemental filing is to identify those
contracts that may be accounted for improperly and therefore warrant further review by
regulatory officials. Knowledge of such contracts is relevant to the actuary as the accounting
treatment may impact the actuary’s evaluation of unpaid claims. If a ceded contract is
accounted for as reinsurance, it will serve to reduce the unpaid claim liabilities; if accounted
for as a deposit, it will not.
Examples of other items addressed within the Property & Casualty Interrogatories that tend
to be a focus of the actuary include:
• Whether there are specific limiting provisions within reinsurance contracts,
guaranteed policies and retrospectively rated policies, as these features may affect
the actuary’s evaluation of unpaid claims.
35
• Any releases of liability under reinsured policies, such that the company could
reassume liability and potentially have its surplus position weakened as a result.
36
• Exposure to warranty business, whereby the adequacy of the unearned premium
reserve would be the focus of attention as the contract terms, and therefore exposure,
tends to continue beyond 12 months.
37
35
2018 Property/Casualty Annual Statement, General Interrogatory 7.1 (Part 2 Property & Casualty
Interrogatories).
36
Ibid., General Interrogatory 8.1 (Part 2 Property & Casualty Interrogatories).
37
Ibid., General Interrogatory 16.1 (Part 2 Property & Casualty Interrogatories).

FINANCIAL REPORTING THROUGH THE LENS OF A PROPERTY/CASUALTY ACTUARY
Part III. SAP in the U.S.: Fundamental Aspects of the Annual Statement
83
CHAPTER 12. FIVE-YEAR HISTORICAL DATA EXHIBIT
OVERVIEW
Most other exhibits and schedules within the Annual Statement provide only one or two years
of financial data for a company. The Five-Year Historical Data exhibit is valuable because it
provides a summarization of key financial figures and statistics from historical Annual
Statements going back five years: the current and prior four. Key line items from the balance
sheet and income statement are included. Also included are operating ratios and ratios
showing one- and two-year development in loss reserves relative to policyholders’ surplus.
This compilation facilitates the identification of trends when evaluating the health of a
property/casualty insurance company.
Following is a brief overview of content that actuaries tend to focus on within this exhibit,
with illustrations using data from Fictitious’ 2018 Annual Statement where deemed relevant.
WRITTEN PREMIUM
The first page of the Five-Year Historical Data exhibit begins with the insurance company’s
revenue. For an insurance company, revenue is in the form of written premium. Gross and net
written premium information is provided. Gross and net amounts are summarized into the
following five lines of business categories:
1. Liability
2. Property
3. Property and liability combined
4. All other
5. Non-proportional reinsurance
A sixth line contains the totals.
This information shows how the company’s premium volume, use of reinsurance and business
mix have changed over time. Things to look out for when assessing the health of an insurance
company include rapid growth or decline in revenue, increases or decreases in the use of
reinsurance protection, and changes in business mix toward riskier or unprofitable lines.
Observations such as these would prompt additional inquiry through review of other
schedules, exhibits and notes within the Annual Statement and a meeting with company
management. For example, if a company significantly increased its use of ceded reinsurance,
we would want to understand the quality of the reinsurance. The Notes to Financial
Statements and Schedule F provide additional information on the company’s reinsurers.
Total gross and net written premium figures from Fictitious’ Five-Year Historical Data exhibit
are displayed in Table 8.

FINANCIAL REPORTING THROUGH THE LENS OF A PROPERTY/CASUALTY ACTUARY
Part III. SAP in the U.S.: Fundamental Aspects of the Annual Statement
84
TABLE 8
Data from Fictitious Insurance Company 2018 Five-Year Historical Data (USD)
201
8
201
7
20
16
20
15
20
14
6. Gross premiums written
28,634,000
28,085,000
29,519,000
31,238,000
31,670,000
2%
-
5%
-
6%
-
1%
12. Net premiums
written
26,752,000
25,936,000
25,521,000
25,583,000
25,363,000
3%
2%
0%
1%
Net/gross ratio
93%
92%
86%
82%
80%
Fictitious experienced an approximate 5% decline in gross writings in 2016 and 2017. This
could have been attributed to many things, including a decrease in concentration in a certain
line of business or risk class, the continued softening of the market observed over this time
period or a decrease in the amount of coverage purchased. Gross written premiums increased
by 2% in 2018, which again could have been a function of the economy or insurance prices
starting to rebound or both.
Over the same period, net written premium volume was relatively flat and even slightly
positive. Calculation of the net-to-gross ratio shows that the company’s net retention had
been growing since 2014, from 80% in 2014 to 93% in 2018. This means that the company
was ceding fewer premium dollars to its reinsurers. This could have been attributed to either
a decision by the company to retain more business or a softening in reinsurance prices over
the period or both. Observations such as these would warrant further inquiry of company
management to fully understand the cause for changes in the company’s direct, assumed and
ceded business volume.
Table 9 shows the gross written premium figures by line of business segment as reported by
Fictitious, below which the corresponding distribution of gross written premium by segment is
shown.

FINANCIAL REPORTING THROUGH THE LENS OF A PROPERTY/CASUALTY ACTUARY
Part III. SAP in the U.S.: Fundamental Aspects of the Annual Statement
85
TABLE 9
Data from Fictitious Insurance Company 2018 Five-Year Historical Data (USD)
Gross premiums written (GPW)
201
8
201
7
20
16
20
15
20
14
1. Liability lines
13,281,000
13,843,000
15,075,000
16,422,000
16,815,000
2. Property lines
5,566,000
4,990,000
5,436,000
5,
925,000
6,155,000
3. Property and liability lines
9,649,000
8,936,000
8,651,000
8,544,000
8,355,000
4. All other lines
138,000
316,000
357,000
347,000
345,000
5. Non
-
proportional reinsurance
lines – – – – –
6. Total
28,634,000
28,085,000
29,519,000
31,
238,000
31,670,000
Distribution of GPW
201
8
201
7
20
16
20
15
20
14
Liability lines
46%
49%
51%
53%
53%
Property lines
19%
18%
18%
19%
19%
Property and liability lines
34%
32%
29%
27%
26%
All other lines
0%
1%
1%
1%
1%
Non
-
proportional reinsurance
lines 0% 0% 0% 0% 0%
Total
100%
100%
100%
100%
100%
For Fictitious, the lines of business flowing into the segments identified in Table 9 are as
follows:
38
1. Liability lines: workers’ compensation, other liability and automobile liability
2. Property lines: fire and auto physical damage
3. Property and liability lines: homeowners and commercial multiple peril
4. All other lines: fidelity
Fictitious does not write any non-proportional reinsurance (line 5).
Over the five-year period ending in 2018, Fictitious’ writings declined in the liability lines (line
1) and grew in the property and liability lines (line 3). Writings in the straight property lines
(line 2) remained consistent over the period.
Property lines tend to be short-tailed in nature; property claims are reported and paid
relatively quickly when compared to liability claims. Shifts from liability to property lines
would tend to result in a reduction in uncertainty surrounding the company’s loss and loss
adjustment expense (LAE) reserves. However, shifts to the property lines increase
uncertainty due to the exposure to catastrophe loss.
A similar analysis can be performed on Fictitious’ net written premium data.
38
Written premium by line of business is shown in Part 1B, Premiums Written, of the U&IE.

FINANCIAL REPORTING THROUGH THE LENS OF A PROPERTY/CASUALTY ACTUARY
Part III. SAP in the U.S.: Fundamental Aspects of the Annual Statement
86
STATEMENT OF INCOME
The Five-Year Historical Data exhibit also provides summarized information from the
Statement of Income that is useful in identifying components of changes in a company’s net
income (e.g., whether attributed to underwriting or investments or other income). Table 10
shows this data for Fictitious.
TABLE 10
Data from Fictitious Insurance Company 2018 Five-Year Historical Data (USD)
Statement of Income
201
8
201
7
20
16
20
15
20
14
13. Net underwriting gain (loss)
(2,1
33
,000)
1,48
8
,000
2,544,000
1,883,000
2,773,000
14.
Net investment gain (loss)
4,305,000
4,41
5
,000
2,850,000
3,993,000
4,747,000
15. Total other income
3
3
,000
4
7
,000
38,000
143,000
47,000
16. Dividends to policyholders
46,000
32,000
23,000
29
,000
31,000
17.
Federal and foreign income taxes
incurred (20,000) 963,000 1,489,000 1,378,000 1,304,000
18. Net income
2,179,000
4,95
5
,000
3,920,000
4,612,000
6,232,000
Increase/(decrease) year
-
over
-
year
(2,77
6
,000)
1,03
5
,000
(692,000)
(1,620,000)
Percentage increase/(decrease) year
-
over-year -56% 26% -15% -26%
We see that Fictitious’ net income was been positive in each of the years 2014 through 2018,
with growth achieved in 2017 over 2016 after two years of decline. The $1 million (+26%)
growth observed in 2017 was predominantly attributed to improvements in the financial
markets and a reduction in taxes. Investment gains improved in 2017
Despite relatively strong return on investments in 2018, Fictitious experienced a 56% decline
in net income in 2018 over 2017 due to a net underwriting loss of $2 million. Given what we
know about the company’s shift toward property lines over the period 2014 through 2018,
and consequential increase in exposure to catastrophe losses, we can hypothesize that the
underwriting loss in 2018 was due to the high frequency of catastrophe events during the
year. Investigation of other statements and exhibits within Fictitious’ Annual Statement can
help us validate our theory.
As discussed in Chapter 8. The Statutory Income Statement: Income and Changes to Surplus,
the Statement of Income on page 4 of the Annual Statement provides the components of net
underwriting gain (loss), net investment income gain (loss) and other income, and each
component can be further investigated through various supporting schedules. For example,
as displayed in the Statement of Income for Fictitious, the net underwriting loss of $2 million
was primarily driven by an increase in losses incurred during 2018 ($17 million in 2018
versus $13 million in 2017, per line 2 of the Statement of Income).
We can drill down further by looking at the one-year development line (Development in
estimated losses and loss expenses incurred prior to current year) within the five-year exhibit

FINANCIAL REPORTING THROUGH THE LENS OF A PROPERTY/CASUALTY ACTUARY
Part III. SAP in the U.S.: Fundamental Aspects of the Annual Statement
87
to see whether this increase was attributed to prior-year development or current-year
incurred losses.
TABLE 11
Data from
Fictitious Insurance Company 201
8
Fiv
e
-
Year Historical Data (USD in 000s)
201
8
201
7
20
16
20
15
20
14
73.
Development in estimated losses
and loss expenses incurred prior to
current year (Schedule P, Part 2,
Summary, Line 12, Column 11)
(875)
(1,354)
(1,618)
(1,959)
(
918
)
As displayed in the one-year development line, loss and defense and cost containment (DCC)
development in 2018 on prior accident years was negative $875,000.
39
This means that the
company experienced favorable development in 2018 on the prior years in the aggregate. As
a result, the underwriting loss in 2018 must have been due to current (2018) accident year
incurreds, providing further evidence that catastrophes were the cause. A review of accident
year 2018 loss and DCC experience per Schedule P can confirm this.
Turning to Schedule P, Part 2, Summary, we see that accident year 2018 incurred loss and
DCC was $19 million, approximately $3 million higher than it had been in the company’s 10-
year history. Later in Schedule P, the line of business detail shows that the company
experienced higher incurred loss and DCC on the homeowners/farmowners line (roughly $4
million on accident year 2018 versus $2.5 million on accident year 2017). This further
suggests that Fictitious, like the rest of the insurance industry, was adversely impacted by the
natural catastrophes in 2018. However, Fictitious appeared to have been relatively
unscathed by the 2017 catastrophes. A review of Fictitious’ mix of business by and within
affected state(s) and discussions with management might help explain why Fictitious was not
as impacted as the rest of the industry by catastrophes in 2017.
With respect to investment gains in 2017, a line-by-line comparison of the Exhibit of Net
Investment Income within the company’s current-year and prior-year Annual Statements can
provide further details on changes in the company’s investment income, as can a line-by-line
comparison of changes in amounts by asset class within the Exhibit of Capital Gains (Losses).
While these two exhibits are not included in the Annual Statement excerpts provided for
Fictitious, a study of the changes in net investment income can be made by reviewing these
exhibits for one of the (real) insurance companies on the CAS Exam 6 U.S. Syllabus.
39
We acknowledge that Schedule P, Part 2, Summary, provides both loss and DCC, while we are focusing on the
change in incurred losses only. However, as shown in the Statement of Income, loss adjustment expenses have not
changed significantly in dollar terms. We therefore feel this comparison is reasonable for illustration purposes.

FINANCIAL REPORTING THROUGH THE LENS OF A PROPERTY/CASUALTY ACTUARY
Part III. SAP in the U.S.: Fundamental Aspects of the Annual Statement
88
Absent these exhibits for Fictitious, we expect that the growth in investment income in 2017
was most likely due to a rebound in the financial markets post crisis.
As displayed in the Five-Year Historical Data exhibit for Fictitious, the decline in taxes in 2018
is directionally consistent with what one would expect with a decline in income. We also
expect the decline in taxes in 2018 to be in part attributed to the Tax Cuts and Jobs Act of
2017 (“TCJA”), which became effective beginning tax year 2018 and changed key federal tax
rules. The changes most significant to property/casualty insurance carriers were related to
the corporate tax rate, the loss reserve discounting rules, and the base erosion and anti-
abuse tax. Further details on the impact of TCJA on property/casualty insurers are provided
in Chapter 26.
However, the decrease in taxes between 2016 and 2017 by approximately $0.5 million (from
$1,489,000 to $963,000) is somewhat counterintuitive. Generally, one would expect to pay
more taxes the higher the income. While not included in the Annual Statement excerpts
provided for Fictitious, the note in the financial statements titled “Income Taxes” (number 9
in the Notes to Financial Statements of the 2018 Annual Statement) can be helpful in
explaining movements in taxes from year to year, such as that which occurred for Fictitious.
This note provides details on deferred tax assets and losses and shows what taxes would have
been if a straight 35% statutory tax rate was used. It also provides the reasons for differences
between the total recorded income tax and taxes at the statutory rate, which might in turn
explain higher or lower taxes paid in a particular year.
BALANCE SHEET
The balance sheet section of the Five-Year Historical Data exhibit contains summarized
information that is useful in identifying components of changes in surplus (e.g., whether
attributed to changes in assets or certain liability items) over time.
Only two major asset categories are provided: (1) total admitted assets and (2) premiums and
considerations. However, the distribution of assets by class is provided further along in the
exhibit (percentage distribution of cash, cash equivalents and invested assets). For trend
analysis, the distribution of assets by class is more useful than the actual dollar amounts.
When analyzing the health of a property/casualty insurer, things to look out for include large
holdings in risky asset classes or changes in mix to riskier classes. However, the user would
also look to the company’s use of hedging vehicles to mitigate increased holdings in riskier
investments, such as derivative instruments (see Chapter 8. The Statutory Income Statement:
Income and Changes to Surplus).
The remaining lines within the balance sheet section of the exhibit are summarized items from
the Liabilities, Surplus and Other Funds page. Of most relevance to the property/casualty
actuary is the level of loss and LAE reserves, unearned premiums, and surplus relative to the
actuary’s knowledge of the underlying business and the changes therein.

FINANCIAL REPORTING THROUGH THE LENS OF A PROPERTY/CASUALTY ACTUARY
Part III. SAP in the U.S.: Fundamental Aspects of the Annual Statement
89
A review of Fictitious’ data shows no significant changes in these items other than a dip in
surplus in 2015 (6% decrease from 2014) and 2017 (12% decrease from 2016). The capital
and surplus account within the Statement of Income shows that the large decrease in 2017
was attributed to sizeable dividends paid to stockholders during the year (approximately $10
million). This can also be seen in the Capital and Surplus Account section of the Five-Year
Historical Data exhibit. This section provides two sources of the change in surplus: that due to
unrealized capital gains (losses) and that resulting from dividends paid by the company to its
stockholders.
RISK-BASED CAPITAL
We will discuss Risk-Based Capital (RBC) in detail in Chapter 19. Risk-Based Capital. It is a
solvency framework developed by the National Association of Insurance Commissioners from
which an amount of regulatory capital is determined formulaically based on the application of
specified factors to an insurance company’s recorded admitted assets and liabilities as of
year-end. The calculated amount of regulatory capital, or RBC, is compared to the total
adjusted capital recorded by the insurance company at year-end to determine the level, if
any, of company or regulatory action required from a solvency perspective.
The components of the RBC ratio are provided in the Five-Year Historical Data exhibit but not
the RBC ratios themselves. However, the user can calculate the RBC ratios from the
information provided in the Five-Year Historical Data exhibit. Table 12 provides the figures
shown in lines 28 and 29 of Fictitious Insurance Company’s 2018 Five-Year Historical Data,
below which we show the RBC ratios that we calculated from lines 28 and 29.
TABLE 12
Data from Fictitious Insurance Company 201
8
Five
-
Year Historical Data (USD)
Risk
-
Based Capital analysis
201
8
201
7
20
16
20
15
20
14
28.
Total adjusted capital
31,024,000
31,608,000
35,793,000
32,572,000
34,567,000
29.
Authorized control level RBC
5,5
88
,000
6,097,300
5,854,000
5,685,000
6,517,000
Total adjusted capital as a percent of
ACL (= Line 28 / Line 29) 555% 518% 611% 573% 530%
Total adjusted capital as a p
ercent of
RBC (= Line 28 / (Line 29*2)) 278% 259% 306% 286% 265%
Reduction in capital to next RBC
level (= Line 28 - (Line 29*2)) 19,848,000 19,413,400 24,085,000 21,202,000 21,533,000
Table 98 of this publication provides the various levels of company and/or regulatory action
in response to a company’s calculated RBC ratios. For Fictitious, the percentage of adjusted
capital to authorized control level (ACL) RBC ranged between 518% to 611% over the five-
year period 2014 through 2018, which is 2.6 to 3.1 times the first level requiring action
(company action level, which is equal to 200% of ACL). This means that Fictitious’ capital in
2018 could have been reduced by $20 million before any action was required under the RBC

FINANCIAL REPORTING THROUGH THE LENS OF A PROPERTY/CASUALTY ACTUARY
Part III. SAP in the U.S.: Fundamental Aspects of the Annual Statement
90
requirements. This was computed by taking the total capital in line 28 and subtracting from it
the upper bound of the range of the first action level of RBC requirements (i.e., 200%).
40
In establishing a materiality standard for Statement of Actuarial Opinion purposes, some
actuaries look at the impact on surplus from a change in RBC levels. In these circumstances,
an increase in reserves by an amount that would cause the company (or regulator) to take
action under RBC is thought to be material. This is discussed further in Chapter 16. Statement
of Actuarial Opinion.
OPERATING PERCENTAGES
Operating percentages provide the distribution of earned premium into its components of
loss, LAE, other underwriting expenses and the profit (loss) from underwriting (net
underwriting gain (loss)) that remains. For Fictitious, the ratios were reasonably consistent
over the five-year period with the exception of 2018. The high loss ratio in 2018 relative to
prior years highlights the spike in losses in 2018 and resulting loss from underwriting.
Spikes or changes in other underwriting expenses directly impact profitability and would be
investigated further as to whether such costs were necessary and/or indicative of costs to be
incurred by the company in the future.
ONE- AND TWO-YEAR LOSS DEVELOPMENT
Actuaries, in particular those that work in the reserving area, pay considerable attention to
the last four lines of the Five-Year Historical Data exhibit (lines 73 through 76 of 2018 Five-
Year Historical Data exhibit), as this information shows how the company’s prior-year loss and
DCC reserves have developed over one- and two-year time horizons.
We already presented the one-year development line (line 73) when interpreting the cause of
the underwriting loss incurred by the company in 2018. The subsequent line (line 74) shows
the relationship of one-year loss and DCC development to the company’s surplus as recorded
in the prior year’s balance sheet. The purpose is to show the impact of adverse or favorable
reserve development on policyholders’ surplus. That is, it shows the percentage of surplus
that would have been absorbed (enhanced) as a result of adverse (favorable) loss
development.
In a perfect world, development would be nil. However, loss reserves represent estimates
made by a company’s management based on information available as of a certain point in
time. It is expected that actual loss emergence will differ from expected, and company
management will revise its estimates each year as additional information becomes available.
As a result, it’s not often that $0 is observed in the one-year (or two-year) development line.
40
$19.920 million = $31.024 million - (2 * $5.552 million).

FINANCIAL REPORTING THROUGH THE LENS OF A PROPERTY/CASUALTY ACTUARY
Part III. SAP in the U.S.: Fundamental Aspects of the Annual Statement
91
The issue here is not that a company experiences development in its loss reserves, but rather
how big the development is and its significance to surplus.
Stakeholders tend to be concerned when large positive numbers are shown in the
development lines as this means that the prior-year reserves were deficient. The question is
whether the increase is attributed to an anomaly or if it is symptomatic of a trend of under-
reserving. Further investigation could be made within the Annual Statement by reading the
Notes to Financial Statements, specifically the note on changes in incurred loss and LAE, and
looking at Schedule P, Part 2, which may show that the adverse development is coming from
a particular year or line of business. Oftentimes, such development is also discussed in public
reports by and on behalf of the company (e.g., Form 10-K for public companies or the AMB
Credit Report for the company published by A.M. Best). However, nothing supplants
discussion with company management.
Table 13 provides both the one-year development line and the relationship of one-year
development to prior-year surplus (line 74) for Fictitious.
TABLE 13
Data from Fictitious Insurance Company 2018 Five-Year Historical Data
201
8
201
7
20
16
20
15
20
14
73.
Development in estimated lo
sses
and loss expenses incurred prior to
current year (Schedule P, Part 2,
Summary, Line 12, Column 11);
USD in 000s
(875)
(1,354)
(1,618)
(1,959)
(
918
)
74.
Percent of development of losses
and loss expenses incurred to
policyholders’ surplus of prior year-
end (line 73 divided by Page 4, Line
21, Column 1 x 100)
(2.8)
(3.8)
(5.0)
(5.
6
)
(2.6)
During 2018, Fictitious’ booked net ultimate loss and DCC reserve estimates on accident
years 2017 and prior developed favorably by $0.9 million (line 73). This means that, with the
benefit of one year’s hindsight, the net loss and DCC reserves recorded by the company as of
December 31, 2017, were overstated by $0.9 million. That overstatement represented 3% of
the company’s surplus as of December 31, 2017 (line 74).
Going back a year, with the benefit of one year’s hindsight, recorded net loss and DCC
reserves as of December 31, 2016, were overstated by $1.4 million, or 4% of surplus.
We can continue going back and observe development in years 2014 through 2016 on prior-
year reserves. For Fictitious, the result was consistent over the five-year period; recorded
loss and DCC reserves (or ultimate loss and DCC estimates) developed favorably in the

FINANCIAL REPORTING THROUGH THE LENS OF A PROPERTY/CASUALTY ACTUARY
Part III. SAP in the U.S.: Fundamental Aspects of the Annual Statement
92
following year. This implies that the company was relatively conservative in establishing its
reserve estimates.
While stakeholders and regulators of insurance companies tend to be more concerned when
development is adverse, large favorable development also raises an issue with certain parties.
For example, the Internal Revenue Service pays close attention to favorable emergence as
overstatements in reserves reduce the amount of taxable income. Additionally, investors
would be concerned that the company is accumulating funds that could be better invested
elsewhere, thereby suppressing the investor’s rate of return.
The two-year development lines show similar information as contained in the one-year lines,
with the exception that development over a two-year period is provided. For example,
Fictitious’ recorded net loss and DCC reserves as of year-end 2016 developed favorably by
$2.6 million in 2017 and 2018. This represents 7.3% of surplus recorded at the end of 2016.
TABLE 14
Data from Fictitious Insurance Company 201
8
Five
-
Year Historical Data
201
8
201
7
20
16
20
15
20
14
75.
Development in estimated losses
and loss expenses incurred two
years before the current year and
prior year (Schedule P, Part 2,
Summary, Line 12, Column 12);
USD in 000s
(2,602)
(2,906)
(3,680)
(2,5
44
)
(
1,059
)
76.
Percent of development of losses
and loss expenses incurred to
policyholders’ surplus of second
prior year-end (Line 75 divided by
Page 4, Line 21, Column 2 x 100)
(7.3)
(8.9)
(10.6)
(7.3)
(3.0)
This information enables the actuary to see whether the development tends to be isolated to
the first year of development or continues to the next. In Fictitious’ case, the favorable
development continued through year two. For example, one-year development on year-end
2016 reserves developed by $1.4 million in 2017 (line 73) and then another $1.2 million in
2018 (per line 75, computed by taking $2.6 million and subtracting the one-year
development of $1.4 million).

FINANCIAL REPORTING THROUGH THE LENS OF A PROPERTY/CASUALTY ACTUARY
Part III. SAP in the U.S.: Fundamental Aspects of the Annual Statement
93
CHAPTER 13. OVERVIEW OF SCHEDULES AND THEIR PURPOSE
OVERVIEW
Schedules A through E
The first eight schedules (Schedules A through E) of the Annual Statement provide further
transparency of the company’s assets, as displayed in the balance sheet of the statutory
financial statements. The purpose of these schedules is to assist stakeholders and regulators
in identifying and analyzing risks inherent in those assets, changes in those assets and
differences in their valuation.
The following outlines the contents of Schedules A through E:

FINANCIAL REPORTING THROUGH THE LENS OF A PROPERTY/CASUALTY ACTUARY
Part III. SAP in the U.S.: Fundamental Aspects of the Annual Statement
94
TABLE 15
Schedule Part Title
A
1
Real Estate
O
wned December 31 of Current Year
A
2
Real Estate Acquired and Additions Made During the Year
A
3
Real Estate Disposed During the Year
B
1
Mortgage Loans Owned December 31 of Current Year
B
2
Mortgage Loans Acquired and Additions Made During the Year
B
3
Mortgage Loans Disposed, Transferred or Repaid During the Year
BA
1
Other Long
-
Term Invested Assets
Owned December 31 of Current Year
BA
2
Other Long
-
Term
Invested Assets
Acquired and Additions Made Duri
ng the
Year
BA
3
Other Long
-
Term Invested Assets
Disposed, Transferred or Repaid During the
Year
D
Part 1
Long
-
Term Bonds
Owned December 31 of Current Year
D
Part 2
-
Section 1
Preferred Stocks
Owned
December 31 of Current Year
D
Part 2
-
Section 2
Common Stocks Owned December 31 of Current Year
D
Part 3
Long
-
Term Bonds and Stocks Acquired During
Current Year
D
Part 4
Long
-
Term Bonds and Stocks Sold, Redeemed or Otherwise Disposed of During
Current Year
D
Part 5
Long
-
Term Bonds and Stocks Acquired During the Year and Fully Disposed of
During Current Year
D
Part 6
-
Section 1
Valuation of
Shares of Subsidiary
, Controlled or Affiliated Companies
D
Part 6
-
Section 2
Valuation of S
hares of Lower Tier Company
DA
Part 1
Short
-
Term Investments Owned December 31 of Current Year
DB
Part A
-
Section 1
Option
s, Caps
, Floors
, Collars
, Swap
s and Forward
s Open December 31, of
Current Year
DB
Part A
-
Section 2
Options, Caps, Floors, Collars, Swaps and
Forwards
Terminated During Current
Year
DB
Part B
-
Section 1
Futures
Contracts Ope
n December 31 of Current Year
DB
Part B
-
Section 2
Futures Contracts Terminated During Current Year
DB
Part C
-
Section 1
Company’s positions in replication (synthetic asset) transactions Open
December 31 of Current Year
DB
Part C
-
Section 2
Company’s
positions in replication (synthetic asset) transactions Terminated
During Current Year
DB
Part D
Counterparty Exposure for Derivative
Instruments Open December 31 of
Current Year
DL
Part 1
Securities Lending Collateral Assets (Reinves
ted Collateral Assets Owned
December 31 Current Year)
DL
Part 2
Securities Lending
Collateral Assets (Reinvested Collateral Assets Owned
December 31 Current Year)
E
Part 1
Cash
E
Part 2
Cash Equivalents
E
Part 3
Special Deposits
There is considerable information within each schedule, including a description of each asset,
its value and the basis for valuation. We do not intend to provide all the details of each asset

FINANCIAL REPORTING THROUGH THE LENS OF A PROPERTY/CASUALTY ACTUARY
Part III. SAP in the U.S.: Fundamental Aspects of the Annual Statement
95
schedule. As discussed previously, most property/casualty actuaries will not need to have a
deep understanding of all of the asset classes on the balance sheet. Therefore, we only
provide a brief description of each schedule and show how the reader can source the items
listed in the asset side of the balance sheet (page 2 of the Annual Statement) to these
schedules.
While we will present each of Schedules A through E in order of presentation in the Annual
Statement, keep in mind the distribution of admitted assets by class for the property/casualty
industry as a whole, as was provided in Chapter 7. Statutory Balance Sheet: A Measure of
Solvency. Table 16 provides a comparison of the distribution for the industry to that of
Fictitious Insurance Company as of December 31, 2018.
TABLE 16
41
Summary of Net Admitted Assets
(column 3) on Page 2 of the Annual Statement
Assets
Line Number
per Page 2
Schedule
Reference
Property
Casualty
Industry
Fictitious
Insurance
Company
Investments
B
onds
1
D
–
Part 1
5
0
.7%
58.7%
Preferred stocks
2.1
D
–
Part 2
–
Section 1
0.
3
%
0.0%
Common stocks
2.2
D
–
Part 2
–
Section 2
1
9.2
%
19.3%
Mortgage loans
3.1 + 3.2
B
1.0
%
0.2%
Real estate
4.1 + 4.2 + 4.3
A
0.7%
3.8%
Cash and short
-
term investments
5
E, DA
5.0
%
1.0%
Contract loans
6
0.0%
0.0%
Derivative
s
7
DB
0.0%
0.0%
Other investments
8 + 9 + 10 + 11
BA, DL
6.7
%
4.7%
Total cash and investments
12
84.
1
%
87.8%
Total assets
28
100.0%
100.0%
Note: Contract loans are loans on contracts issued by the insurance company. They typically pertain to life insurance
contracts. There is no schedule within the Annual Statement that pertains to or provides additional disclosure about contract
loans.
The assets detailed in Schedules A through C and E make up a relatively small portion of the
total admitted assets of the property/casualty insurance industry at year-end 2018 (less than
15%). This relationship has remained relatively consistent over the years. Property/casualty
insurers tend to invest in relatively short-term, fixed assets of low risk given their need to be
able to pay claims emanating from short-term contracts (as opposed to long-term life
insurance contracts). As a result, the largest holding of a property/casualty insurer tends to
41
The distribution of assets by class within this table is based on admitted assets. Schedules A through E provide
supporting detail for total assets, including amounts that become nonadmitted in column 2 of the asset side of the
statutory balance sheet.

FINANCIAL REPORTING THROUGH THE LENS OF A PROPERTY/CASUALTY ACTUARY
Part III. SAP in the U.S.: Fundamental Aspects of the Annual Statement
96
be in bonds, followed by common stocks. Therefore, Schedule D tends to be the most
populated of the asset schedules within the Annual Statement.
In assessing the financial health of an insurance company, it is important to understand
differences in the distribution of assets by class relative to the industry. In particular, large
concentrations in riskier asset classes would warrant additional scrutiny. The information
contained in Schedules A through E and in the notes and interrogatories within the Annual
Statement will provide some level of quantitative and qualitative detail to aid in the
assessment. However, enhanced understanding will come through inquiries of management
as to its investment policy, including any hedging strategies that have been implemented to
mitigate investments in higher-risk asset classes.
Schedules F and P
Property/casualty actuaries tend to spend more time focusing on page 3 (Liabilities) of the
balance sheet than on page 2 (Assets). Therefore, of all the schedules within the Annual
Statement, property/casualty actuaries tend to spend the most time with Schedules F and P,
in particular Schedule P. Schedule F pertains to reinsurance accounting, and Schedule P
pertains to loss and loss adjustment expense reserves. We will devote much of our attention
to these Annual Statement schedules in separate chapters for each (Chapter 14. Schedule F
and Chapter 15. Schedule P).
Schedules T and Y
The remaining two schedules, Schedule T and Schedule Y, will be discussed at the end of this
chapter. These schedules provide details on the insurance company’s premium writings by
state and organizational structure, respectively.
SCHEDULE A
Schedule A provides information on real estate directly owned by the insurance company.
Schedule A, Part 1 provides a detailed listing of all real estate owned by the company as of
December 31 of the current year, while Parts 2 and 3 provide a detailed listing of real estate
acquired and disposed during the year, respectively.
Schedule A, Part 1, column 9, Book/Adjusted Carrying Value Less Encumbrances, is the
source of the information provided in line 4 of the asset side of the balance sheet. Amounts
are provided for each property that the reporting entity owns, grouped in the same three
parts as shown in line 4 of page 2:
4.1 Properties occupied by the company
4.2 Properties held for the production of income
4.3 Properties held for sale

FINANCIAL REPORTING THROUGH THE LENS OF A PROPERTY/CASUALTY ACTUARY
Part III. SAP in the U.S.: Fundamental Aspects of the Annual Statement
97
All figures are shown less the amount of any encumbrances, which include items such as a
lien on the company’s property or outstanding principal balance of a mortgaged property.
Consistent with the rest of the property/casualty insurance industry (1%), real estate was a
small asset class for Fictitious in 2018, representing less than 4% of its total assets. Although
small, actuaries will look at the level of an insurance company’s investment in long-term
assets and associated cash flows relative to the cash outflows of its liabilities. For example, a
property/casualty insurer writing short-tailed lines of business (e.g., homeowners) will require
relatively liquid and continual flows from its assets to pay its claims. A large proportion of this
company’s assets in real estate holdings, or other longer-term assets that do not have
constant outflows, might raise questions about liquidity of the company’s assets. This is
particularly true during unstable economic times when the real estate market is at a low and
the seller may not be able to dispose of the investment let alone get the expected value.
Schedule A, Part 3 shows what the reporting entity was able to sell real estate investments
for over the past year, relative to the value of the investment as shown in the entity’s prior-
year statement.
SCHEDULE B
Schedule B provides information on mortgage loans owned by the insurance company that
are secured by real estate. These are instances where the insurance company has issued a
mortgage loan to another party.
Schedule B is organized in the same three parts as Schedule A. Part 1 provides a detailed
listing of all mortgage loans owned by the company as of December 31 of the current year,
while Parts 2 and 3 provide a detailed listing of mortgage loans acquired and disposed during
the year, respectively. Part 3 includes mortgage loans transferred or repaid during the year.
Part 1 is the source of the information provided in line 3 of the asset side of the balance
sheet. Line 3 of the asset side of the balance sheet is broken up into two parts:
3.1 First liens
3.2 Other than first liens
The source of the figures provided in line 3 is column 8, book value/recorded investment
excluding accrued interest, of Schedule B, Part 1. The figures in column 8 reconcile to the
amounts in lines 3.1 and 3.2 on the asset side of the balance sheet. However, it is not evident
from Schedule B as to which loans are first liens.
Part 1 provides a detailed listing of mortgage loans owned by the company in the following
groupings:
• Mortgages in good standing, which are those loans where the terms are being met by
borrowers.

FINANCIAL REPORTING THROUGH THE LENS OF A PROPERTY/CASUALTY ACTUARY
Part III. SAP in the U.S.: Fundamental Aspects of the Annual Statement
98
• Restructured mortgages, which are those loans where the terms have been
restructured in 1986 or subsequent due to delinquency.
• Mortgages with interest more than 90 days due and not in the process of foreclosure.
• Mortgages in the process of foreclosure.
Issuing mortgages is not a core business strategy of a property/casualty insurance company.
Further, mortgage loans are relatively illiquid assets. Therefore, insurers don’t have large
holdings in Schedule B assets. However, for those insurance companies that do invest in
mortgage loans, the groupings provided in Schedule B provide the reader with a sense of the
risk associated with the company’s mortgage loan investments. For example, investments in
mortgages in the process of foreclosure are riskier than those in good standing.
Only 0.2% of Fictitious’ assets were invested in mortgage loans on real estate as of December
31, 2018, as compared to 0.3% for the industry.
SCHEDULE BA
Schedule BA provides information on other long-term invested assets owned by the insurance
company. These are assets not included in any of the other invested asset schedules, such as
real estate that is not owned directly by the insurance company and therefore excluded from
Schedule A. Other examples of BA assets include investments in joint ventures, partnership
interests and surplus debentures.
Schedule BA, Part 1 provides a detailed listing of other long-term invested assets owned by
the company as of December 31 of the current year, while Parts 2 and 3 provide a detailed
listing of other long-term invested assets acquired and disposed during the year, respectively.
Part 3 includes other long-term invested assets transferred or repaid during the year.
The total in column 12, book/adjusted carrying value less encumbrances, of Schedule BA,
Part 1, is the source of the figure provided in line 8 of the asset side of the balance sheet.
As with real estate investments, actuaries will look at the level of cash flows from a
company’s long-term invested assets relative to the duration of its liabilities for liquidity
purposes.
As displayed in Table 17, Fictitious had only 5% of its assets invested in Schedule BA assets at
year-end 2018. Schedule BA assets are included within the other investments line. Other
investments also include receivables for securities, securities lending reinvested collateral
assets and aggregate write-ins for invested assets.

FINANCIAL REPORTING THROUGH THE LENS OF A PROPERTY/CASUALTY ACTUARY
Part III. SAP in the U.S.: Fundamental Aspects of the Annual Statement
99
TABLE 17
Current-Year Assets, 2018 Annual Statement Page 2, Column 1 (USD)
8. Other invested assets
(Schedule BA)
4,726,000
28. Total assets
101,454,000
Percentage of total assets
(Row 8 / Row 28)
4.7%
SCHEDULE D
Schedule D provides information on bonds and stocks owned by the insurance company. It is
broken into six parts, 1 through 6. The amounts shown on the assets side of the balance sheet
for bonds and stocks comes from the book/adjusted carrying value column, within Schedule
D, Parts 1 and 2.
Part 1
Part 1 provides a detailed listing of the long-term bonds and certificates of deposit (CDs)
owned by the insurance company as of December 31 of the current year. The term “long-
term” is intended to exclude bonds and CDs with maturity or repurchase dates one year or
less from the date acquired and cash equivalents with maturities of three months or less.
Bonds that are not long term are reported in other schedules. Bonds with maturities of one
year or less are reported in Schedule DA. CDs with maturities of one year or less are reported
in Schedule E, Part 1. Cash equivalents are reported in Schedule E, Part 2. Schedules DA and
E are discussed in subsequent sections of this chapter.
The source of the balance sheet figure for bonds is the total in column 11 (Book/Adjusted
Carrying Value) of Schedule D, Part 1.
In Part 1, bonds are separated into the following categories:
• U.S. governments
• All other governments
• U.S. states, territories and possessions (direct and guaranteed)
• U.S. political subdivisions of states, territories and possessions (direct and
guaranteed)
• U.S. special revenue and special assessment obligations and all non-guaranteed
obligations of agencies and authorities of governments and their political subdivisions
• Industrial and miscellaneous (unaffiliated)
• Hybrid securities
• Parent, subsidiaries and affiliates

FINANCIAL REPORTING THROUGH THE LENS OF A PROPERTY/CASUALTY ACTUARY
Part III. SAP in the U.S.: Fundamental Aspects of the Annual Statement
100
Within each of the aforementioned categories, there are issuer obligations, residential
mortgage-backed securities (MBS), commercial MBS, and other loan-back and structured
securities, with subtotals for each.
In addition to book/adjusted carrying value, the columns within Part 1 enable the user to
obtain an understanding of fluctuations in value over the past year and time to maturity of
each bond. As noted, users of the Annual Statement consider time to maturity, and therefore
liquidity, relative to liability duration.
Part 2
Part 2 provides a detailed listing of the stocks owned by the insurance company as of
December 31 of the current year. Preferred stocks are in Section 1 of Schedule D, Part 2, and
Common stocks are in Section 2.
Schedule D, Part 2 is the source of the information provided within line 2 of the asset side of
the balance sheet titled “Stocks (Schedule D).”
The source of the balance sheet figure for preferred stocks is the total in column 8,
Book/Adjusted Carrying Value, of Schedule D, Part 2, Section 1, whereas the source for
common stocks is the total in column 6, Book/Adjusted Carrying Value, of Schedule D, Part 2,
Section 2.
In Part 2, Section 1 of Schedule D, preferred stocks are separated into the following
categories:
• Industrial and miscellaneous (unaffiliated)
• Parent, subsidiaries and affiliates
Part 2, Section 2 has the additional categories for common stocks of:
• Mutual funds
• Money market mutual funds
Parts 3 through 6
Part 3 provides a detailed listing of long-term bonds and stocks acquired during the current
year and still owned by the company as of December 31 of the current year. Those acquired
and disposed of during the current year are only provided in subtotal in Part 3, with the
details reported in Part 5.
Part 4 provides a detailed listing of long-term bonds and stocks that were owned as of the
beginning of the current year and disposed of during the year through sale, redemption or

FINANCIAL REPORTING THROUGH THE LENS OF A PROPERTY/CASUALTY ACTUARY
Part III. SAP in the U.S.: Fundamental Aspects of the Annual Statement
101
other means. Those acquired and sold during the current year are provided in detail in Part 5,
with only subtotals in Part 4.
Part 6 provides a detailed listing of preferred and common stocks in affiliated companies. This
is particularly relevant in the calculation of the R
0
charge in the RBC calculation, as we will see
in Chapter 19. Risk-Based Capital.
SCHEDULE DA
Schedule DA provides information on short-term investments owned by the insurance
company. According to the 2018 National Association of Insurance Commissioners (NAIC)
Annual Statement Instructions Property/Casualty, this schedule is to “include all investments
whose maturities (or repurchase dates under repurchase agreement) at the time of
acquisition were one year or less except those defined as cash or cash equivalents in
accordance with Statement of Statutory Accounting Principles No. 2R, Cash, Cash
Equivalents, Drafts, and Short-term Investments.”
42
Schedule DA, Part 1 provides a detailed listing of short-term investments by the company as
of December 31 of the current year. This is the source of the information provided within line
5 of the asset side of the balance sheet.
Short-term investments can include the following asset classes:
• Bonds
• Mortgage loans and other short-term invested assets for parent, subsidiaries and
affiliates
• Mortgage loans
• Exempt money market mutual funds
• Class one money market mutual funds
• Other short-term invested assets
Fictitious had less than 1% of its assets invested in short-term investments in 2018.
SCHEDULE DB
Schedule DB provides information on derivative instruments owned by the insurance
company. It is broken into four parts, A through D. Part A provides the company’s positions in
options, caps, floors, collars, swaps and forwards. Part B provides the company’s positions in
futures contracts. Part C provides the company’s positions in replication (synthetic asset)
transactions. And in Part D, the company reports counterparty exposure for derivative
42
2018 NAIC Annual Statement Instructions Property/Casualty, page 367.

FINANCIAL REPORTING THROUGH THE LENS OF A PROPERTY/CASUALTY ACTUARY
Part III. SAP in the U.S.: Fundamental Aspects of the Annual Statement
102
instruments open December 31 of the current year. Counterparty exposure is the exposure to
credit risk.
Parts A and B are further broken into two sections. Section 1 provides open positions during
the year, and Section 2 provides positions terminated during the year.
Schedule DB, Parts A and B are the source of the information provided within line 7 of the
asset side of the balance sheet, Derivatives (Schedule DB).
While property/casualty insurance companies do not invest much in the derivatives market,
derivatives are used to hedge the mismatch between the timing and payment of assets and
liabilities. A company investing in a greater proportion of risky assets than the industry (say a
higher proportion in common stocks than bonds), could be expected by its stakeholders to
have a hedging strategy in place to mitigate those risks.
As displayed on line 7 of the asset side of its balance sheet, Fictitious did not use derivatives
in its investment strategy in 2018.
SCHEDULE DL
Schedule DL provides information on securities lending collateral assets. Schedule DL is a
fairly new schedule in the Annual Statement, added in 2010 as a result of the financial crisis
in 2008.
43
Securities lending received a lot of publicity during the financial crisis of September 2008.
Securities lending involves a company lending securities that it does not actively trade to
another party for a fee. The borrower will generally sell the borrowed security, in anticipation
of repurchasing it at a lower price before returning it to the lender. The difference between
the sale price and repurchase price is profit to the borrower.
The borrower is required to post collateral with the lender. This collateral may in turn be
invested by the lender; however, the lender needs to have the collateral available for return
when the borrower decides to return the borrowed security. These arrangements tend to be
for less than a year, and the borrower generally can return the security on relatively short
notice. Therefore, a prudent investment strategy would call for investment of the collateral by
the lender in short-term, low-risk, liquid markets. Investment in long-term, riskier securities is
one of the causes of the financial crisis in 2008.
According to an article by the NAIC and The Center for Insurance Policy and Research,
44
American International Group (AIG) was involved in securities lending whereby securities
owned were loaned in exchange for fee and cash collateral. During the period 2005 through
43
NAIC and The Center for Insurance Policy and Research, Capital Markets Special Report, Securities Lending in the
Insurance Industry, http://www.naic.org/capital_markets_archive/110708.htm, (July 11, 2011)
44
Ibid.

FINANCIAL REPORTING THROUGH THE LENS OF A PROPERTY/CASUALTY ACTUARY
Part III. SAP in the U.S.: Fundamental Aspects of the Annual Statement
103
2007, investments of the collateral were made in long-term subprime residential MBS, which
subsequently experienced significant declines in market value. When the borrowers came
back to AIG to exchange the borrowed securities for the cash collateral they had provided,
AIG was experiencing liquidity constraints. The demand for cash from securities lending
counterparties put further constraints on AIG, resulting in regulators and the U.S.
government stepping in to help alleviate the liquidity issue and reduce strains on AIG’s capital.
While securities lending was not the main cause of the financial crisis in 2008, one of the
many lessons learned was the lack of transparency in the securities lending market. Schedule
DL was created to provide further transparency by providing detailed information on the
collateral assets that are reinvested by the insurance company, including the fair value and
book value and the date the agreements mature. As the length of the agreement term
increases, so does the risk to the insurance company. If borrowers in the company’s securities
lending program were to return the borrowed securities and request their collateral back with
short notice, the company may have difficulty meeting the cash (collateral) demand.
45
Schedule DL, Part 1 contains those collateral assets that are not included in other investment
schedules within the Annual Statement (e.g., Schedule A, B, BA, D, DA and E). Part 2 contains
those that are reported in the other asset schedules. Therefore, Part 1 is the source of the
information provided in line 10 of the asset side of the balance sheet.
The total in column 6, Book/Adjusted Carrying Value, of Schedule DL, Part 1, is the source of
line 10 of the asset side of the balance sheet.
As displayed in Table 18, Fictitious had an immaterial securities lending program relative to
total assets and policyholders’ surplus at year-end 2018. As a result, sudden demand to
return collateral to a borrower would not have had a significant impact on Fictitious’ balance
sheet.
TABLE 18
Current-Year Assets, 2018 Annual Statement Page 2, Column 1 (USD)
10. Securities lending reinvested collateral assets
(Schedule DL)
79,000
28. Total assets
101,454,000
Percentage reinvested collateral assets
(Row 10 / Row 28)
0.08%
Total PHS
31,024,00
0
Percentage reinvested collateral assets
0.25%
45
Regulators became aware of this strategy as a result of the financial examination process, which occurs only
once every three to five years.

FINANCIAL REPORTING THROUGH THE LENS OF A PROPERTY/CASUALTY ACTUARY
Part III. SAP in the U.S.: Fundamental Aspects of the Annual Statement
104
SCHEDULE E
Schedule E provides information on the insurance company’s cash and cash equivalents.
Schedule E, Part 1 provides:
• A detailed listing of cash on deposit with banks, trust companies, and savings and loan
and building and loan associations
• Totals for cash held in the company’s offices
• CDs maturing one year or less (long-term CDs are reporting in Schedule D)
Part 2 provides a detailed listing of investments in what are referred to as cash equivalents
and are therefore maturing within three months or less.
Part 3 provides a detailed listing of special deposits, which include assets reported in the
various asset schedules within the Annual Statement but are segregated for a special
purpose, such as bail bonds, workers’ compensation, property and casualty insurance,
collateral and escrow.
Column 6, Balance, of Schedule E, Part 1, is the source of the cash amount included in line 5
of the asset side of the balance sheet. Column 6, book/adjusted carrying value of Schedule E,
Part 2, is the source of the amount of cash equivalents, which are also included in line 5.
Table 19 shows that Fictitious had less than 1% of its assets in cash and cash equivalents at
year-end 2018.
TABLE 19
Current
-
Year Assets, 201
8
Annual Statement Page 2, Column 1 (USD)
5.
Cash ($153,000, Sch. E
-
Part 1), cash equivalents ($0, Sch. E
-
Part2) and
short-term investments ($829,000, Sch. DA)
983,000
28. Total assets
101,454,000
Percentage of total assets
(Row 5 / Row 28)
1.0%
SCHEDULE T
Schedule T has two parts:
1. Exhibit of Premiums Written
2. Interstate Compact — Exhibit of Premiums Written

FINANCIAL REPORTING THROUGH THE LENS OF A PROPERTY/CASUALTY ACTUARY
Part III. SAP in the U.S.: Fundamental Aspects of the Annual Statement
105
Each part is arranged showing its content by U.S. state (50); the District of Columbia; five
U.S. territories (American Samoa, Guam, Puerto Rico, U.S. Virgin Islands and Northern
Mariana Islands); Canada; and a line for aggregate other alien territories.
46
The following provides a general description of the content of each part and their use(s).
Exhibit of Premiums Written
The purpose of this schedule is to apportion premiums, losses and other items amongst the
states or territories in which the company writes business.
The first column shows the “active status” of the company for each state/territory. Active
status is denoted by:
L: Licensed insurance carrier or domiciled Risk Retention Group (RRG)
R: Registered — non-domiciled RRGs
Q: Qualified or accredited reinsurer
E: Eligible — reporting entities eligible or approved to write surplus lines in the state
N: None of the above — not allowed to write business in the state
The total line of this column shows the number of states/territories that the company is
licensed in.
Direct losses, premiums and other information are required to be allocated by state/territory
regardless of the active status reported. The information requested includes:
• Written premiums
• Earned premiums
• Policyholder dividends
• Paid losses
• Incurred Losses
• Unpaid losses
• Finance and service charges
• Direct premiums written for federal purchasing groups
The complicated part of completing this schedule is figuring out how to allocate the foregoing
items by state/territory. The NAIC Annual Statement Instructions Property/Casualty looks for
the premiums to be reported “based on the physical location of the insured risk (except
46
According to the glossary in the textbook Property-Casualty Insurance Accounting issued by Insurance
Accounting & Systems Association, Inc., Eighth Edition (2003), First Addendum (2006), an alien insurance company
is defined as “An insurer or reinsurer domiciled outside the U.S. but conducting an insurance or reinsurance
business in the U.S.”

FINANCIAL REPORTING THROUGH THE LENS OF A PROPERTY/CASUALTY ACTUARY
Part III. SAP in the U.S.: Fundamental Aspects of the Annual Statement
106
individual and group health insurance).”
47
Losses are to be reported to the states where the
associated premium is allocated.
For example, an insurer writes workers’ compensation insurance for an organization that has
employees located across the country. The foregoing items need to be allocated to each
state/territory based on primary workplace of each employee. Table 20 shows additional
examples of the basis for allocating premiums and losses by state/territory, according to the
NAIC instructions.
TABLE 20
Line of Business Basis for Allocation by State
Property lines,
such as fire,
homeowners, boiler and
machinery
Location of property
Marine coverages, where property is in transit
Beginning state location
Automobile lines
Location of principal garage of each
automobile
Liability lines (other than auto) where
premium determined
per location
Location of principal office of operation
Companies are required to describe the basis for the allocation in the footnote of Schedule T.
Schedule T is useful to actuaries in several instances, such as the following:
• Actuaries use this schedule to learn where the company writes its business to further
research and consider the insurance laws of those states. This is particularly important
for workers’ compensation insurers where estimates of unpaid claims depend on each
state’s laws.
• Actuaries also look to this schedule over a series of historical Annual Statements to
see if the company has changed geographic concentration or is growing in a particular
state. In addition to regulatory differences by state, changes in geographic mix have
an impact on the exposures. For example, for a company writing in California or
among fault lines, consideration should be made of the company’s exposure to
earthquakes.
• For a company where industry loss development factors are used in reserving,
actuaries may look to this schedule for a distribution of losses by state to determine
weights to apply to industry factors by state.
In addition, as we shall see in Chapter 18. Insurance Expense Exhibit, the totals in Schedule T
are used as a means of reconciling items contained in the Insurance Expense Exhibit.
47
2018 NAIC Annual Statement Instructions Property/Casualty, page 241.

FINANCIAL REPORTING THROUGH THE LENS OF A PROPERTY/CASUALTY ACTUARY
Part III. SAP in the U.S.: Fundamental Aspects of the Annual Statement
107
Interstate Compact — Exhibit of Premiums Written
There is another part to Schedule T that is less well-known to property/casualty actuaries:
Interstate Compact — Exhibit of Premiums Written and Allocated by States and Territories.
Part 2 only pertains to property/casualty insurers that also write life insurance, annuities,
disability income and long-term care insurance products. The purpose of Part 2 is for
regulators to monitor writings in these products for consumer protection purposes.
SCHEDULE Y
Schedule Y, Information Concerning Activities of Insurer Members of a Holding Company
Group, has two parts:
1. Organizational chart
2. Summary of insurer’s transactions with any affiliates
The following provides a brief description of the content and purpose of each.
Part 1 — Organizational Chart
Part 1 is required for those companies that file a registration statement under the Insurance
Holding Company System Regulatory Act of the company’s domiciliary state.
48
This part provides exactly what its name says, an organizational chart. In simplest terms, it is
similar to a family tree, showing a pictorial representation of where the company lies within
an organization and its relationship to the other members of the organization.
We often hear the phrases “sister company,” “parent company” and “holding company,” but
until you see the schematic, it can be difficult to understand where a company fits within an
organization. Knowing this and the company’s purpose relative to its affiliates is important.
For example, the company may have an affiliated managing general agent or other agency
that produces its business, or it may have an affiliated claims administrative organization.
Consideration of the affiliate’s underwriting philosophy and/or claims handling practices is
significant in estimating unpaid claims and establishing reserves for the company’s liabilities,
including those for adjusting expenses.
Sometimes this part is provided in list form as opposed to an actual chart due to the number
of companies involved.
48
Ibid., page 247.

FINANCIAL REPORTING THROUGH THE LENS OF A PROPERTY/CASUALTY ACTUARY
Part III. SAP in the U.S.: Fundamental Aspects of the Annual Statement
108
Part 1A — Detail of Insurance Holding Company System
This part must be completed by members of a holding company system. The purpose is to
provide information about the relationship between the reporting entity and any parent,
subsidiary(ies) and/or affiliate(s). The relationship is identified in Part 1A as either:
• Upstream direct parent (UDP)
• Upstream indirect parent (UIP)
• Downstream subsidiary (DS)
• Insurance affiliate (IA)
• Non-insurance affiliate (NIA)
• Other, which requires an explanation of the relationship in the footnotes to this part
(OTH)
Additionally, the controlling entity in the relationship is provided, along with the type of
control that the entity has over the other:
• Control through ownership
• Control at the board of directors level
• Control through management
• Control by acting as the attorney-in-fact
• Controlling influence
• Other
If the reporting entity is a member of a holding company system, the reporting entity must
include the above items for each parent, subsidiary or affiliate of the reporting entity whose
names are listed in column 8 of Schedule Y.
According to the NAIC 2018 Annual Statement Instructions Property/Casualty, which
references the Insurance Holding Company System Regulatory Act, “Control shall be
presumed to exist if any person, directly or indirectly, owns, controls, holds with the power to
vote, or holds proxies representing, ten percent (10%) or more of the voting securities by
another person.”
49
As we shall see in Chapter 19. Risk-Based Capital, this information is particularly useful in
determining the RBC R
0
charge for investments in insurance affiliates.
Part 2 — Summary of Insurer’s Transactions With Any Affiliates
Schedule Y, Part 2, provides a listing of transactions among members of the holding company
system where an insurance affiliate was a party to the transaction. Examples include:
49
Ibid., page 249.

FINANCIAL REPORTING THROUGH THE LENS OF A PROPERTY/CASUALTY ACTUARY
Part III. SAP in the U.S.: Fundamental Aspects of the Annual Statement
109
• Shareholder dividends
• Capital infusions
• Purchases/sales of loans or real estate
• Management agreements and service contracts
• Income (disbursements) incurred under reinsurance contracts and reinsurance
recoverable (only those transactions that took place during the reporting period are
included)
The purpose of this part of Schedule Y is to assist regulators in monitoring monetary flows in
and out of insurance company affiliates. This schedule is the same for all members of an
insurance holding company system. Therefore, the totals all balance to zero, as an outflow
from one company is offset by the inflow to another.

FINANCIAL REPORTING THROUGH THE LENS OF A PROPERTY/CASUALTY ACTUARY
Part III. SAP in the U.S.: Fundamental Aspects of the Annual Statement
110
CHAPTER 14. SCHEDULE F
OVERVIEW
As noted in the previous Chapter 13. Overview of Schedules and Their Purpose, Schedule F
and Schedule P are two of the Annual Statement schedules that property/casualty actuaries
tend to use most. In this chapter we will focus on the content of Schedule F; Chapter 15
focuses on the content of Schedule P.
Schedule F provides details underlying an insurance company’s reinsurance transactions on
prospective contracts
50
that meet the conditions for reinsurance accounting as defined in
SSAP No. 62R. It includes the names of the counterparties to the transactions and the
premium, loss and expense amounts that emanate from those transactions as of
December 31 of the reporting year. This information is important to actuaries for several
reasons:
• Loss and loss adjustment expense (LAE) reserves recorded by an insurance company
include business assumed by the company. Knowledge of the source and amount of
assumed reinsurance provides valuable information to an actuary in assessing the
reasonableness of the gross and net loss and LAE reserve balances. Schedule F, Part 1
provides a listing of assumed premiums and losses by ceding company.
• Loss and LAE reserves recorded on an insurance company’s statutory balance sheet
are net of reinsurance. Considerable focus is placed on the collectability of that
reinsurance by users of the Annual Statement, particularly regulators. In fact, the
NAIC Instructions to the Statement of Actuarial Opinion require the Appointed Actuary
to provide relevant comment paragraphs to address reinsurance. According to the
NAIC Instructions, “Before commenting on reinsurance collectability, the actuary
should solicit information from management on any actual collectability problems,
review ratings given to reinsurers by a recognized rating service, and examine
Schedule F for the current year for indications of regulatory action or reinsurance
recoverable on paid losses over 90 days past due.”
51
Schedule F, Part 3 provides the name of each of the company’s reinsurers, a listing of
liability amounts ceded to each reinsurer and the amount of collateral held by the
insurance company in support of those liabilities. Using this information, research can
be done on the financial ratings of the reinsurers to evidence the credit quality of the
50
According to paragraph 22 of SSAP No. 62R, Property and Casualty Reinsurance, “Prospective reinsurance is
defined as reinsurance in which a reinsurer agrees to reimburse a ceding entity for losses that may be incurred as a
result of future insurable events covered under contracts subject to the reinsurance.”
51
2018 NAIC Annual Statement Instructions Property/Casualty, page 13.

FINANCIAL REPORTING THROUGH THE LENS OF A PROPERTY/CASUALTY ACTUARY
Part III. SAP in the U.S.: Fundamental Aspects of the Annual Statement
111
reinsurer and assess the risk that the ceding company would not able to collect the
balances due from that reinsurer.
Schedule F, Part 3 also provides the aging of ceded reinsurance. An assessment can
be made of the company’s exposure to collectability issues in light of the reinsurer’s
payment history and the amount of collateral the company holds in support of its
reinsured balances.
• The Statement of Actuarial Opinion also requires the Appointed Actuary to comment
on and disclose the amount of net reserves for the insurance company’s participation
in underwriting pools and associations. Schedule F, Part 1 provides a source for this
information. In fact, regulators expect there to be a reconciliation of the amount
disclosed in the Statement of Actuarial Opinion to Schedule F.
52
Schedule F also provides the derivation of the provision for reinsurance, which is included as a
liability on the statutory balance sheet (page 3, line 16 of the 2018 Annual Statement). While
Statutory Accounting Principles (SAP) requires insurance companies to record loss and LAE
reserves net of reinsurance, SAP also presumes that a portion of that reinsurance is not
collectible. The provision for reinsurance provides “a minimum reserve for uncollectible
reinsurance with an additional reserve required if an entity’s experience indicates that a
higher amount should be provided. The minimum reserve Provision for Reinsurance is
recorded as a liability, and the change between years is recorded as a gain or loss directly to
unassigned funds (surplus). Any reserve over the minimum amount shall be recorded on the
statement of income by reversing the accounts previously utilized to establish the
reinsurance recoverable.”
53
This minimum reserve is computed in Schedule F, Part 3. It reflects the conservative nature of
statutory accounting since the entire provision may ultimately be collected.
Schedule F – Part 3 also provides the data used in the calculation of the credit risk charge for
reinsurance recoverables required by the NAIC Risk-Based Capital (RBC) formula.
Finally, Schedule F also provides a view of the reporting entity’s balance sheet on a gross of
reinsurance basis. Ceded reinsurance is a valuable means for insurance companies to mitigate
insurance risk. Schedule F, Part 6 enables the user to observe the amount of protection
afforded to the company’s balance sheet through the use of reinsurance.
52
American Academy of Actuaries Committee on Property and Liability Financial Reporting, “Statements of
Actuarial Opinion on Property and casualty Loss Reserves 2012,” Appendix 9a, “Regulatory Guidance On Property
and Casualty Statutory Statements of Actuarial Opinion for the Year 2012 Prepared by the NAIC’s Casualty
Actuarial and Statistical (C) Task Force,” page 99.
53
SSAP No. 62R, paragraph 64.

FINANCIAL REPORTING THROUGH THE LENS OF A PROPERTY/CASUALTY ACTUARY
Part III. SAP in the U.S.: Fundamental Aspects of the Annual Statement
112
Note that retroactive reinsurance does not flow through Schedule F.
54
Ceding companies
record loss and LAE reserves gross of retroactive reinsurance and assuming companies
exclude the retroactive reinsurance from loss and LAE reserves. The same is true for
Schedule P
55
; retroactive reinsurance does not flow through Schedule P.
STRUCTURAL ORGANIZATION OF SCHEDULE F
Schedule F is arranged in the following six parts:
Part 1 Assumed Reinsurance as of December 31, Current Year ($000 Omitted)
Part 2 Premium Portfolio Reinsurance Effected or (Canceled) during Current Year
Part 3 Ceded Reinsurance as of December 31, Current Year ($000 Omitted)
Part 4 Issuing or Confirming Banks for Letters of Credit from Schedule F, Part 3
($000 Omitted)
Part 5 Interrogatories for Schedule F, Part 3 ($000 Omitted)
Part 6 Restatement of Balance Sheet to Identify Net Credit for Reinsurance
Parts 1 and 3 provide details underlying the reinsurance items on a company’s balance sheet.
One asset item and four liability items on an insurance company’s balance sheet come directly
from Schedule F.
The asset item is “amounts recoverable from reinsurers” (Assets, page 2, line 16.1). It
includes amounts the insurance company has already paid in loss and LAE to its claimants
that are recoverable from its reinsurers. The first of the liability items provide this balance
from the reinsurer’s (i.e., the company in this case, as an assumed reinsurer) perspective
(Liabilities, Surplus and Other Funds, page 3, line 2).
The other three liability items that come directly from Schedule F include ceded reinsurance
premiums payable, net of ceding commissions, (Liabilities, Surplus and Other Funds, page 3,
line 12), funds held by the company under reinsurance treaties (Liabilities, Surplus and Other
Funds, page 3, line 13), and the provision for reinsurance (Liabilities, Surplus and Other
Funds, page 3, line 16). In addition, the parenthetical reference to unearned premiums for
ceded reinsurance in line 9 of page 3 also comes from Schedule F, Part 3 (column 13, total).
54
According to paragraph 22 of SSAP No. 62R, “Retroactive reinsurance is defined as reinsurance in which a
reinsurer agrees to reimburse a ceding entity for liabilities incurred as a result of past insurable events covered
under contracts subject to the reinsurance.” Note that there are exceptions for property/casualty run-off
agreements whereby the entire risk for a line of business or segment (e.g., asbestos liabilities) is retroactively
transferred by a ceding company to a reinsurer. We will not get into the specifics in this publication, but note that
the accounting for this type of contract can be found in paragraphs 81-84 of SSAP No. 62R.
55
SSAP No. 62R, paragraph 29.

FINANCIAL REPORTING THROUGH THE LENS OF A PROPERTY/CASUALTY ACTUARY
Part III. SAP in the U.S.: Fundamental Aspects of the Annual Statement
113
Schedule F, Part 3 is used to derive the provision for reinsurance. Effective with the 2018
Annual Statement, numerous individual parts used to derive the provision for reinsurance
were consolidated into a single new Part 3 within Schedule F. This “eliminates duplication,
promotes consistency of the reported ceded transactions, provides for greater automation,
and reduces filing errors.”
56
The following illustrates how the amounts in the balance sheet map to those in Schedule F
using the 2018 Annual Statement for Fictitious Insurance Company
57
:
TABLE 21
Company:
Fictitious Insurance Company
Annual Statement for the year: 2018
Assets, page 2
Schedule F Source
Line
Item
Current Year
Part
Column
Item
Row
Amount
16.1
Amounts recoverable from
reinsurers
426,000
3
7 + 8
(and 43)
Reinsurance recoverable
on paid losses and paid
LAE
Totals
426
Liabilities, Surplus and Other Funds, page 3
Schedule F Source
Line
Item
Current Year
Part
Column
Item
Row
Amount
2.
Reinsurance
payable on paid losses
and loss adjustment expenses
—
1
6
Reinsurance on paid
losses and loss
adjustment expenses
Totals
—
9.
U
nearned premiums for ceded
reinsurance (parenthetical
amount)
920,000
3
13
Reinsurance
recoverable
on unearned premium
Totals
92
0
12.
Ceded reinsurance premiums
payable (net of ceding
commissions)
440,000
3
17
Ceded reinsurance
balances payable
Totals
440
13.
Funds held by company under
reinsurance treaties
170,000
3
20
Funds held by Company
under reinsurance
treaties
Totals
170
16.
Provision for reinsurance
283,000
3
78
Provision for
reinsurance
Totals
283,000
While relevant, Parts 2 and 4 through 6 tend to get less attention by actuaries. As the name
suggests, Schedule F, Part 2 provides the user with a detailed listing of all portfolio
reinsurance transactions entered into or canceled during the current year.
56
NAIC Banks (E) Working Group, Agenda Item # 2016-35BWG MOD,
https://www.naic.org/documents/cmte_e_app_blanks_related_adopted_mods_2016-35BWG_Modified.pdf, page
57.
57
In gaining an understanding of the interplay between the Financial Statements and various Schedules within the
Annual Statement, it is important to remember that the amounts in Schedule F, Parts 1 and 3 are displayed in
thousands of U.S. dollars, whereas amounts on the balance sheet, as well as in Schedule F, Part 6, are in whole
dollars.

FINANCIAL REPORTING THROUGH THE LENS OF A PROPERTY/CASUALTY ACTUARY
Part III. SAP in the U.S.: Fundamental Aspects of the Annual Statement
114
Schedule F, Part 4 provides a listing of issuing or conforming banks for letters of credit as
collateral reported in Schedule F, Part 3, column 22.
Schedule F, Part 5 provides interrogatories for Schedule F, Part 3. The interrogatories
include two tables with more detailed information. The first identifies the five largest
commission rates included in the cedant’s reinsurance treaties for those contracts where
ceded premium is in excess of $50,000
58
. The second table identifies the five largest
reinsurance recoverables reported in column 15 and associated ceded premiums, as well as
an indicator as to whether the reinsurer is affiliated with the reporting entity.
Schedule F, Part 6 provides a summarized form of the balance sheet with adjustments to
restate it on a gross of ceded reinsurance basis. The assets are adjusted to remove any
expected recoverables from the company’s reinsurer, while the liabilities are restated to
remove any anticipated recoveries or payables.
Given the limited level of focus on Parts 2 and 4 through 6 by property/casualty actuaries, we
will provide only a brief description of their contents and use. We will devote the majority of
this chapter on the contents of the other parts of Schedule F, including the calculation of the
provision for reinsurance in Part 3.
SCHEDULE F — PART 1: ASSUMED REINSURANCE AS OF DECEMBER 31, CURRENT YEAR
($000 OMITTED)
Overview
Part 1 provides the total amount of the insurance company’s assumed reinsurance balances
by reinsured. It enables the user to obtain an additional understanding of the amounts at
stake and risks associated with an insurance company’s assumed reinsurance transactions as
of the current year.
With Part 1, each reinsured is separated into the following groups or categories, with
subtotals at the end of each category and group:
• Affiliated Insurers:
• U.S. Intercompany Pooling
• U.S. Non-Pool - Captive
• U.S. Non-Pool - Other
• Other (Non-U.S.) – Captive
• Other (Non-U.S.) – Other
• Other U.S. Unaffiliated Insurers
• Pools and Associations:
• Mandatory Pools, Associations or Other Similar Facilities
58
According to the NAIC Annual Statement Instructions, the five largest should exclude mandatory pools and joint
underwriting associations.

FINANCIAL REPORTING THROUGH THE LENS OF A PROPERTY/CASUALTY ACTUARY
Part III. SAP in the U.S.: Fundamental Aspects of the Annual Statement
115
• Voluntary Pools, Associations or Other Similar Facilities
• Other Non-U.S. Insurers
Knowledge of the group or category the reinsured is in, as well as the name of the reinsured,
provides the user of the Annual Statement with further insight as to the risk associated with
the assumed transaction.
59
For example, the reporting entity may have less control over and
knowledge of the risks assumed from an unaffiliated non-U.S. insurer than it would of risks
assumed from a U.S. affiliate.
In terms of its structure, the first four columns of Part 1 provide the ID number, NAIC
company code, name of the reinsured and the reinsured’s domiciliary jurisdiction. The ID
number is one of the following, as appropriate:
· Federal Employer Identification Number (FEIN)
· Alien Insurer Identification Number (AIIN)
· Certified Reinsurer Identification Number (CRIN)
· Pool/Association Identification Number
The remaining 11 columns provide the dollar amounts pertaining to the assumed reinsurance
transactions, including premiums, loss and LAE liabilities, contingent commissions, and the
type of collateral required by the ceding company to secure balances owed to it by the
reporting entity.
Premiums
The amount of written premium assumed by the insurance company from the reinsurer during
the year is shown in column 5. The totals in column 5 ($000 omitted) will reconcile to the sum
of the totals in columns 2 (reinsurance assumed from affiliates) and 3 (reinsurance assumed
from non-affiliates) in Part 1B of the Underwriting and Investment Exhibit (shown in whole
dollars).
Assumed premiums receivable, less commissions payable, are shown in column 10. The
amount of commissions payable does not include contingent commissions, which are shown in
column 9 and discussed below. The amount considered in column 10 is for fixed commissions.
For example, if the reporting entity wrote a reinsurance contract for premium of $500,000
with a fixed ceding commission of 25%, all of which was unpaid at the end of the year, the
figure in column 10 would be the $500,000 of assumed premium receivable less $125,000 of
commissions payable, for a total of $375,000.
59
Reinsurance assumed from pools and associations is generally reported by the name of the pool or association.
As a result, it is difficult to gain insight about the underlying risks of the pool(s) and/or association(s) that the
insurer participates in from Schedule F alone.

FINANCIAL REPORTING THROUGH THE LENS OF A PROPERTY/CASUALTY ACTUARY
Part III. SAP in the U.S.: Fundamental Aspects of the Annual Statement
116
The total in column 10 ($000 omitted) is included as a part of agent’s balances in line 15
(premiums and considerations) of page 2. As we will see later, this is considered in the profit
calculation in the IEE.
Unearned premium on assumed business is provided in column 11. This is a liability to the
insurance company and is included within line 9 of page 3, entitled unearned premiums, as
well as the unearned premium reserves contained in Parts 1 and 1A of the Underwriting and
Investment Exhibit. The unearned premium reserves on page 3 and in the Underwriting and
Investment Exhibit are net of reinsurance. As such, the assumed unearned premium reserves
listed in column 11 of Schedule F, Part 1 make up only one piece of these net amounts.
The amount in column 11 ($000 omitted) should reconcile directly to item (1) within the
“Reinsurance” note of the “Notes to Financial Statements” titled “Reinsurance Assumed and
Ceded” (shown in whole dollars; Notes 23C of Fictitious’ 2018 Annual Statement).
Loss and LAE liabilities
Known liabilities owed by the reporting entity (i.e., the insurance company) to the reinsured
(i.e., ceding company) as of December 31 of the current year are displayed in columns 6 and
7, with column 8 being the sum of the two.
• Column 6 (reinsurance recoverable on paid losses and LAE) represents losses and LAE
that the ceding company has already paid but for which the insurance company has
yet to pay to the reinsured.
• Column 7 (reinsurance recoverable on known case losses and LAE) represents the
amount of losses and LAE reported by the ceding company as case reserves for which
the reporting entity has included in its direct plus assumed case reserves stated on
Schedule P, Part 1 and its net loss and LAE reserves stated on page 3 of the balance
sheet.
60
The above information is valuable to the actuary in assessing the reasonableness of unpaid
claims. The actuary can reconcile the case reserves relied upon in the actuarial analysis to
Schedule F, Part 3 and determine where the ceded loss reserves are coming from. However,
Part 1 does not provide assumed IBNR. While a ceding company may report IBNR figures to
its reinsurer, the reinsurer is responsible for estimating and recording assumed IBNR.
As shown in Table 21, the total in column 6 (reinsurance recoverable on paid losses and LAE;
$000 omitted) reconciles to the amount on page 3, line 2 (reinsurance payable on paid losses
and LAE, displayed in whole dollars). However, the total in column 7 ($000 omitted) does not
reconcile directly to any exhibits or schedules within the Annual Statement. Known case
reserves for losses are a part of the reported losses included in column 2 of the Underwriting
60
This is only true for those companies that do not participate in intercompany pooling. A discussion of the
treatment of intercompany pooling in Schedule P is provided in Chapter 15. Schedule P of this publication.

FINANCIAL REPORTING THROUGH THE LENS OF A PROPERTY/CASUALTY ACTUARY
Part III. SAP in the U.S.: Fundamental Aspects of the Annual Statement
117
and Investment Exhibit, Part 2A; however, LAE would need to be added to this balance to
reconcile to the amount in Schedule F, Part 1, column 7.
Contingent commissions
Column 9 provides a listing of contingent commissions payable. Reinsurers pay ceding
companies a commission for the premium income generated under the reinsurance contract.
Contingent commissions payable represent profit commissions generated from assumed
reinsurance contracts that have yet to be paid as they are “contingent” on the profitability of
the underlying reinsurance arrangement. The total amount listed in column 9 ($000 omitted)
is included within the amount on page 3, line 4, entitled Commissions payable, contingent
commissions and other similar charges. The amount in column 9 ($000 omitted) should
reconcile to item (2) within the “Reinsurance” note of the “Notes to Financial Statements”
titled “Reinsurance Assumed and Ceded” (Note 23C of the 2018 Annual Statement), which
provides the amount of additional or return commission contingent upon loss experience or
other forms of profit-sharing arrangement as a result of existing contracts (shown in whole
dollars).
Let’s go back to the example we used in our explanation of column 10 (assumed premiums
receivable), but this time, let’s assume that the 25% ceding commission is on a one-to-one
sliding scale basis instead of being fixed. The 25% ceding commission assumes a 75% loss
ratio. If the loss ratio is worse than expected and ends up being 80%, then the ceding
commission drops to 20%. If the loss ratio turns out to be better than expected and is 65%, for
example, then the ceding commission increases by 10 points to 35%.
The amount of assumed premium receivable in column 10 would be $500,000, and the
contingent commissions payable in column 9 would be $125,000, which is the amount of
expected commission at the onset of the contract. Let’s fast-forward to the end of the
following year and assume that the $500,000 in premium was paid by the ceding company
(reinsured) to the reporting entity (reinsurer), and the $125,000 in ceding commission was
paid by the reporting entity to the ceding company. However, based on actual loss experience
to date, the reporting entity now knows that the loss ratio is 65% as opposed to the 75%
originally expected. This means that the reporting entity will owe the ceding company 10
more points of commission, or $50,000. The $50,000 would be shown in column 9 as a
positive number and is a liability to the reporting entity. Of course, since the $500,000 in
premium has already been received by the reporting entity, the amount shown in column 10
would be $0.
Security
The remaining columns of Schedule F, Part 1 (columns 12 through 15) provide forms of
security that ceding companies often require of their reinsurers to avoid credit risk or an
insolvency problem with the reinsurer.

FINANCIAL REPORTING THROUGH THE LENS OF A PROPERTY/CASUALTY ACTUARY
Part III. SAP in the U.S.: Fundamental Aspects of the Annual Statement
118
Funds held
Funds held by or deposited with reinsured companies (column 12) represent an asset to the
reinsurance company and a liability to the ceding company. It represents a provision within a
reinsurance contract under which a portion of the premium due to the reinsurer is withheld by
the ceding company to pay claims. There is usually a limit to the funds-held balance; however,
it is replenished as (or when) it is absorbed.
Not only do the funds held reduce credit risk, but they also serve to reduce the administrative
burden of the reinsured having to go to the reinsurance company to collect each time it
makes a loss payment. This provision is often beneficial to the reinsurer as the funds withheld
are credited for interest, the rate of which is determined in the contract. Given the benefit,
this is one provision that is considered in the evaluation of whether a reinsurance contract
transfers underwriting risk.
Letters of credit
The dollar amount underlying any letters of credit that the reporting entity is required to post
to benefit the reinsured is shown in column 13. Letters of credit are issued by a bank in favor
of the reinsured in the event that the reinsurer is unable to meet its obligations. Reinsureds
tend to favor this form of credit because it is not part of the estate of an insolvent reinsurer
and therefore not tied up or subject to degradation in bankruptcy or liquidation proceedings.
However, letters of credit can be very costly to the reinsurer. First, banks charge the
reinsurer a fee, and this fee can be very high in uncertain economic times, as experienced
during 2008 and several years thereafter. Second, letters of credit serve as a reduction to
the reinsurer’s line of credit with a bank and therefore reduce the amount of collateralization
available on its debt obligations.
Amount of assets pledged or collateral held in trust
Broadly speaking, these are amounts not otherwise included within the funds-held provision.
Unlike the other two types of security (funds held and letters of credit), these assets or
collateral amounts are under the control of the reinsurer.
As we will see in Schedule F, Part 3, the funds-held provision and letters of credit serve to
reduce a ceding company’s provision for reinsurance.
Schedule F — Part 1 for Fictitious Insurance Company
Because Fictitious Insurance Company does not have any assumed reinsurance, these
balances are $0 within Fictitious’ 2018 Annual Statement. However, a reconciliation of these
balances could be made within the Annual Statement for another company on the Exam 6
U.S. Syllabus.

FINANCIAL REPORTING THROUGH THE LENS OF A PROPERTY/CASUALTY ACTUARY
Part III. SAP in the U.S.: Fundamental Aspects of the Annual Statement
119
SCHEDULE F — PART 2: PREMIUM PORTFOLIO REINSURANCE EFFECTED OR (CANCELED)
DURING CURRENT YEAR
Overview
Part 2 provides a detailed listing of portfolio reinsurance transactions effected or canceled
during the current year. Portfolio reinsurance is the transfer of policies in force or liabilities
remaining on a block of the insurance company’s business. Companies tend to enter into
these arrangements when they:
• Want to discontinue writing a certain business
• Would like to get the risk or uncertainty associated with the liabilities off of their
books
• Need surplus relief, which can come in the form of the discounted premium
However, these transactions come at a price, as the reinsurer will require a risk premium; the
benefit of these contracts must be weighed with the cost.
Schedule F – Part 2 for Fictitious Insurance Company
Fictitious Insurance Company neither effected nor canceled any portfolio reinsurance during
2018.
SCHEDULE F — PART 3: CEDED REINSURANCE AS OF DECEMBER 31, CURRENT YEAR ($000
OMITTED)
Overview
Part 3 is one of the most referenced parts within Schedule F. Part 3 provides a
comprehensive listing of the company’s ceded reinsurance balances by reinsurer. It shows the
dollar amounts relating to ceded reinsurance contracts, which enable the user to identify
amounts recoverable from each of the company’s reinsurers and assess credit risk.
Each reinsurer in Part 3 is separated into the same groups and categories as Part 1, with the
addition of protected cells.
61
However, these groups and categories are provided separately
for authorized reinsurers, unauthorized reinsurers and certified reinsurers,
62
with subtotals
61
A protected cell company is one that is organized for the creation of separate cells, each having its own assets
and liabilities, but also having access to a part of the company’s overall capital. The liability to each cell is limited
such that creditors to one cell cannot look to another cell or the company as a whole for assets. Only certain
jurisdictions currently have insurance legislation pertaining to protected cell companies.
62
An authorized reinsurer is one that is licensed or approved to transact insurance business in a jurisdiction; an
unauthorized reinsurer is not. A certified reinsurer is an assuming insurer that has been certified as a reinsurer in
the domiciliary state of the ceding insurer and secures its obligations in accordance with the requirements of
Appendix A-785, Credit for Reinsurance, of the NAIC Accounting Practices and Procedures Manual.

FINANCIAL REPORTING THROUGH THE LENS OF A PROPERTY/CASUALTY ACTUARY
Part III. SAP in the U.S.: Fundamental Aspects of the Annual Statement
120
for each. As we shall see, the categorization of authorized, unauthorized and certified is used
in the calculation of the provision for reinsurance, which culminates in column 78.
Schedule F, Part 3, is separated into 5 “sections”:
Ø The first 20 columns detail the ceded reinsurance balances
Ø Columns 21 through 36 calculate credit risk on ceded reinsurance
Ø Columns 37 through 53 provide the aging of ceded reinsurance
Ø Columns 54 through 69 provide the calculation of the Provision for Reinsurance for
Certified Reinsurance
Ø Columns 70 through 78 provide the Total Provision for Reinsurance (authorized,
unauthorized and total)
Ceded Reinsurance Balances (the first 20 columns of Part 3)
Similar to Part 1, Part 3 starts off with a listing of the ID Number, NAIC Company Code, name
of each of the Company’s reinsurers (reinsured in Part 1), and the domiciliary jurisdiction of
each reinsurer (reinsured in Part 1).
Special Code
Column 5 of Schedule F, Part 3, is used to identify reinsurance relationships of heightened
importance to regulators or those where special considerations are made in the calculation of
the provision for unauthorized reinsurance. A specifically defined number code is indicated in
the applicable row for situations outlined below.
Special Code “2” - Cessions of 75% or more of subject premium
By definition, an insurance company is a risk-bearing entity. When an insurance
company decides to cede most, if not all, of the risk under a contract, regulators need
to understand why an insurer writes business and then cedes a large portion of it to
another insurer. Column 5 identifies, through an indicator of the number 2 in the
relevant row, each individual reinsurance contract whereby 75% or more of the subject
direct written premiums are ceded. The purpose of column 5 is to identify situations
where the reporting entity may be acting as a fronting carrier for another company
(the reinsurer) in a particular state where the reinsurer is not licensed to transact
business. Regulatory concern is that the reinsurer is using the fronting company to
avoid regulatory oversight.
We often see this in the case of workers’ compensation insurance due to the strict
licensing requirements. For example, Insurer A may wish to write workers’
compensation for a retail organization with locations along the west coast of the U.S.
However, Insurer A may not be licensed to write workers’ compensation insurance in
California. Insurer A may turn to Insurer B, which is licensed in California, to write the

FINANCIAL REPORTING THROUGH THE LENS OF A PROPERTY/CASUALTY ACTUARY
Part III. SAP in the U.S.: Fundamental Aspects of the Annual Statement
121
policy on Insurer A’s behalf. In turn, Insurer B would cede 100% of the exposure to
Insurer A. Insurer B would require a fronting fee to provide this service to Insurer A.
Certain reinsurance transactions are exempt from this requirement, as they are not
fronting arrangements and their purpose is not to avoid regulatory oversight. These
transactions include:
• Intercompany cessions with affiliates, as these are used to share risks across
related companies
• Cessions to a group, association, pool or organization of insurers that
underwrite jointly and are subject to examination by any state regulatory
authority or that operate pursuant to any state or federal statutory or
administrative authorization, such as a workers’ compensation or auto
assigned risk pool
• Those where the gross annual premium ceded is less than 5% of policyholder
surplus, as these transactions are deemed immaterial and may represent
situations where an insurance company is exiting a line of business as opposed
to a fronting arrangement
• Cessions to captive insurance companies, which are regulated in their
domiciliary state (captive insurance companies are used by parent companies
(non-insurance) to keep commercial insurance costs down)
Special Code “3” – Counterparty Reporting Exception for Asbestos and Pollution
Contracts under SSAP No. 62R – Property Casualty Reinsurance
Special Code “3” identifies those reinsurers that have been aggregated into one line in
Schedule F in accordance with the counterparty reporting exception for asbestos and
pollution contracts under SSAP No. 62R paragraphs 66 through 68. This exception
allows the Provision for Reinsurance to be reduced by reflecting that amounts have
been recovered by the reporting entity under duplicate coverage provided by the
retroactive contract, and that inuring balances from the original contract(s) are
payable by the retroactive counterparty, if applicable. In order for this exception to be
employed, the agreement must comply with paragraphs 66.a. through 66.e. and the
reporting entity must obtain prior approval by its domiciliary regulator.
If this exception is employed, the reporting entity must complete the Supplemental
Schedule for Reinsurance Counterparty Reporting Exception – Asbestos and Pollution
Contracts.
Note that this exception only applies to the calculation of the Provision for
Reinsurance and how these contracts are presented in Schedule F. It does not change
the treatment of retroactive reinsurance accounting.

FINANCIAL REPORTING THROUGH THE LENS OF A PROPERTY/CASUALTY ACTUARY
Part III. SAP in the U.S.: Fundamental Aspects of the Annual Statement
122
Special Code “4” – Incurred but not Reported Losses on Contracts in Force Prior to
July 1, 1984 that are Exempt from the Statutory Provision for Unauthorized
Reinsurance
IBNR losses on contracts in force prior to July 1, 1984 and not subsequently renewed
are exempt from the statutory provision for unauthorized reinsurance. These
contracts are identified by a 4 in this column with details of amounts provided in Part
2, Question 17, of the General Interrogatories to enable the reader to assess
significance.
Many of the columns in the first section (the first 20 columns) of Schedule F, Part 3, are
mirror images (albeit with different column numbers) to the corresponding contents of Part 1
for assumed reinsurance and pertain to premiums ceded, reinsurance recoverable,
reinsurance payable and funds held by the reporting entity. In our discussion of the remaining
columns of Part 3, we provide parenthetical references to amounts in Schedule F of Fictitious
Insurance Company’s 2018 Annual Statement where applicable.
Premiums ceded
The amount of written premium that is ceded to each of the company’s reinsurers during the
year is shown in column 6. The total amount in column 6 ($1,882; $000 omitted) should
reconcile to the total of columns 4 plus 5 in Part 1B of the Underwriting and Investment
Exhibit (shown in whole dollars).
Reinsurance recoverable
Columns 7 and 8 provide recoverables on paid losses and LAE ($426; $000 omitted). These
are booked as an asset on the insurance company’s balance sheet ($426,000 on page 2, line
16.1) because the company is awaiting receipt of a recovery from its reinsurer on payments
that the insurance company already made to the claimant.
Columns 9 through 12 provide recoverable on unpaid loss and LAE. The totals of column 9
($5,343; $000 omitted) will reconcile to the Underwriting and Investment, Part 2A, column 3
(shown in whole dollars). The totals of column 11 ($4,038; $000 omitted) will reconcile to the
Underwriting and Investment, Part 2A, column 7 (shown in whole dollars).
For companies that do not participate in intercompany pooling, Schedule F, Part 3, columns 9
through 12 are equal to the amount of ceded reserves that are netted against the gross loss
and LAE reserves, which result in the net loss and loss adjustment expense reserves shown on
page 3 of the balance sheet in rows 1 plus 3. Columns 9 through 12 should also reconcile to
the sum of the totals in columns 14, 16, 18, 20 and 22 of Schedule P, Part 1 – Summary as
follows:

FINANCIAL REPORTING THROUGH THE LENS OF A PROPERTY/CASUALTY ACTUARY
Part III. SAP in the U.S.: Fundamental Aspects of the Annual Statement
123
• The totals in Schedule F, Part 3, columns 9 and 11 ($5,343 and $4,038) should
reconcile directly to the total amounts in Schedule P, Part 1, columns 14 and 16
($5,343 and $4,038), respectively.
63
• Similarly, Schedule F, Part 3, column 10 ($258) should reconcile to Schedule P – Part
1, column 18 ($258), since the NAIC Annual Statement Instructions require column 10
of Schedule F, Part 3 to exclude Adjusting and Other expenses.
• The total in Schedule F, Part 3, column 12 ($503) should reconcile to the sum of the
totals in columns 20 and 22 of Schedule P, Part 1 ($503).
64
Even if the company does participate in intercompany pooling, the recoverables on known
case and IBNR loss reserves should match columns 3 (reported losses recoverable from
authorized, unauthorized and certified reinsurers) and 7 (IBNR losses on reinsurance ceded)
of the Underwriting and investment Exhibit Part 2A.
Note that Part 3 provides IBNR reserves, as these are amounts determined and recorded by
the reporting entity. Recall that Part 1 does not provide IBNR. Part 1 provides case reserve
amounts reported by the assuming company from the ceding company. While the ceding
company may report IBNR to the assuming company, it is the assuming company’s
responsibility to book what it believes to be its best estimate.
Column 13 represents the amount of unearned premium that will be ceded to an insurance
company’s reinsurers ($920; $000 omitted). This should equal to the parenthetical amount
on page 3, line 9 of the balance sheet ($920,000), which provides the reduction to gross
unearned premium for the amount ceded. This is a contra liability to the ceding company. It
should also reconcile directly to the amount in item (1) within the “Reinsurance” note of the
Notes to Financial Statements titled “Reinsurance Assumed and Ceded” (shown in whole
dollars; Note 23C of the 2018 Annual Statement).
Column 14 is similar to Schedule F, Part 1, column 9 (contingent commissions payable), but
column 14 is from the view point of the reporting entity as a ceding company (reinsured) as
opposed to the reporting entity as the reinsurer. Schedule F, Part 3, column 14 represents
the amount of contingent commissions receivable from the reporting entity’s reinsurers. The
amount in column 14 ($11; $000 omitted) should reconcile to item (2) within the
“Reinsurance” note of the Notes to Financial Statements titled “Reinsurance Assumed and
Ceded” (shown in whole dollars; Note 23C of the 2018 Annual Statement), which provides the
amount of additional or return commission contingent upon loss experience or other forms of
profit-sharing arrangement under the reporting entity’s existing reinsurance contracts. In the
case of Fictitious, this amount is positive, which means that Fictitious expects to receive
63
Any differences are due to rounding within the Annual Statement for Fictitious Insurance Company.
64
ibid.

FINANCIAL REPORTING THROUGH THE LENS OF A PROPERTY/CASUALTY ACTUARY
Part III. SAP in the U.S.: Fundamental Aspects of the Annual Statement
124
additional commission from the companies it cedes business to (specifically Good Reinsurer
and Slightly Overdue Reinsurer) as a result of favorable loss experience. However, the
amount can also be negative, which would mean that the reinsurer’s experience has been
worse than anticipated under the contract and the reporting entity is expected to return some
of the commission already received.
Column 15 provides a sum of reinsurance recoverables, whether on paid (an asset) or unpaid
losses (a reduction to liabilities), a reduction to unearned premiums, or contingent
commissions receivable. Column 16 identifies amounts in dispute that are included in column
15. Amounts in dispute are those for which the reinsurer has disputed amounts due through
formal written notification, arbitration or litigation.
Reinsurance payable
Columns 17 and 18 provide other amounts payable by the insurance company to the
reinsurer. All other commissions receivable that are not included in column 14 are netted with
ceded balances payable in column 17. Column 17 ($440; $000 omitted) should reconcile to
page 3, line 12, “Ceded reinsurance premiums payable (net of ceding commissions)
($440,000). Amounts in column 18 ($0) represent miscellaneous liabilities owed to the
reinsurer under the ceded contracts, excluding funds held by the company under the terms of
the contracts with its reinsurers. Funds held are provided for separately in column 20.
Column 19 ($11,061; $000 omitted) represents the net amount recoverable from reinsurers
and is equal to column 15 reduced by columns 17 and 18.
Funds held
Column 20 provides the liability for funds held by company under reinsurance treaties ($170;
$000 omitted) and reconciles to page 3, line 13 ($170,000). This provision is the mirror
image of that reported by the reinsurer in a transaction, as described in Part 1. It is used by
the reporting entity to protect balances due from the reinsurer under the terms of the
reinsurance contract. As we will see in the remainder of Schedule F, Part 3, the liability for
funds held enables the insurance company to mitigate its liability for unauthorized, certified
and overdue authorized reinsurance.
Credit Risk on Ceded Reinsurance (columns 21 through 36)
This section of Part 3 is new in 2018. The information reported in this section is not only used
in the calculation of the provision for reinsurance, but it is also used in the calculation of the
credit risk charge for reinsurance recoverables for RBC purposes. The calculation is
performed on reinsurance balances receivable on reinsurance ceded to non-affiliated
companies. Cessions to state mandated residual market mechanisms, the National Council on
Compensation Insurance, Federal Insurance Programs (e.g., National Flood Insurance
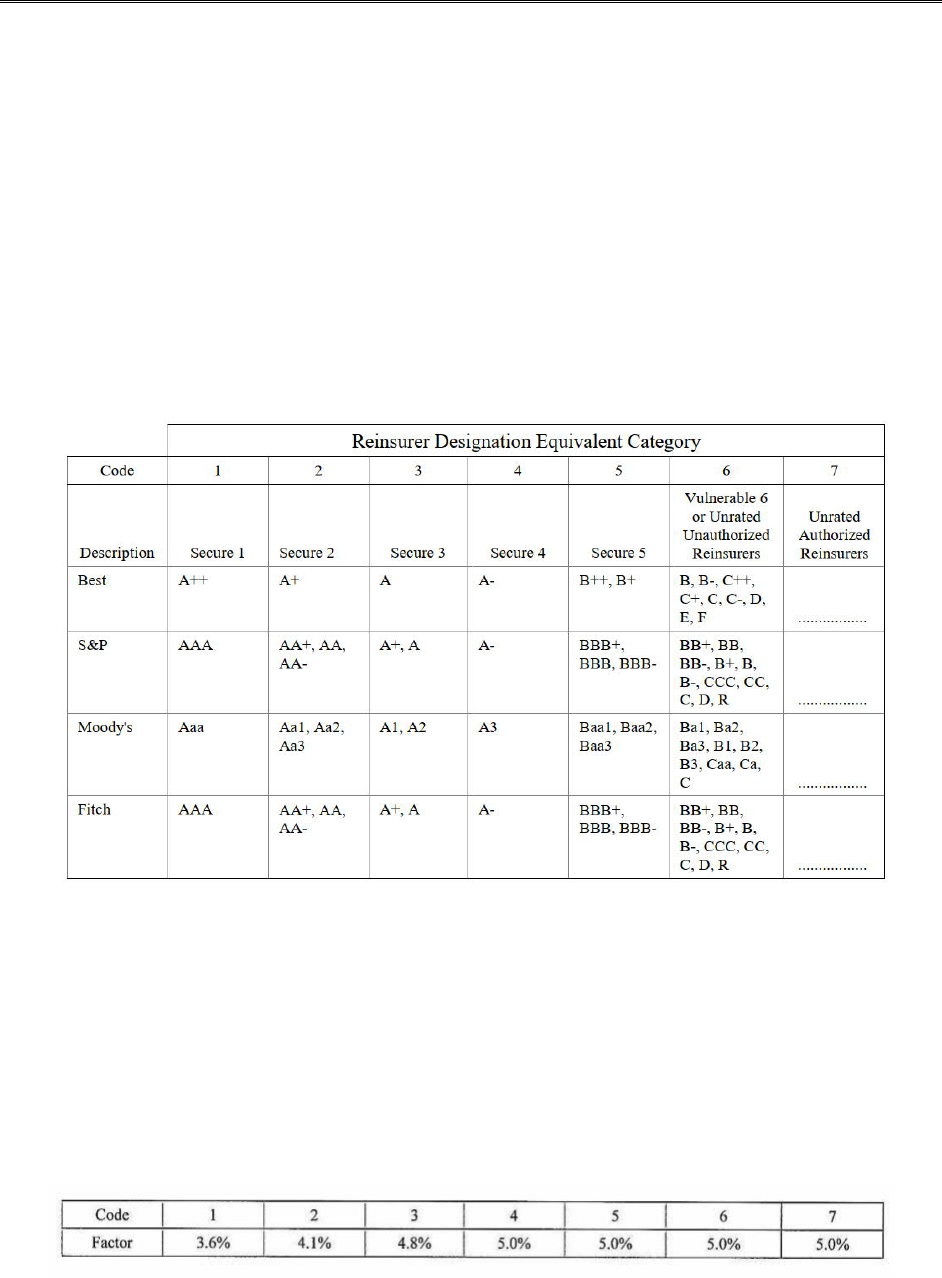
FINANCIAL REPORTING THROUGH THE LENS OF A PROPERTY/CASUALTY ACTUARY
Part III. SAP in the U.S.: Fundamental Aspects of the Annual Statement
125
Program), and U.S. parents, subsidiaries and affiliates are exempt from this charge and
therefore excluded from the calculation.
The amount of the credit risk charge is dependent upon whether the reinsurance recoverables
are collateralized or not and the financial strength of the reinsurers. Therefore, the credit
risk charge is calculated separately for collateralized and uncollateralized recoverables in
columns 35 and 36, respectively.
The financial strength of the reinsurers is determined based on the current rating received
from an approved rating agency as outlined in the table below taken from the 2018 NAIC
Annual Statement Instructions.
TABLE 22
Table 22 provides a mapping of the current financial strength rating to an equivalent
designation category used for purposes of applying the applicable credit risk-based capital
charge for collateralized and uncollateralized recoverables as provided in Tables 23 and 24
below from the 2018 Annual Statement Instructions. The equivalent designation category is
provided in column 34 of Part 3 (Reinsurance Designation Equivalent).
TABLE 23
Credit Risk Charge on Collateralized Recoverables

FINANCIAL REPORTING THROUGH THE LENS OF A PROPERTY/CASUALTY ACTUARY
Part III. SAP in the U.S.: Fundamental Aspects of the Annual Statement
126
TABLE 24
Credit Risk Charge on Uncollateralized Recoverables
The calculation of credit risk for RBC purposes is offset by the liability that has been
established for purposes of the reinsurance penalty (Provision for Reinsurance) in the Annual
Statement (Page 3, Line 16). Therefore, before application of the credit risk charge, the
reinsurance recoverables in column 15 are reduced by the Schedule F penalty provided in
column 27 (equal to the Provision for Reinsurance in column 78) to produce column 28, the
total amount recoverable from reinsurers less any applicable reinsurance penalty. Column 28
is multiplied by 120% to stress the recoverable in column 29. The total of reinsurance
payable and funds held (total of columns 17 plus 18 plus 20, but not in excess of the stressed
recoverable in column 29) are applied as offsets to arrive at the stressed net recoverable in
column 31. Based on the Reinsurer Designation Equivalent in column 34, the credit risk
charge on uncollateralized recoverables (provided in Table 24) is applied to the stressed net
recoverable net of collateral offsets provided in column 33 to arrive at the credit risk on
uncollateralized recoverables in column 36. Credit risk on collateralized recoverables in
column 35 is determined by applying the credit risk charge on collateralized recoverables
(provided in Table 23) to total collateral in column 32 (columns 21 plus 22 plus 24, not in
excess of the stressed net recoverable in column 31).
Note for purposes of calculating the reinsurance credit risk charge, reinsurance recoverables
are reduced by IBNR for reinsurers with Special Code “4” indicated in column 5. Recall,
Special Code “4” designates those reinsurers with IBNR loses on contracts in force prior to
July 1, 1984 that are exempt from the Provision for Reinsurance.
Aging of Ceded Reinsurance (columns 37 through 53)
Columns 37 through 53 of Part 3 comprise the section on the “Aging of Ceded Reinsurance”
This section provides a breakdown by age of the paid loss and LAE amounts recoverable from
the insurance company’s reinsurers that are shown in columns 7 (reinsurance recoverable on
paid loss) and 8 (reinsurance recoverable on paid LAE) of Schedule F, Part 3.
Paid loss and LAE recoverables are provided in the following age categories:
• Current (column 37)
• 1 to 29 days (column 38)
• 30 to 90 days (column 39)
• 91 to 120 days (column 40)
• Over 120 days (column 41)

FINANCIAL REPORTING THROUGH THE LENS OF A PROPERTY/CASUALTY ACTUARY
Part III. SAP in the U.S.: Fundamental Aspects of the Annual Statement
127
The total amount of paid loss and LAE recoverable that is overdue (columns 38 through 41) is
provided in column 42. The total amount of paid loss and LAE recoverable that is due (current
in column 37 plus overdue in column 42) is provided in column 43. The amount in column 43
($426 in total; $000 omitted) reconciles to the amount in column 7 (recoverable on paid loss)
plus column 8 (recoverable on paid LAE) in Schedule F, Part 3 ($426 + $0 = $426 in total;
$000 omitted) and Page 2, line 16.1 (amounts recoverable from reinsurers; $426,000) of the
Annual Statement. As stated previously, paid loss and LAE recoverables are assets of the
reporting entity.
According to the NAIC Annual Statement Instructions, the age of the recoverable is based on
the following:
• The terms of the reinsurance contract as to when claims are to be paid by the
reinsurer, if specified
• The terms of the reinsurance contract as to when claims are to be reported by the
insurance company to the reinsurer, if specified
Or
• The date when the amount recoverable exceeds $50,000 for a particular reinsurer
and is entered in the insurance company’s financial accounts as a paid recoverable
If the amount recoverable is less than $50,000, and the aforementioned paid/reported dates
are not specified in the contract, then the recoverable is reported in column 37 as currently
due.
Note that recoverables from mandatory pools and associations are reported in column 37 as
currently due.
Columns 49 through 50 provide percentages of the overdue balances to total amounts due.
Column 49 provides the percentage overdue relative to the total due (column 42 divided by
column 43), column 50 provides the percentage overdue greater than 90 days and not in
dispute (column 47 divided by columns 46 plus 48), and column 51 provides the percentage
overdue greater than 120 days to the total due (column 41 divided by column 43). These
percentages are used in the calculation of the provision for reinsurance.
Provision for Reinsurance for Certified Reinsurance (columns 54 through 69)
In 2012, the NAIC added a third facet to the “authorized” and “unauthorized” categorization
of reinsurers in Schedule F, called “certified.” This resulted in the addition of a new Part 6 to
Schedule F, shifting the former Parts 6 through 8 to Parts 7 through 9, respectively. In 2018,
numerous individual parts used to derive the provision for reinsurance were consolidated into
a single new Part 3 within Schedule F, with columns 54 through 69 being specific to certified
reinsurers.

FINANCIAL REPORTING THROUGH THE LENS OF A PROPERTY/CASUALTY ACTUARY
Part III. SAP in the U.S.: Fundamental Aspects of the Annual Statement
128
Certified reinsurers are non-U.S. reinsurers domiciled in a jurisdiction designated by the NAIC
as a Qualified Jurisdiction (i.e., Bermuda, France, Germany, Ireland, Japan, Switzerland and
the United Kingdom) that would have been categorized as unauthorized prior to 2012, but
have applied for and attained certification from the reporting entity’s domiciliary state as a
certified reinsurer. A non-U.S. reinsurer that is not certified is required to post 100%
collateral for its U.S. claims. Once a reinsurer is certified, it is allowed to provide a reduce
amount of collateral for its U.S. claims. In attaining certification, consideration is made for
the reinsurer’s jurisdiction, financial position, amount of capital and surplus, regulatory
history, financial strength rating(s) from
65
recognized rating agency(ies), among other
factors. Once certified, the reinsurer is given a rating that ranges from 1 to 6, called the
Certified Reinsurer Rating. A reinsurer with a rating of 1 is considered most secure from a
financial strength perspective; a reinsurer with a rating of 6 is considered vulnerable.
The rating defines the amount of collateral that the reinsurer is required to post with the
reporting entity. The more secure the certified reinsurer, the less collateral required. For
example, a reinsurer with a rating of 1 is not required to post any collateral; a reinsurer with a
rating of 6 is required to post 100% of total recoverable due to the reporting entity in
collateral.
66
The rating and collateral are used in the calculation of the provision for
reinsurance in column 77 of Schedule F, Part 3.
The obvious benefits of this new “certified” category are twofold: (1) the reporting entity
does not get “penalized” as much as an unauthorized reinsurer in the provision for
reinsurance, and (2) the reinsurer does not have to post as much security with the ceding
company.
The provision for certified reinsurance comprises two parts, one coming from column 64 and
the other from column 69. Column 64 provides the provision for reinsurance ceded to
certified reinsurers due to collateral deficiency. This provision is equal to total recoverables
from certified reinsurers offset by any corresponding payables (from Schedule F, Part 3,
column 19) in excess of the amount of credit permitted for recoverables based on the
Certified Reinsurer Rating (column 63). The amount of credit permitted is based on the
amount of collateral actually posted by the reinsurer relative to the amount of collateral
required based on its Certified Reinsurer Rating. For example, if a certified reinsurer has a
rating of 6, then the reinsurer is required to post 100% of the recoverable in collateral.
However, if the reinsurer only posts 75% of the total collateral required, then the reporting
entity would record a provision for reinsurance in Section 1 equal to 25% of the recoverable.
65
The list can be found at this link: https://content.naic.org/sites/default/files/inline-
files/committees_e_reinsurance_qualified_jurisdictions_list_1.pdf, and the designation was initially effective on
January 1, 2015
66
A rating of Secure-2 requires 10%; Secure-3 requires 20%; Secure-4 requires 50%; and Secure-5 requires 75%.

FINANCIAL REPORTING THROUGH THE LENS OF A PROPERTY/CASUALTY ACTUARY
Part III. SAP in the U.S.: Fundamental Aspects of the Annual Statement
129
The 25% represents the deficiency in collateral; 75% represents the amount of credit
permitted.
Column 69 of Part 3 provides the provision for overdue reinsurance ceded to certified
reinsurers. As with authorized and unauthorized reinsurers, overdue reinsurance ceded is
defined as recoverable on paid losses and LAE more than 90 days overdue per columns 40
and 41.
As we will see, the provision for overdue certified reinsurers is calculated similarly to the
provision for authorized reinsurance, in that the provision is greater for slow payers (i.e.,
those certified reinsurers where the percent of recoverables on paid losses and LAE more
than 90 days overdue is 20% or more), than non-slow payers. In the case of slow payers,
instead of 20% of the recoverables on paid losses and LAE, the maximum amount of the
recoverables on paid losses and LAE and the net unsecured recoverable for which credit is
allowed is considered. In either case, the provision is not to excess the amount of credit
allowed for net recoverables per column 63.
Total Provision for Reinsurance (columns 70 through 78)
As explained in the “Overview” section of this chapter, the provision for reinsurance is a
minimum reserve that is calculated under SAP to reflect an estimate of recoveries under the
reporting entity’s reinsurance contract(s) that it will not be able to collect. The provision is
provided in column 78 and is the sum of the following three main elements:
1. Provision for authorized reinsurance in column 75, which emanates from overdue
balances.
2. Provision for unauthorized reinsurance in column 76, which comprises two
components, the sum of columns 71 and 72:
• Column 71 provides the provision due to collateral deficiency.
• Column 72 provides the provision due to overdue balances.
3. Provision for certified reinsurers in column 77, which similarly comprises two
components, the sum of columns 64 and 69:
• Column 64 provides the provision due to collateral deficiency.
• Column 69 provides the provision due to overdue balances.
For Fictitious, the components of the provision for reinsurance are as follows:

FINANCIAL REPORTING THROUGH THE LENS OF A PROPERTY/CASUALTY ACTUARY
Part III. SAP in the U.S.: Fundamental Aspects of the Annual Statement
130
TABLE 25
Column Provision for Reinsurance (USD in 000) Total
75
1.
Provision for Authorized Reinsurance
46
76
2.
Provision for Unauthorized Reinsurance
224
77
3.
Provision for Certified Reinsurance
13
78
Tota
l Provision for Reinsurance
283
Details underlying the computation of each of these three elements is provided below.
1. Provision for Amounts Ceded to Authorized Reinsurers in column 75
An authorized reinsurer is one that is either licensed or accredited in the ceding insurance
company’s state of domicile or domiciled in a state that employs standards regarding credit
for reinsurance substantially similar to those of the ceding insurance company’s state of
domicile and is therefore regulated in the U.S. and subject to minimum capital and surplus
requirements. As a result, there is less concern about the reinsurer’s ability to pay unless the
reinsurer is late in making payments or has disputed the ceded balance. Therefore, for
authorized reinsurers, the provision for reinsurance emanates from overdue balances,
including amounts in dispute.
For purposes of calculating the provision for overdue authorized reinsurance, “overdue”
reinsurance is defined as the amount of paid loss and LAE recoverable over 90 days past due
for reasons other than dispute between the insurance company and the reinsurer.
The provision for authorized reinsurance is equal to the sum of column 73 and 74. The
provision that emanates from column 73 comprises overdue authorized reinsurance that
represents less than 20% of the total recoverable on paid loss and LAE (plus amounts received
by the insurance company from that reinsurer in the prior 90 days). For these reinsurers,
most of the payments are less than three months late. This of course is not as great of a
concern from a collectability standpoint as is the situation where the majority of the amount
overdue from a reinsurer is greater than 90 days (i.e., the provision for “slow payers” derived
in column 74); the likelihood of the reinsurer reimbursing the insurance company is less as
time goes on.
The provision for overdue authorized reinsurance in column 73 is calculated as (1) 20% of the
amount of reinsurance recoverable on paid losses and LAE more than 90 days overdue, plus
(2) 20% of amounts in dispute excluded from the recoverable on paid losses and LAE more
than 90 days overdue for those authorized reinsurers where the amount overdue represents
less than 20% of the total. This is equal to 20% of the amount reported in column 47 plus 20%
of the amount reported in column 45.

FINANCIAL REPORTING THROUGH THE LENS OF A PROPERTY/CASUALTY ACTUARY
Part III. SAP in the U.S.: Fundamental Aspects of the Annual Statement
131
For Fictitious Insurance Company, “Good Reinsurer” and “Slightly Overdue Reinsurer” are the
only authorized reinsurers for which loss and LAE payments are overdue in 2018 and for
which the overdue amount represents less than 20% the total recoverable on paid, as
indicated by a “YES” in column 52.
Column 74 provides the provision for what Sholom Feldblum refers to as “slow-paying”
67
authorized reinsurers (i.e., authorized reinsurers where the amount of paid loss and LAE
recoverable more than 90 days overdue represents greater than or equal to 20% of the total
recoverable on paid losses and LAE). Column 74 is calculated as 20% of the maximum of (1)
reinsurance recoverable on all items less funds held and collateral in column 26 and (2) the
amount recoverable on paid losses and LAE greater than 90 days past due in columns 40 and
41.
Similar to column 73, the provision for overdue authorized reinsurers in column 74 considers
reinsurance recoverables on paid loss and LAE greater than 90 days overdue. However,
column 74 also considers all recoverables from the reinsurer, less allowable offsets. We note
that the reinsurance recoverables would include amounts in dispute. In column 74, the
greater of all items recoverable less offsets, and paid recoverables more than 90 days due, is
used in the calculation of the provision. In other words, slow payers are penalized in the
calculation of the provision for authorized reinsurance.
As indicated in column 52 by a “NO”, Fictitious has two slow-paying reinsurers: “Overdue
Reinsurer” and “Foreign Authorized.”
The following table details the first step in the calculation of the provision of authorized
reinsurance for Fictitious Insurance Company, the determination of whether amounts overdue
are less than 20% of total recoverables on paid losses and LAE in column 52.
67
Feldblum, S., “Reinsurance Accounting: Schedule F,” CAS Exam Study Note, April 2003, 8
th
Edition, page 22.

FINANCIAL REPORTING THROUGH THE LENS OF A PROPERTY/CASUALTY ACTUARY
Part III. SAP in the U.S.: Fundamental Aspects of the Annual Statement
132
TABLE 26
Authorized Reinsurance (USD in 000)
Do overdue amounts represent less than 20% of total recoverables on paid losses and LAE?
Column
Good
Reinsurer
Overdue
Reinsurer
Slightly
Overdue
Reinsurer
Pooling
Company
Foreign
Authorized Source
52
Do overdue amounts
represent less than
20% of total
recoverables on paid
losses and LAE (plus
amounts received in
prior 90 days)?
YES
NO
YES
YES
NO
If Column 50 is less Than
20%, then "Yes" and go to
Column 73, else "No" and
go to Column 74
50
Percentage of
Amounts More Than
90 Days Overdue
Not in Dispute
0.0%
100.0%
8.3%
0.0%
23.5%
Column 47 / [Column 46 +
48]
46
Total Recoverab
le
on Paid Losses &
LAE Amounts Not in
Dispute
258 10 60 - 34
Columns 43
-
Column 44
47
Recoverable on Paid
Losses & LAE Over
90 Days Past Due
Amounts Not in
Dispute
- 10 5 - 8
Columns 40 + 41
-
45
48
Amounts Received
Prior 90 Days - - - - -
Input by Company
Reinsurance Recoverable on Paid Losses and Paid Loss Adjustment Expenses
37
Current
248 - 54 - 26
Input by Company
38
1
-
29 days past due
10 - - - -
Input by Company
39
30
-
90 days past
due - - 5 - -
Input by Company
40
91
-
120 days past
due - - 5 - 8
Input by Company
41
Over 120 days past
due - 10 - - -
Input by Company
42
Total Overdu
e
10 10 10 - 8
Columns 38 + 39 + 40 + 41
43
Total Due
258 10 64 - 34
Columns 37 + 42; equals
Schedule F, Part 3, Columns
7 + 8
44
Total Recoverable
on Paid Losses &
LAE Amounts in
Dispute Included in
Column 43
- - 4 - -
Input by Company
45
Recoverable on Paid
Losses & LAE Over
90 Days Past Due
Amounts in Dispute
Included in Columns
40 & 41
- - - - -
Input by Company

FINANCIAL REPORTING THROUGH THE LENS OF A PROPERTY/CASUALTY ACTUARY
Part III. SAP in the U.S.: Fundamental Aspects of the Annual Statement
133
Once column 52 is determined, the calculation of the provision for reinsurance for authorized
reinsurance is separately determined for those overdue authorized reinsurers for which column
52 is a “yes” and those for which column 52 is a “no”, as displayed below for Fictitious.
2. Provision for unauthorized reinsurance in column 76
The provision for unauthorized reinsurance requires that the insurance company establish a
liability to protect against the inability to collect on amounts due from a reinsurer not
authorized or certified by the domiciliary state of the insurance company. The liability
emanates from two sources:
Column
Good
Reinsurer
Overdue
Reinsurer
Slightly
Overdue
Reinsurer
Pooling
Company
Foreign
Authorized
Source
75 Provision for Authorized Reinsurance - 43 1 - 2 Columns 73 + 74; if less than
0, enter 0
73 Provision for overdue authorized
representing less than 20% of total
recoverables on paids (plus amounts
received in prior 90 days)
- - 1 - - If Column 52 = "YES", 20% of
Column 47 + 20% of Column
45; otherwise = 0
74 Provision for "slow payers" (overdue
authorized representing greater than or
equal to 20% of total recoverables on paids
(plus amounts received in prior 90 days))
- 43 - - 2 If Column 52 = "No", Greater
of 20% of Column 26 and 20%
of [Columns 40 + 41];
otherwise = 0
26 Net Recoverable Net of Funds Held &
Collateral
4,137 217 2,779 617 - Column 15 - Column 25,
unless Column 5 = Special
Code 4, then reduce Column
15 by Columns 11 + 12 in
this calculation
15 Reinsurance Recoverable on paid, known
case and IBNR loss and LAE, unearned
premiums and contingent commissions
4,137 745 2,873 628 2,411 Coumns 7 through 14 Totals
25 Total Funds Held, Payables & Collateral - 528 94 11 2,411 Minimum of [Column 15 and
sum of Columns 17 + 18 + 20
+ 21 + 22 + 24], unless
Column 5 = Special Code 4,
then reduce Column 15 by
Columns 11 + 12 in this
calculation
17 Ceded Balances Payable - 13 94 11 255 Input by Company
18 Other Amounts Due to Reinsurers - - - - - Input by Company
20 Funds Held by Company Under
Reinsurance Treaties
- - - - - Input by Company
21 Multiple Beneficiary Trusts - - - - - Input by Company
22 Letters of Credit - 515 - - 2,500 Input by Company
24 Single Beneficiary Trusts & Other
Allowable Collateral
- - - - - Input by Company
Provision for Overdue Balances and Amounts in Dispute
Reinsurance Payable
Funds Held
Collateral
Provision for Authorized Reinsurance (USD in 000)

FINANCIAL REPORTING THROUGH THE LENS OF A PROPERTY/CASUALTY ACTUARY
Part III. SAP in the U.S.: Fundamental Aspects of the Annual Statement
134
• Collateral deficiency (column 26), which is defined as the total amount of reinsurance
recoverables, including amounts in dispute, offset by funds held, payables and
collateral (i.e., the unsecured recoverable in column 26); and
• Overdue balances (i.e., 20% of column 47) and amounts in dispute (20% of column 16)
To put it another way, the liability is equal to total recoverable from unauthorized reinsurers,
reduced for allowable offsets only to the extent that there are no amounts in dispute or more
than 90 days due (and not in dispute). Otherwise, the allowable offsets are reduced by 20% of
amounts due from late payers and 20% of amounts recoverable that are in dispute. Late
payers and those that dispute coverage are more likely not to pay than those unauthorized
reinsurers that have a history of paying on time and where no amounts are currently in
dispute. For each reinsurer, the liability is capped at the total amount of reinsurance
recoverable from that reinsurer.
The Appointed Actuary comments on the collectability of reinsurance in the Statement of
Actuarial Opinion. However, a large provision for reinsurance would not always mean there is
a collectability issue. Just because a reinsurer is not authorized (or certified) to transact
business in the company’s domiciliary state doesn’t mean that the reinsurer is not viable and
will not pay claims owed under the terms of the reinsurance contract.
The following provides the calculation of the Provision for Unauthorized Reinsurers included
in Schedule F, Part 3, column 76 of the 2018 Annual Statement for Fictitious Insurance
Company.

FINANCIAL REPORTING THROUGH THE LENS OF A PROPERTY/CASUALTY ACTUARY
Part III. SAP in the U.S.: Fundamental Aspects of the Annual Statement
135
TABLE 27
Provision for Unauthorized Reinsurance (USD in 000)
Reinsurer
Column A B C D E
Source
76
Provision for Unauthorized
Reinsurance 22 75
126
-
1
Minimum of [Column 15 and
sum of Columns 71 + 72]; if
less than 0, enter 0
71
Provision for Reinsurance
Due to Collateral Deficiency 21 75
116
-
1
Column 26
72
Provision for Reinsuran
c
e
Due to Overdue Balances
and Amounts in Dispute
1 0 10
-
-
Column 70 + 20% of Column
16
71
Provision for Reinsurance
Due to Collateral Deficiency 21 75
116
-
1
Column 26
26
Net Recoverable Net of
Funds Held & Collateral 21 75
116
-
1
Column 15
-
Column 25,
unless Column 5 = Special
Code 4, then reduce Column
15 by Columns 11 + 12 in this
calculation
5
Special Code
4
Input by Company
11
IBNR Loss Reserves
16 80 58 16 80
12
IBNR
LAE Reserves
4 22 22 4 22
15
Reinsurance Recoverable on
paid, known case and IBNR
loss and LAE, unearned
premiums and contingent
commissions
42
171
149
35
171
Co
lumns 7 through 14 Totals
25
Total Funds Held, Payables
& Collateral 21 96 33 15
170
Minimum of [Column 15 and
sum of Columns 17 + 18 + 20
+ 21 + 22 + 24], unless
Column 5 = Special Code 4,
then reduce Column 15 by
Columns 11 + 12 in this
calculation
Reinsurance Payable
17
Ceded Balances Payable
1 3 3 1 2
Input by Company
18
Other Amounts Due to
Reinsurers
-
-
-
-
-
Inpu
t by Company
Funds Held
20
Funds Held by Company
Under Reinsurance Treaties 20
-
20 30
100
Input by Company

FINANCIAL REPORTING THROUGH THE LENS OF A PROPERTY/CASUALTY ACTUARY
Part III. SAP in the U.S.: Fundamental Aspects of the Annual Statement
136
Collateral
21
Multiple Beneficiary Trusts
-
-
10
-
-
Input by Company
22
Letters of Credit
-
93
-
-
68
Input by Company
24
Single Beneficiary Trusts &
Other Allowable Collateral
-
-
-
-
-
Input by C
ompany
72
Provision for Reinsurance
Due to Overdue Balances
and Amounts in Dispute
1
0
10
-
-
Column 70 + 20% of Column 16
70
20% of Recoverable on Paid
Losses & LAE Over 90 Days
Past Due Amounts Not in
Dispute
1
0
-
-
-
20% of Column 47
47
Recoverable on Paid Losses
& LAE Over 90 Days Past
Due Amounts Not in
Dispute
5
1
-
-
-
Columns 40 +
41
-
45
Reinsurance Recoverable on Paid
Losses and Paid Loss Adjustment Expenses
40
91
-
120 days past due
5
1
-
-
-
Input by Company
41
Over 120 days past due
-
-
-
-
-
Input by Company
45
Recoverable on Paid Losses
& LAE Over 90 Days Past
Due Amounts in Dispute
Included in Columns 40 &
41
-
-
-
-
-
Input by Company
16
Amount in
Dispute Included
in Column 15
-
-
50
-
-
Input by Company
3. Provision for certified reinsurers in column 77
As discussed earlier in this chapter, the provision for certified reinsurance is calculated in a
separate, dedicated section of Part 3, in columns 54 through 69, and emanates from two
sources:
• Collateral deficiency (column 64), which is defined as the total amount of reinsurance
recoverables, including amounts in dispute, net of reinsurance payables and the
amount of credit allowed (column 19 minus column 63); and
• Overdue balances (column 69) which is calculated as the greater of 20% of
recoverables on paid losses and LAE, including amounts in dispute (i.e., 20% of column
47 and 20% of column 45). For “slow payers”, the provision is modified to be at least
equal to 20% of the net unsecured recoverable for which credit is allowed (column 68
= 20% * column 67 = 20% * (column 63 minus column 66)). In either case, the

FINANCIAL REPORTING THROUGH THE LENS OF A PROPERTY/CASUALTY ACTUARY
Part III. SAP in the U.S.: Fundamental Aspects of the Annual Statement
137
provision should not exceed the amount of credit allowed for net recoverables in
column 63.
The following provides the calculation of the Provision for Certified Reinsurers included in
Schedule F, Part 3, column 77 of the 2018 Annual Statement for Fictitious Insurance
Company.

FINANCIAL REPORTING THROUGH THE LENS OF A PROPERTY/CASUALTY ACTUARY
Part III. SAP in the U.S.: Fundamental Aspects of the Annual Statement
138
TABLE 28
Provision for Certified Reinsurance (USD in 000)
Column
ABC
Reins
LTD
DEF
Reins
LTD
GHI
Reins
LTD
Source
77
Provision for Certified Reinsurance
9 4 -
Columns 64 + 69; if less than 0,
enter 0
64
Pr
ovision for Reinsurance Due to
Collateral Deficiency 9 - -
Greater of Column 19
-
Column
63 and 0
69
Provision for Reinsuran
c
e Due to
Overdue Balances and Amounts in
Dispute
- 4 -
Greater of Columns 62 + 65 and
Column 68, not to exceed Column
63
64
Provision for Reinsurance Due to
Collateral Deficiency 9 - -
Greater of Column 19
-
Column
63 and 0
19
Net Amount Reco
verable From
Reinsurers 84 41 (6)
Columns 15
-
(17 + 18)
15
Reinsurance Recoverable on paid,
known case and IBNR loss and LAE,
unearned premiums and contingent
commissions
121 52 3
Columns 7
through 14 Totals
Reinsurance Payable
17
Ceded Balances Payable
37 11 9
Input by Company
18
Other Amounts Due to
Reinsurers
- - -
Input by Company
63
Amount of Credit Allowed for Net
Recoverables 75 41 -
Column 57 + [Column 58 *
Column 61]
57
Catastrophe Recoverables Qualifying
for Collateral Deferral - - -
Inpu
t by Company
58
Net Recoverables Subject to
Collateral Requirements for Full
Credit
84 41 (6)
Column 19
-
Column 57
61
Percent Credit Allowed on Net
Recoverables Subject to Collateral
Requirements
89 100 -
Column 60 / Column 56, not to
exceed 100%
60
Percent of Collateral Provided for Net
Recoverables Subject to Collateral
Requirements
17.9 151.2 -
[Columns 20 + 21 + 22 + 24] /
Column 58
56
Percent Collateral
Required for
Full
Credit (0% through 100%) 20.0 10.0 10.0
Funds Held
20
Funds Held by Company Under
Reinsurance Treaties - - -
Input by Company

FINANCIAL REPORTING THROUGH THE LENS OF A PROPERTY/CASUALTY ACTUARY
Part III. SAP in the U.S.: Fundamental Aspects of the Annual Statement
139
Collat
eral
21
Multiple Beneficiary Trusts
- 40 -
Input by Company
22
Letters of Credit
15 22 -
Input by Company
24
Single Beneficiary Trusts & Other
Allowable Collateral - - -
Input by Company
72
Provision for Reinsurance Due to
Overdue Balances and Amounts in
Dispute
- 4 -
Greater of Columns 62 + 65 and
Column 68, not to exceed Column
63
62
20% of Recoverable on Paid Losses &
LAE Over 90 Days Past Due Amounts
in Dispute
- - -
20% of Column 45
65
20% of Recoverable on Paid
Losses &
LAE Over 90 Days Past Due Amounts
Not in Dispute
- 4 -
20% of Column 47
68
20% of Amount in Column 67 (for
"slow payers") - - -
20% of Column 67
45
Recoverable on Paid Losses & LAE
Over 90 Days Past Due Amounts in
Dispute Included in Cols. 40 & 41
- - -
Input by Company
47
Recoverable on Paid Losses & LAE
Over 90 Days Past Due Amounts Not
in Dispute
- 20 -
Columns 40 + 41
-
4
5
67
Net Unsecured Recoverable for Which
Credit is Allowed (for "slow payers") - - -
Column 63
-
Column 66, if
Column 52 = "No"
66
Total Collateral Provided (for "slow
payers") - 41 -
Columns 20 + 21 + 22 + 24; not
to exceed Column 63; if Column
52 = "No"
Reinsurance Recoverable on Paid Losses and Paid Loss
Adjustment Expenses
40
91
-
120 days past due
- 20 -
Input by Company
41
Over 120 days past due
- - -
Input by Company
45
Recoverable on Paid Losses & LAE
Over 90 Days Past Due Amounts in
Dispute Included in Columns 40 & 41
- - -
Input by Company
The final provision for reinsurance in column 78 of Schedule F, Part 3, which is equal to the
amount recorded in Liabilities, Surplus and Other Funds on Page 3, line 16 ($283,000) of the
Annual Statement, is equal to the sum of the following three items:

FINANCIAL REPORTING THROUGH THE LENS OF A PROPERTY/CASUALTY ACTUARY
Part III. SAP in the U.S.: Fundamental Aspects of the Annual Statement
140
TABLE 29 (same as TABLE 25)
Column Provision for Reinsurance (USD in 000) Total
75
1.
Provision for
Authorized Reinsurance
46
76
2.
Provision for Unauthorized Reinsurance
224
77
3.
Provision for
Certified Reinsurance
13
78
Total Provision for Reinsurance
283
SCHEDULE F — PART 4: ISSUING OR CONFIRMING BANKS FOR LETTERS OF CREDIT FROM
SCHEDULE F, PART 3 ($000 OMITTED)
Schedule F, Part 4 is for information purposes. It provides a listing of the issuing or
confirming banks for letters of credit as collateral reported in Schedule F, Part 3, column 22.
Confirming banks are those that provide a guarantee on a letter of credit such that the
confirming bank will pay if the original bank issuing the letter of credit bank does not.
There are 5 columns in Part 4:
Column (1): provides the issuing or confirming bank reference number.
Column (2): identifies by a “1”, “2” or “3” whether single, syndicated or multiple letters of
credit, respectively, are provided as collateral. Syndicated letters of credit are
those where one bank acts as an agent for a group of banks issuing the letter of
credit.
Column (3): provides the American Bankers Association (ABA) Routing Number for the
letter of credit issuing or confirming bank.
Column (4): provides the name of the issuing or confirming bank.
Column (5): provides the amount of the letter of credit, the sum of which should equal the
total of Schedule F, Part 3, column 22.
SCHEDULE F — PART 5: INTERROGATORIES FOR SCHEDULE F, PART 3 ($000 OMITTED)
Schedule F, Part 5 provides interrogatories for Schedule F, Part 3. The interrogatories
include two tables with more detailed information. These two tables are particularly relevant
from a regulatory perspective.
The first table identifies the five largest commission rates included in the cedant’s reinsurance
treaties for those contracts where ceded premium is in excess of $50,000.
68
The top five
provisional commission rates are considered in conjunction with column 14 (contingent
68
According to the NAIC Annual Statement Instructions, the five largest should exclude mandatory pools and joint
underwriting associations.

FINANCIAL REPORTING THROUGH THE LENS OF A PROPERTY/CASUALTY ACTUARY
Part III. SAP in the U.S.: Fundamental Aspects of the Annual Statement
141
commissions receivable) and the aforementioned Note to the Financial Statements on
reinsurance assumed and ceded. The purpose is to identify companies that may be using
reinsurance as a means to conceal high operating leverage. As we shall see in Appendix I of
this publication, one purpose of the NAIC’s Insurance Regulatory Information System (IRIS)
ratios is to identify companies that may be taking on more business and more risk than they
can handle relative to their surplus. Specifically, IRIS Ratio 2 provides the ratio of net written
premium to policyholders’ surplus. Unusual values triggering regulatory attention are those in
excess of 300% on a net basis. The 300% ratio on a net basis corresponds to the age-old
generally accepted benchmark that insurers remain within the 3-to-1 range in terms of
writings relative to surplus.
Companies growing rapidly may use reinsurance as a means to reduce pressure on its surplus.
This is known as “surplus relief.” All else being equal, an increase in the amount of ceded
premiums will reduce the amount of net premiums and reduce the premium to surplus ratio
(IRIS Ratio 2). This is perfectly legitimate; the purpose of reinsurance is to spread and
manage insurance risk.
For example, consider a company that has $150 million of direct written premium and surplus
of $25 million. The premium-to-surplus ratio is 600%, well above the 300% benchmark. Let’s
say this company decides to purchase a 30% quota share reinsurance contract with a fixed
ceding commission of 35%. The company’s net written premium would be:
Direct written premium * (1 – ceding percentage)
= $150 million * (1 – 0.30)
= $105 million.
At the onset of the contract, the company’s surplus would grow by the amount of ceding
commission:
Direct written premium * ceding percentage * ceding commission
= $150 million * 30% * 35%
= $15.75 million
The resulting surplus would be $40.75 million ($25 million current surplus plus $15.75
million in ceding commission). The purchase of this contract would reduce the company’s
premium-to-surplus ratio below the 300% “usual” value benchmark, from 600% to 258%.
However, consider the situation where the commission is instead offered on sliding scale basis
such that a one-point increase in loss ratio from 65% would result in a one-point decrease in
the 35% commission rate. The premium-to-surplus ratio at the onset of this contract would be
the same as that under the situation where the commission rate is fixed (258%). However, if
the actual loss ratio turns out to be 80%, then the company will have to return $6.75 million
of the original $15.75 million in ceding commission. Instead of receiving 35% of ceded

FINANCIAL REPORTING THROUGH THE LENS OF A PROPERTY/CASUALTY ACTUARY
Part III. SAP in the U.S.: Fundamental Aspects of the Annual Statement
142
premium in commission, the company (reinsured) will end up getting only 20%. If a 20% fixed
commission rate was considered at the onset, the premium-to-surplus ratio would have been
309%, triggering an unusual value for IRIS Ratio 2.
Schedule F, Part 5 and the reinsurance Note to the Financial Statements identify reinsurance
contracts with high provisional commission rates so that the regulator may investigate these
contracts and determine if they are being used to mask high operating leverage.
We note that IRIS Ratio 4 (surplus aid to policyholders surplus) is another statistic that can
identify companies that rely heavily on reinsurance for surplus relief. As explained in
Appendix I of this publication, IRIS Ratio 4 provides the ratio of surplus aid to policyholders
surplus. Surplus aid is the amount of surplus enhancement in the current year attributed to
ceding commission (both fixed and contingent) that has been taken into income on ceded
unearned premium. Ratios of surplus aid to policyholders surplus in excess of 15% are
considered unusual and trigger regulatory scrutiny.
In either of our examples (with the 35% ceding commission being either fixed or provisional),
IRIS Ratio 4 would be computed as 39% at the onset of the contract, well in excess of the 15%
benchmark.
69
This further illustrates the company’s heavy use of reinsurance as surplus
relief, masking considerable growth and uncertainty in results.
The second table in Part 5 identifies the five largest reinsurance recoverables reported in
column 15 and associated ceded premiums, as well as an indicator as to whether the
reinsurer is affiliated with the reporting entity. This table enables the regulator to assess
concentration of reinsurance credit risk.
SCHEDULE F — PART 6: RESTATEMENT OF BALANCE SHEET TO IDENTIFY NET CREDIT FOR
REINSURANCE
Part 6 of Schedule F provides a summarized form of the balance sheet with adjustments to
restate it on a gross of ceded reinsurance basis. That is, Part 6 provides a snapshot of the
balance sheet as if the company had no reinsurance protection.
Part 6 is one page and displays the assets followed by the liabilities. Both the assets and
liabilities are in a condensed format for ease of presentation and computation. There are
three columns, providing balances for each of the following asset and liability line items:
Column 1: As Reported (Net of Ceded)
This provides the amounts included on page 2 of the Annual Statement,
which are net of reinsurance.
Column 2: Restatement Adjustments
69
IRIS Ratio 4 is computed as the unearned premium reserve of $45 million multiplied by the 35% ceding
commission and divided by policyholders surplus of $40.75 million.

FINANCIAL REPORTING THROUGH THE LENS OF A PROPERTY/CASUALTY ACTUARY
Part III. SAP in the U.S.: Fundamental Aspects of the Annual Statement
143
This provides the adjustments necessary to put the net amounts in
column 1 on a gross of reinsurance basis in column 3.
Column 3: Restated (Gross of Ceded)
This is equal to the sum of columns 1 and 2 and shows the
corresponding asset and liability figures on a gross of reinsurance basis.
Adjustments to assets
The asset side of the balance sheet is generally easier to adjust because there are fewer items
that require adjustment. This is because certain items relate to direct or assumed business
only, and/or certain items are not impacted by the amounts associated with a company’s
ceded reinsurance transactions. In general, no adjustment is made to the following asset
items within Part 9:
• Cash and invested assets (line 1 of Schedule F, Part 6; line 12 of page 2), as these
represent balances that the company has on hand or invested, regardless of its ceded
reinsurance
• Premiums and considerations (line 2 of Schedule F, Part 6; line 15 of page 2), as these
represent uncollected or deferred balances relating to direct written premiums
• Funds held by or deposited with reinsured companies (line 4 of Schedule F, Part 9; line
16.2 of page 2), as these represent balances for business assumed by the company,
not ceded
• Other assets (line 5 of Schedule F, Part 6; representing the balance of page 2 not
separately identified), as these represent balances that would not change regardless
of ceded reinsurance balances, such as title plants, furniture and electronic data
equipment
• Protected cell assets (line 7 of Schedule F, Part 6; line 27 of page 2), as these are not
related to ceded reinsurance
The only two lines that are affected by the reinsurance adjustments are line 3, reinsurance
recoverable on loss and loss adjustment expense payment, and line 6, net amount
recoverable from reinsurers. The adjustment in line 3 is simply a reversal of the amount of
reinsurance recoverable on loss and LAE such that the balance gross of reinsurance ceded is
$0 for this asset. The adjustment for line 6 is a balancing item such that the total adjustments
on the liabilities side of the balance sheet equal those on the asset side.
Adjustments to liabilities
With respect to the Liability side of the balance sheet, no adjustment is typically made to the
following line items in Part 6:

FINANCIAL REPORTING THROUGH THE LENS OF A PROPERTY/CASUALTY ACTUARY
Part III. SAP in the U.S.: Fundamental Aspects of the Annual Statement
144
• Taxes, expense, and other obligations (line 10 of Schedule F, Part 9; lines 4 through 8
of page 3), as these are generally applied to direct writings
• Advance premium (line 12 of Schedule F, Part 6; line 10 of page 3), as this represents
balances that the company has received in advance on its direct writings
• Dividends declared and unpaid (line 13 of Schedule F, Part 6; line 11.1 and 11.2 of
page 3), as dividends are not affected by the ceded reinsurance balances
• Amounts withheld or retained by company for account of others (line 16 of Schedule
F, Part 6; line 14 of page 3), as these balances are not related to ceded reinsurance
• Other liabilities (line 18 of Schedule F, Part 6; representing the balance of the
liabilities on page 3 not separately identified), as these are unrelated to ceded
reinsurance
Adjustments are made for the following lines:
Line 9: Losses and LAE (lines 1 through 3 of page 3)
These balances are stated net on a company’s statutory balance sheet. The
adjustment puts the balances on a gross of reinsurance basis. For companies
that are not involved in intercompany pooling arrangements, the adjustment
equals the ceded case and IBNR figures from Schedule P, Part 1, Summary,
total, columns 14, 16, 18, 20 and 22.
Line 11: Unearned premiums (line 9 of page 3)
These balances are stated net on a company’s statutory balance sheet. The
adjustment puts the balances on a gross of reinsurance basis. The source of
the ceded unearned premium reserve is Schedule F, Part 3, column 13,
multiplied by 1,000. The ceded balance is also provided within the
parenthetical reference on the Liabilities, Surplus and Other Funds page of the
Annual Statement (page 3) on line 9.
Line 14: Ceded reinsurance premiums payable (line 12 of page 3)
If ceded reinsurance is ignored, as is the purpose of Part 6, then the company
will not have any ceded reinsurance premiums payable. The adjustment
reverses the amount in column 1.
Line 15: Funds held by company under reinsurance treaties (line 13 of page 3)
Similarly, if there are no ceded reinsurance treaties, then the company won’t
have any funds held related to these treaties. The adjustment reverses the
amount in column 1.
Line 17: Provision for reinsurance (line 16 of page 3)
This is the Schedule F “penalty,” as computed in Schedule F, Part 3. If the
company is assumed to have no reinsurance protection in Part 6, then there

FINANCIAL REPORTING THROUGH THE LENS OF A PROPERTY/CASUALTY ACTUARY
Part III. SAP in the U.S.: Fundamental Aspects of the Annual Statement
145
will be no provision for reinsurance. The adjustment reverses the amount in
column 1.
Surplus
Surplus remains unadjusted in Part 6, as such, the adjustment amount is shown as “XXX” in
column 2 and the amount in column 3 equals that in column 1.
Totals
The totals shown in column 1, line 22 of Part 6, balance to the totals shown on line 38 of page
3 of the Annual Statement. The total is equal to the difference between the total assets and
total liabilities of the company. This calculation follows through to column 3, with the new
total being on gross of reinsurance basis.
The following provides Schedule F, Part 6 for Fictitious Insurance Company.

FINANCIAL REPORTING THROUGH THE LENS OF A PROPERTY/CASUALTY ACTUARY
Part III. SAP in the U.S.: Fundamental Aspects of the Annual Statement
146
TABLE 30
Schedule F — Part 6
Annual Statement for the year 2018 of the Fictitious Insurance Company
Restatement of Balance Sheet to Identify Net Credit for Reinsurance
1 2 3
As Reported
(Net of
Ceded)
Restatement
Adjustments
Restated
(Gross of
Ceded)
Assets (page 2, Col. 3)
1. Cash and invested assets (Line 12) 87,825,000 0 87,825,000
2. Premiums and considerations (Line 15) 7,990,000 0 7,990,000
3. Reinsurance recoverable on loss and loss adjustment
expense payments (Line 16.1) 426,000 (426,000) 0
4. Funds held by or deposited with reinsured companies
(Line 16.2) 0 0 0
5. Other assets 3,759,000 0 3,759,000
6. Net amount recoverable from reinsurers 0 10,595,000 10,595,000
7. Protected cell assets (Line 27) 0 0 0
8. Totals (Line 28) 100,000,000 10,169,000 110,169,000
Liabilities (page 3)
9. Losses and loss adjustment expenses (Lines 1 through 3) 51,557,000 10,142,000 61,699,000
10. Taxes, expenses, and other obligations (Lines 4
through 8) 1,932,000 0 1,932,000
11. Unearned premiums (Line 9) 11,895,000 920,000 12,815,000
12. Advance premiums (Line 10) 0 0 0
13. Dividends declared and unpaid (Lines 11.1 through 11.2) 1,562,000 0 1,562,000
14. Ceded reinsurance premiums payable (net of ceding
commissions) (Line 12) 440,000 (440,000) 0
15. Funds held by company under reinsurance treaties
(Line 13) 170,000 (170,000) 0
16. Amounts withheld or retained by company for account
of others (Line 14) 308,000 0 308,000
17. Provision for reinsurance (Line 16) 283,000 (283,000) 0
18. Other liabilities 829,000 0 829,000
19. Total liabilities excluding protected cell business
(Line 26) 68,976,000 10,169,000 79,145,000
20. Protected cell liabilities (Line 27) 0 0 0
21. Surplus as regards policyholders (Line 37) 31,024,000 0 31,024,000
22. Totals (Line 38) 100,000,000 10,169,000 110,169,000
As displayed above, the asset items are adjusted in column 2 for:
• Reinsurance recoverable on loss and LAE payments in line 3, totaling $426,000
• The net amount recoverable from reinsurers in line 6, totaling $10,595,000

FINANCIAL REPORTING THROUGH THE LENS OF A PROPERTY/CASUALTY ACTUARY
Part III. SAP in the U.S.: Fundamental Aspects of the Annual Statement
147
The amount in line 6, column 2, is simply a reversal of the balance shown in column 1, and
therefore the asset side of the balance sheet. The amount in line 6 is computed as the “plug,”
such that the total adjustment to the assets in line 8 equals the total adjustment to the
liabilities in line 19.
The liability items are adjusted in column 2 for:
• Loss and LAE in line 9, totaling $10,142,000
• Unearned premiums in line 11, totaling $920,000
• Ceded reinsurance premiums payable in line 14, totaling $440,000
• Funds held by company under reinsurance treaties in line 15, totaling $170,000
• Provision for reinsurance in line 17, totaling $283,000
The amount in line 9, column 2, is equal to the amount of ceded loss and LAE reserves per
Schedule P, Part 1, Summary, of Fictitious’ 2018 Annual Statement (sum of the totals in
columns 14, 16, 18, 20 and 22).
70
For companies that do not participate in intercompany pooling, line 9 is equal to the ceded
reserve loss and LAE reserve balance in Schedule P, Part 1, Summary. However, for those
that operate in an intercompany pooling arrangement, we note that Schedule P is prepared
net of pooling on both a gross and net of external reinsurance basis, whereas Schedule F
considers all assumed and ceded reinsurance, including intercompany pooling. As such, it
makes it difficult to have full visibility into the loss and LAE reserve balances shown in column
2 of Schedule F, Part 6 for companies participating in intercompany pooling.
The amount in line 11, column 2 is equal to the amount of gross unearned premium reserves
that are ceded, as displayed in the total line of Schedule F, Part 3, column 13, multiplied by
1,000.
The amounts in column 2 for lines 14, 15, and 17 represent a reversal of the amount in
column 1.
As displayed above, there is no adjustment to surplus; therefore, the amount in column 1
equals that in column 3 ($31,024,000).
70
Schedule P is prepared net of intercompany pooling on both a gross and net of external reinsurance basis,
whereas Schedule F considers all assumed and ceded reinsurance, including intercompany pooling. As such, it
makes it difficult to have full visibility into the loss and LAE reserve balances shown in column 2 of Schedule F, Part
6 for companies participating in intercompany pooling arrangements.

FINANCIAL REPORTING THROUGH THE LENS OF A PROPERTY/CASUALTY ACTUARY
Part III. SAP in the U.S.: Fundamental Aspects of the Annual Statement
148
SUMMARY
As we have seen, Schedule F is not only important to actuaries in assessing net loss and LAE
reserves, but it is also an important tool to the many users of the Annual Statement in
solvency monitoring because it:
• Identifies the amount of gross losses that emanate from the reporting entity’s
assumed reinsurance transactions;
• Provides an estimate of the significance of the reporting entity’s assumed and ceded
reinsurance transactions to its surplus;
• Enables further inquiry into the financial strength of the reporting entity’s reinsureds
and reinsurers;
• Quantifies “credit risk” related to reinsurance recoverables for purposes of the NAIC’s
RBC formula; and
• Identifies the reporting entity’s reinsurers that may require further scrutiny because
they are either slow at paying claims or are not regulated.
Yet, Schedule F is only one of many tools used to monitor solvency by regulators. As we have
stressed throughout this publication, no one tool can be used blindly.
Further, while Schedule F is valuable, it has received some criticism as to how well it meets
the regulatory objectives of monitoring solvency for the protection of policyholders. The
following are a few of those criticisms:
71
• The provision for reinsurance is strictly formulaic, potentially masking the true
estimate of uncollectible reinsurance that would be determined by company
management based on their knowledge of the reinsurers and terms of each contract.
• There is no statistical, historical or actuarial basis for the formula, and its application
may not adequately represent an insurer’s exposure to collectability risk.
• Unauthorized reinsurance may provide more and/or higher-quality reinsurance at a
lower price than a competing authorized reinsurer.
• Slow payers who are financially strong eventually pay, whereas a reinsurer that is
current in its payments may not be able to withstand a stress scenario to its financials.
• The numerous calculations and detail involved in determining the provision for
reinsurance can lead to a false level of precision such that the true issue of
collectability risk is overlooked.
• The costs associated with collateral requirements may be passed down to the primary
policy, thereby costing the policyholder more for insurance.
• The provisions within Schedule F can limit competition to the U.S. market as a result of
the penalty that the European reinsurers bring given that they are unauthorized.
71
Feldblum, S., “Reinsurance Accounting: Schedule F,” April 2003, pages 40-47.

FINANCIAL REPORTING THROUGH THE LENS OF A PROPERTY/CASUALTY ACTUARY
Part III. SAP in the U.S.: Fundamental Aspects of the Annual Statement
149
• Schedule F does not directly tell us anything about the reinsurer’s solvency, which is
really the source of collectability risk.

FINANCIAL REPORTING THROUGH THE LENS OF A PROPERTY/CASUALTY ACTUARY
Part III. SAP in the U.S.: Fundamental Aspects of the Annual Statement
150
CHAPTER 15. SCHEDULE P
OVERVIEW
Schedule P is probably the most important schedule within the Annual Statement to
property/casualty actuaries. Schedule P provides details underlying the recorded loss and
loss adjustment expense (LAE) reserves on the reporting entity’s statutory balance sheet,
including 10 years of the company’s historical loss and defense and cost containment (DCC)
experience (i.e., net paid, case outstanding and incurred loss and DCC triangles). Because the
Annual Statement is a public document, Schedule P tends to be a means for outside parties to
evaluate the adequacy of recorded reserves, absent loss and LAE data provided directly by
the company. And even when detailed data is provided by the company, oftentimes outside
parties look to Schedule P for purposes of providing a check on the reasonableness of the
recorded balances. However, there are cautions to using this information, and we have
presented several within this chapter.
Schedule P has numerous other uses in addition to providing support for the recorded loss
and LAE reserves. For example, Schedule P:
• Supports and provides necessary disclosures for the Statement of Actuarial Opinion,
including:
• Direct plus assumed and net loss and expense reserves
• The amount of anticipated salvage and subrogation (S&S) that the reporting
entity takes credit for in its reserves
• The amount of tabular and non-tabular discount that the reporting entity takes
credit for in its reserves
• Shows how loss reserves have developed over time and enables the reader to decipher
whether development is attributed to a specific year or line of business
•
• Shows the split between a company’s reserves for known claims and those actuarially
determined (i.e., IBNR reserves)
• Provides historical claim count data to facilitate review of trends in claim frequency
and severity, as well as changes in claims handling and reserving
• Provides information necessary to compute the loss sensitive discount in the RBC
calculation
We will discuss some of these additional uses within this chapter.
ORGANIZATIONAL STRUCTURE
There are seven parts to Schedule P plus interrogatories, as described below.
Part 1 summarizes a company’s loss and LAE experience as of December 31 of the current
year. It displays a company’s loss and LAE reserves, after adjustment for tabular discount if

FINANCIAL REPORTING THROUGH THE LENS OF A PROPERTY/CASUALTY ACTUARY
Part III. SAP in the U.S.: Fundamental Aspects of the Annual Statement
151
applicable, and then separately shows the reserves net of all discounts (both tabular and non-
tabular). These are the loss and LAE reserves that are recorded on a company’s statutory
balance sheet (page 3 of the Annual Statement).
For those companies that participate in intercompany pooling, Part 1 displays the pooling
percentage.
Part 2 provides a historical display of a company’s net ultimate loss and DCC estimates. This
enables the user to see how the company’s ultimate loss and DCC estimates have developed
over time. In a perfect world, the company’s ultimate estimate of the cost of incurred claims
would remain the same at each evaluation point. However, these are estimates, and therefore
have the potential to develop upward or downward as the claims mature. The information
provided in Part 2 feeds into the one-year development test in the Five-Year Data Exhibit and
is also used in computing the NAIC Insurance Regulatory Information System (IRIS) ratios 11,
12 and 13.
Part 3 shows a historical array of the company’s net paid loss and DCC experience as of each
of the past 10 years. Actuaries can use this information to project unpaid claims using
methods such as the paid loss development technique.
The difference between Part 2 (ultimates) and Part 3 (paids) provides a historical array of the
company’s net loss and DCC reserves as of each of the past 10 years. These amounts are
provided before tabular discount.
Part 4 displays a company’s recorded net IBNR for loss and DCC before tabular discount. The
difference between Parts 2 and 4 provides a historical array of the company’s net reported
loss and DCC experience as of each of the past 10 years. This information can be used by
actuaries to project unpaid claims using methods such as the case incurred loss development
technique.
Part 5 provides a historical array of claim counts as of each of the past 10 years, including
claims closed with payment, open claims and reported claims.
Part 6 displays the earning of premium over time, separately on a direct plus assumed and
ceded basis. Like the information provided in Parts 2 through 4, the earned premium data is
provided in a triangular format enabling the monitoring of premium adjustments over time.
Part 7 provides loss and premium data on loss sensitive contracts, separately for primary and
reinsurance contracts, for those lines of business where such contracts are written.
All dollar amounts presented in Schedule P are in thousands (i.e., 000 omitted).
Within the remaining sections of this chapter, we will provide an overview of each part of
Schedule P, focusing on those of most relevance to the property/casualty actuary. We will
then get into details of those parts, providing relevant examples from the 2018 Schedule P
for Fictitious Insurance Company.

FINANCIAL REPORTING THROUGH THE LENS OF A PROPERTY/CASUALTY ACTUARY
Part III. SAP in the U.S.: Fundamental Aspects of the Annual Statement
152
SCHEDULE P — PART 1
Part 1 is shown in summary format for all lines of business combined, followed by separate
schedules (Parts 1A through 1T) in the same format as Part 1 – Summary, but by Schedule P
line of business. The data in Part 1 is provided on a direct plus assumed (gross) and ceded
basis and includes premiums earned, paid loss and LAE, case outstanding loss and DCC
reserves, and IBNR for loss and LAE. Additionally, incurred loss and LAE ratios are displayed
on a gross, ceded and net of reinsurance basis.
One item that is not included in Schedule P is the segregation of gross data into its direct and
assumed components. Oftentimes actuaries look for this information separately in performing
analyses of unpaid claims; however, it is not provided in Schedule P. As noted in Chapter 14.
Schedule F, certain of this information can be provided in Schedule F, Part 1, including
assumed case reserves.
Line of Business Segmentation in Part 1
Parts 1A through 1T provide the same information as in Part 1 – Summary, except separately
by line of business. The line of business segmentations are as follows:
A – Homeowners/Farmowners
B – Private Passenger Auto Liability/Medical
C – Commercial Auto Liability/Medical
D – Workers’ Compensation
E – Commercial Multiple Peril
F – Section 1 – Medical Professional Liability – Occurrence
F – Section 2 – Medical Professional Liability – Claims-Made
G – Special Liability (Ocean Marine, Aircraft (All Perils), Boiler & Machinery)
H – Section 1 – Other Liability – Occurrence
72
H – Section 2 – Other Liability – Claims-Made
I – Special Property (Fire, Allied Lines, Inland Marine, Earthquake, Burglary & Theft)
J – Auto Physical Damage
K – Fidelity/Surety
L – Other (Including Credit, Accident and Health)
M – International
N – Reinsurance – Nonproportional Assumed Property
73
O – Reinsurance – Nonproportional Assumed Liability
74
72
Business reported as an aggregate write-in for other lines of business in the State Page is included here (either as
occurrence or claims-made, depending on the coverage written).
73
Property includes fire, allied, ocean marine, inland marine, earthquake, group, credit and other A&H, auto
physical damage, boiler and machinery, burglary and theft and international property.
74
Liability includes farmowners, homeowners and commercial multiperil; medical professional liability workers’
compensation; other liability; products liability; auto liability; aircraft (all peril); and international liability.

FINANCIAL REPORTING THROUGH THE LENS OF A PROPERTY/CASUALTY ACTUARY
Part III. SAP in the U.S.: Fundamental Aspects of the Annual Statement
153
P – Reinsurance – Nonproportional Assumed Financial Lines
75
R – Section 1 – Products Liability – Occurrence
76
R – Section 2 – Products Liability – Claims-Made
S – Financial Guaranty/Mortgage Guaranty
T – Warranty
The definitions of these lines correspond to those on the Exhibit of Premiums and Losses
(Statutory Page 14), with the exception of the three nonproportional reinsurance assumed
lines (Parts N, O and P), which are not included in Statutory Page 14, as it provides
information on a direct basis only. Nonproportional reinsurance assumed is generally excess
of loss reinsurance, whereas proportional is generally a form of quota share reinsurance.
Proportional reinsurance is included within its respective line(s) of business segments. For
example, premiums and losses associated with assumed commercial property reinsurance
under a quota share contract would be included within Schedule P, Part 1I, whereas the same
risk assumed on an excess of loss basis would be included within Schedule P, Part 1N.
Only two accident years and a “prior years” row are shown for the following lines due to the
limited amount of loss development beyond two years:
I – Special Property (Fire, Allied Lines, Inland Marine, Earthquake, Burglary & Theft)
J – Auto Physical Damage
K – Fidelity/Surety
L – Other (Including Credit, Accident and Health)
S – Financial Guaranty/Mortgage Guaranty
T – Warranty
That is, claims for the aforementioned lines of business are expected to be reported and paid
within a relatively short period of time after the occurrence of a claim. Consider the Special
Property line of business. If a commercial property is damaged due to fire, the insured will
report the claim rather quickly to get the building repaired or rebuilt in order to continue
operations. Payments may continue to the insured while the commercial property is being
repaired due to business interruption; however, the insured will generally be back in business
within the year in which the loss occurred. As a result, losses will develop for 12 to 24 months
after the beginning of the accident year (January 1) in which the loss occurred, but typically
the claim will be closed by the end of 24 months.
To illustrate the “bucketing” of claims, consider a complete fire loss to a paper mill on
December 19, 2018. Assume the building is rebuilt and the insured is back in business on
September 4, 2019. This claim would be recorded as an accident year 2018 claim, with loss
75
Financial includes financial guaranty, fidelity, surety, credit, and international financial.
76
There is no Part Q.

FINANCIAL REPORTING THROUGH THE LENS OF A PROPERTY/CASUALTY ACTUARY
Part III. SAP in the U.S.: Fundamental Aspects of the Annual Statement
154
payments extending into the second year of development (24-month period) until the claim is
closed on September 4.
Despite only two years being shown in the Schedule P line of business parts, all 10 years are
included in Schedule P – Part 1 – Summary. Therefore, the insurer is required to retain data
for these lines in a similar 10-year format as all other lines of business in Schedule P.
Many have argued that the two-year reporting convention is not necessarily appropriate for
the aforementioned lines of business due to the tail on lines such as Fidelity/Surety. These
opponents would vote for including all 10 years, as is shown for the other Schedule P lines,
arguing further that all 10 years are already produced for purposes of forming the summaries
in Schedule P.
Yearly Reporting Convention
Part 1 provides information related to earned premiums and cumulative loss and LAE data at
the current evaluation date (i.e., December 31 of the current year) for the last 10 years in
which premiums are earned and losses incurred. Earned premiums are shown by calendar
year, and once they are entered in Schedule P, they do not change for retrospective premium
adjustments or other adjustments. Losses are shown by:
• Accident year for occurrence policies
• Report year for claims-made policies
• Policy year for tail policies
• Discovery year for fidelity and surety policies
Accident year is defined as the calendar year in which accidents occur and/or losses are
incurred. For example, a claim with a date of loss of November 13, 2018, would be a 2018
accident year claim. This reporting convention is used for occurrence-basis policies, where
the trigger of coverage is the occurrence of a loss. With occurrence policies, a claim can be
reported at any time after the loss occurs, subject to statutes of limitation, as long as the loss
occurs during the policy term. For example, an injury that occurred 15 years ago can be
reported to the insurer today, and any coverage for that injury would be provided by the
terms and conditions of the policy that was in effect 15 years ago.
Report year represents the calendar year in which losses are reported. This is typically used
for claims-made policies, as the trigger of coverage is the reporting of a claim or incident to
the insurance carrier. In their most basic format, claims-made policies cover claims that are
first made during the policy term. As a result, if a claim occurs during the policy period but is
not reported by the insured during the policy term, the claim is not covered by the insurance
company under the terms and conditions of the policy that was in force at the time the claim
occurred. This significantly reduces the uncertainty for the insurance carrier, both for pricing
and reserving, since the policy that is in effect at the time the claim is made will be the policy

FINANCIAL REPORTING THROUGH THE LENS OF A PROPERTY/CASUALTY ACTUARY
Part III. SAP in the U.S.: Fundamental Aspects of the Annual Statement
155
providing the coverage for the claim, regardless of how long ago the incident took place
(provided there is no retroactive date on the policy).
A claims-made policy may have a retroactive date that is before the effective date of the
policy, the same as the effective date of the policy or it may have no retroactive date. The
retroactive date is the date on or after which the incident must occur in order for it to be
covered under the claims-made policy. An incident that occurs before the retroactive date will
not be covered by the claims-made policy even if it is first reported during the policy period.
These types of policies are generally issued for medical malpractice, other liability, or
products liability coverages because claims covered by these types of policies tend to have a
long latency period. It becomes very difficult for insurance companies to project the claim
frequency as well as the severity of claims and therefore difficult to price and reserve for an
occurrence that will result in the reporting of a claim many years in the future.
To illustrate the concept of claims-made coverage and the concept of report year, assume a
young surgeon purchases a medical malpractice policy on a claims-made basis for the term
beginning July 1, 2018, and expiring on June 30, 2019. Assume that the surgeon performs a
procedure on his patient on October 21, 2018, and complications arise during the surgery. If
the surgeon reports the incident to his insurance carrier before June 30, 2019, and
subsequently the surgeon is sued and a claim materializes, he will be covered under his policy
in effect from July 1, 2018, through June 30, 2019. This would be a 2018 report year claim
for Schedule P reporting purposes. If the surgeon does not report the incident because the
patient did not become aware of the complications until a year later, and the claimant decides
to sue the physician on August 22, 2019, the surgeon reports this claim to his carrier on
August 23, 2019. He would not be covered by the policy in effect from July 1, 2018, through
June 30, 2019, as the claim was not reported during the policy term. If the surgeon renewed
the claims made policy, the renewal policy that is in effect from July 1, 2019, through June
30, 2020, would be the policy that covers the claim.
In general, the people or companies that purchase claims-made policies do not like to leave
themselves exposed to the risk of being uninsured, despite the cost savings of a claims-made
policy as compared to an occurrence policy. As a result, they generally purchase something
called an extended reporting period or “tail coverage.” Tail coverage extends the reporting
period of a claims-made policy for an additional period of time, which may be one to five years
or an unlimited period of time past the expiration of the claims-made policy. A claims-made
policy plus an unlimited extended reporting period essentially turns the claims-made policy
into an occurrence policy. To illustrate using our previous example, let’s assume that the
surgeon does not renew his claims-made policy and therefore purchases unlimited tail
coverage on July 1, 2019, when the policy expires. This means that any accident or loss that
occurred as a result of error by the surgeon during the period July 1, 2018, through June 30,
2019, would be a covered claim by the insurance company that issued the claims-made

FINANCIAL REPORTING THROUGH THE LENS OF A PROPERTY/CASUALTY ACTUARY
Part III. SAP in the U.S.: Fundamental Aspects of the Annual Statement
156
policy regardless of when in the future the surgeon first reports the claim. Without the tail
coverage, the surgeon would have no coverage for claims that he learns about on or after
July 1, 2019.
Premiums and losses associated with tail policies are included in Schedule P with their
associated line on an occurrence basis.
Discovery year is generally used for fidelity and surety policies, as it is difficult to determine
the actual date the “loss” occurs. As the name suggests, discovery year represents the
calendar year in which a loss or damage is discovered.
For simplicity, and because it is most common, we will use the term accident year in the
remainder of our discussion of Schedule P, unless explicitly stated otherwise.
Note that there is also a prior years row in Schedule P, which accumulates loss and expense
information into one row within each of the schedules. The prior years row shows paid
(received) activity during the current year (i.e., calendar year activity) and ending reserves as
of the evaluation date of the Statement. Within this chapter we provide examples of how to
calculate the prior years row; it is a bit trickier than this brief explanation suggests.
Loss Adjustment Expenses
Losses are provided separately from LAE, which is separated into two components: DCC
expenses and Adjusting and Other (A&O) expenses. DCC generally includes defense, litigation
and medical cost containment expenses, whether internal or external, and A&O includes all
expenses associated with adjusting and recording policy claims, other than those included
with DCC.
77
The following table summarizes the types of expenses by category.
77
Per the Official NAIC Annual Statement Instructions for 2018, DCC are defined as “those that are correlated with
the loss amounts,” and A&O are defined as “those expenses that are correlated with claim counts or general loss
adjusting expenses.”

FINANCIAL REPORTING THROUGH THE LENS OF A PROPERTY/CASUALTY ACTUARY
Part III. SAP in the U.S.: Fundamental Aspects of the Annual Statement
157
TABLE 31
DCC A&O
Surveillance expenses
Fees
and expenses
of adjusters and settling agents
Fixed amounts for medical cost contai
nment
Litigation management expenses (e.g., audit of
bills)
LAE for
participation in
voluntary and involuntary
pools if reported by accident year
LAE for
participation in
voluntary and involuntary
pools if reported by calendar year
Fees
or
salaries fo
r:
• Appraisers
• Private investigators
• Hearing representatives
• Reinspectors
• Fraud investigators
(If working in defense of a claim)
Fees
and
salaries for:
• Appraisers
• Private investigators
• Hearing representatives
• Reinspectors
• Fraud investigators
(If working in the capacity of an adjuster)
Fees
or
salaries for
rehabilitation nurses, if not
included with losses
Attorney fees incurred owing duty to defend
, even
when other coverage does not exist
Attorney fees incurred in determination of
coverage, including litigation between the
reporting entity and the policyholder
Cost of engaging experts
Adjustment expenses arising from claims related
lawsuits, such as extra contractual obligations and
bad faith lawsuits
The NAIC Instructions to the Annual Statement indicate that DCC should be assigned to
accident year in accordance with the associated losses, while for A&O, “in any justifiable way,
… [t]he preferred way is to apportion these expenses in proportion to the number of claims
reported, closed, or outstanding each year.”
78
The following table illustrates this using
Fictitious’ commercial automobile liability line of business as an example. Fictitious allocates
its unpaid A&O for commercial automobile liability by applying the distribution of outstanding
claim counts by accident year to total unpaid A&O.
78
2018 NAIC Annual Statement Instructions Property/Casualty, page 226.

FINANCIAL REPORTING THROUGH THE LENS OF A PROPERTY/CASUALTY ACTUARY
Part III. SAP in the U.S.: Fundamental Aspects of the Annual Statement
158
TABLE 32
Years in Which
Premiums Were
Earned and Losses
Were Incurred
Number of
Claims
Outstanding
Direct and
Assumed
Distribution of
Outstanding
Claims
Direct and
Assumed
Adjusting &
Other Unpaid
1.
Prior
1
1%
2
2.
20
09
1
1
%
2
3.
20
10
1
1
%
2
4.
20
11
1
1%
2
5.
20
12
1
1%
2
6.
20
13
1
1
%
2
7.
20
14
2
3
%
4
8.
20
15
4
5%
8
9.
20
16
7
9
%
15
10.
201
7
13
1
8
%
2
7
11.
201
8
42
5
7
%
89
Totals
7
4
100%
156
Disclosure of the methodology used to allocate A&O by year is required in the interrogatories
to Schedule P.
LAE wasn’t always segregated between DCC and A&O. Prior to 1988, LAE were stated as
either allocated LAE (ALAE) and unallocated LAE (ULAE) in the Annual Statement. ALAE is
defined as claim expenses that can be specifically assigned to a particular claim, and ULAE as
those that cannot. ULAE is generally associated with the cost of administering claims. The
terms ALAE and ULAE are still used in practice. In fact, for reserving purposes many
companies perform actuarial analyses on an ALAE/ULAE basis.
Salvage and Subrogation
Most insurance policies require the insured to transfer the right to S&S recovery upon
payment of a covered claim to an insured. Salvage is typically received by insurance
companies in the case of automobile claims, when the vehicle incurs physical damage that is
beyond repair. Here the insurance company can sell usable parts of the vehicle, such as tires,
hubcaps and engine parts, to companies that salvage damaged vehicles.
Subrogation is typically received in the case of liability policies. For example, an insurance
carrier paying a claimant for liability associated with a product manufactured by an insured,
may in turn attempt to recover part or all of the amount paid to the claimant from the
company that made a part used in manufacturing the product.

FINANCIAL REPORTING THROUGH THE LENS OF A PROPERTY/CASUALTY ACTUARY
Part III. SAP in the U.S.: Fundamental Aspects of the Annual Statement
159
The paid loss figures provided in columns 4 (direct and assumed loss payments) and 5 (ceded
loss payments) are net of S&S received, and the unpaid losses provided in columns 13
through 16 are net of anticipated S&S, if the company reduces its reserves for anticipated
S&S. We typically find that when companies take credit for anticipated S&S, they do so in the
“bulk and IBNR”
79
amounts as opposed to the “case basis” reserves. It is difficult enough to
estimate reserves for known claims, let alone the amount that will be recovered for salvage
and/or subrogation on those claims.
For statutory reporting purposes, insurance companies can take credit for S&S received, as
well as that anticipated in its loss reserves. This means that companies can reduce their
reserves by estimates of recoveries that they expect to receive in the future.
The S&S figures displayed in columns 10 (received) and 23 (anticipated) are for informational
purposes only. As displayed in the formula for total net paid loss and LAE in column 11, S&S
received in column 10 is not subtracted from the paid loss and LAE amounts in columns 4
through 9, as they are already reduced by the S&S received. The following illustrates the
calculation on total net paid loss and LAE using data from the total line from Schedule P,
Part 1 – Summary of the 2018 Annual Statement for Fictitious Insurance Company.
TABLE 33
Data from 2018 Schedule P — Part 1 — Summary for Fictitious Insurance Company (000 omitted)
Column Item Amount Notes
4 Direct and assumed loss payments 116,277
5 Ceded loss payments 16,875
Net loss payments 99,402 = Column 4 — Column 5
6 Direct and assumed DCC payments 10,266
7 Ceded DCC payments 1,067
Net DCC payments 9,199 = Column 6 — Column 7
8 Direct and assumed A&O payments 10,830
9 Ceded A&O payments 417
Net A&O payments 10,413 = Column 8 — Column 9
11 Total net paid 119,014 = (Columns 4 + 6 + 8) — (Columns 5 + 7 + 9)
The S&S received figure in column 10 of Schedule P, Part 1 – Summary ($5,283 in total; 000
omitted) does not enter the above calculation, as the loss payments shown in columns 4 and 5
have already been reduced by this amount. The amount shown in column 11 is net of the S&S
received amount shown in column 10.
The same goes for the total net loss and LAE unpaid in column 24; anticipated S&S in column
23 is not subtracted from the case and IBNR figures in columns 13 through 22, as it is already
displayed net of anticipated S&S (if the company anticipates S&S in its recorded reserves).
79
Hereafter we will refer to “bulk and IBNR” simply as “IBNR.”

FINANCIAL REPORTING THROUGH THE LENS OF A PROPERTY/CASUALTY ACTUARY
Part III. SAP in the U.S.: Fundamental Aspects of the Annual Statement
160
The following provides a similar illustration using total unpaid amounts from Fictitious’ 2018
Schedule P, Part 1 – Summary.
TABLE 34
Data from 2018 Schedule P — Part 1 — Summary for Fictitious Insurance Company (000 omitted)
Column Item Amount Notes
13
Direct and assumed case basis losses
24,945
14
Ceded case basis losses
5,343
Net case basis losses
19,602 = Column 13 — Column 14
15
Direct and assumed IBNR losses
26,330
16
Ceded IBNR losses
4,038
Net IBNR losses
22,292 = Column 15 — Column 16
17
Direct and assumed case basis DCC
2,424
18
Ceded case basis DCC
258
Net case basis DCC
2,166 = Column 17 — Column 18
19
Direct and assumed IBNR DCC
5,401
20
Ceded IBNR DCC
499
Net IBNR DCC
4,902 = Column 19 — Column 20
21
Direct and assumed A&O unpaid
2,599
22
Ceded A&O unpaid
4
Net A&O unpaid
2,595 = Column 21 — Column 22
24
Total net losses and expenses unpaid
51,557 = (Columns 13 + 15 + 17 + 19 + 21) —
(Columns 14 + 16 + 18 + 20 + 22)
Column 23, which provides anticipated S&S ($1,363 in total; 000 omitted), is not included in
the above calculation as the amounts in loss columns are provided on a net basis.
Composition of Loss and LAE Reserve Figures Provided in Schedule P, Part 1
The case and IBNR reserves provided in Part 1 are net of tabular
80
discounting and gross of
non-tabular discounting, up until columns 32 and 33. The amount of non-tabular discount is
shown separately for loss and LAE in columns 32 and 33, respectively. For Fictitious, the
amounts shown in columns 32 and 33 are zero because the Company does not discount non-
tabular reserves. This is confirmed in part B of the Note to Financial Statements titled
“Discounting of Liabilities for Unpaid Losses or Unpaid Loss Adjustment Expenses” (Note 32B
in the 2018 Annual Statement).
The reserves shown on the Balance Sheet are provided in columns 35 and 36 for loss and
LAE, respectively. These figures are on a net of reinsurance basis, and net of all discounting,
80
Tabular reserves are defined on page 159 of the 2018 NAIC Annual Statement Instructions to Note 32 of the
Financial Statements as “indemnity reserves that are calculated using discounts determined with reference to
actuarial tables that incorporate interest and contingencies such as mortality, remarriage, inflation, or recovery
from disability applied to a reasonably determinable payment stream. This definition shall not include medical loss
reserves or any loss adjustment expense reserves.”

FINANCIAL REPORTING THROUGH THE LENS OF A PROPERTY/CASUALTY ACTUARY
Part III. SAP in the U.S.: Fundamental Aspects of the Annual Statement
161
if applicable. The sum of columns 35 and 36 will reconcile to the amount shown in column 24
reduced by the amount of discount shown in columns 32 and 33.
TABLE 35a
Data from 2018 Schedule P - Part 1 - Summary for Fictitious Insurance Company (000 omitted)
Column Item Amount Notes
Total net losses unpaid 41,894 Columns (13 + 15) - Columns (14 + 16)
Total net expenses unpaid 9,663 Columns (17 + 19 + 21) - Columns
(18 + 20 + 22)
24 Total net losses and expenses unpaid 51,557
32 Nontabular discount on losses XXX
33 Nontabular discount on loss expense XXX
Total nontabular discount XXX = Column 32 + Column 33
35 Net balance sheet loss reserves after
discount
41,894 Columns (13 + 15) - Columns
(14 + 16 + 32)
36 Net balance sheet loss expense
reserves after discount 9,663
Columns (17 + 19 + 21) - Columns
(18 + 20 + 22 + 33)
Total net losses and expenses unpaid
after discount
51,557 = Column 35 + Column 36
As we shall see in Part IV. Statutory Filings to Accompany the Annual Statement of this
publication, Schedule P, Part 1 – Summary provides the source of the recorded reserve
amounts that the Appointed Actuary opines upon in the Statement of Actuarial Opinion on
behalf of the insurance company. The Appointed Actuary opines on the loss and LAE reserve
amounts provided in columns 35 and 36, respectively, on a net of reinsurance basis, and
columns 13 plus 15 and columns 17 plus 19 plus 21, respectively, on a gross of reinsurance
basis. For Fictitious Insurance Company, the amounts shown in Exhibit A to the 2018
Statement of Actuarial Opinion, on which the Appointed Actuary has provided his opinion, are
as follows.

FINANCIAL REPORTING THROUGH THE LENS OF A PROPERTY/CASUALTY ACTUARY
Part III. SAP in the U.S.: Fundamental Aspects of the Annual Statement
162
TABLE 35b
Fictitious Insurance Company
2018 Statement of Actuarial Opinion
Loss and LAE Reserve Amounts Per Exhibit A
Loss and LAE Reserves: Amount
1. Reserve for Unpaid Losses (Liabilities, Surplus and Other Funds page, Col 1, Line 1) $41,894,000
2. Reserve for Unpaid LAE (Liabilities, Surplus and Other Funds page, Col 1, Line 3) $9,663,000
3. Reserve for Unpaid Losses – Direct and Assumed (Should equal Schedule P, Part 1,
Summary, Totals from Cols. 13 and 15, Line 12 * 1,000)
$51,275,000
4. Reserve for Unpaid LAE – Direct and Assumed (Should equal Schedule P, Part 1 —
Summary, Totals from Cols. 17, 19 and 21, Line 12 * 1,000)
$10,424,000
The figures shown in Schedule P are net of intercompany pooling. As suggested by the “XXX”
in column 34, Fictitious does not participate in any intercompany pooling arrangements. This
can be confirmed by a reading of the Notes to the Financial Statements titled “Intercompany
Pooling Arrangements” (Note 26 in the 2018 Annual Statement) for an insurance company.
We will discuss the effect of intercompany pooling on Schedule P reporting in a separate
section at the end of this chapter.
Incurred loss and LAE
The other items of interest in Schedule P, Part 1 are the total losses and loss expense
incurred columns (26 through 28) and resulting loss and LAE ratios columns (29 through 31).
The loss ratio columns are useful in assessing historical performance of the business
separately on a direct and assumed, ceded and net basis. For companies with non-
proportional reinsurance, the loss ratios will differ on a direct and net basis, and one can get a
sense if the company is paying relatively more for the reinsurance than the direct risk. Using
Fictitious as an example, we see that its incurred loss and LAE ratios differ on a direct plus
assumed, ceded and net of reinsurance basis.

FINANCIAL REPORTING THROUGH THE LENS OF A PROPERTY/CASUALTY ACTUARY
Part III. SAP in the U.S.: Fundamental Aspects of the Annual Statement
163
TABLE 36
Years in Which
Premiums
Loss and Loss Expense Percentage
(Incurred/Premiums Earned)
Were Earned
29
30
31
and Losses
Were
Incurred
Direct and
Assumed
Ceded
Net
1
Prior
2
200
9
66.9
71.9
65.6
3
20
10
57.7
44.3
61.3
4
20
11
52.9
52.6
53.0
5
20
12
61.8
106.5
54.3
6
20
13
52.1
53.4
51.9
7
20
14
54.9
52.2
55.2
8
20
15
66.5
65.0
66.6
9
20
16
62.8
62.3
62.8
10
201
7
68.2
52.5
69.5
11
201
8
78.9
72.6
79.4
Since 2014, the Company’s ceded loss and expense ratios have been lower than its direct plus
assumed ratios, thereby resulting in higher net loss ratios.
We should note that the amounts shown as “incurred” in columns 26 through 31 are on an
“ultimate incurred” basis. This is an important definitional distinction from “case incurred,”
and people often get the two confused, so we will walk through the definitions here.
The following equations are different ways of presenting ultimate incurreds:
Ultimate incurred loss
= Paid loss + case outstanding loss + IBNR loss
= Reported loss + IBNR loss
= Paid loss + unpaid loss
Paid losses represent those amounts paid by the insurance carrier. Case outstanding losses
represent the reserve for known claims, which is generally established by the company’s
claims administrators/adjusters. IBNR represents the reserve for claims Incurred But Not
Reported. IBNR includes a provision for:
• Development on known claims (“case development”)
• Pure IBNR, or those claims that are incurred but not yet reported to the insurance
carriers
• Reopened claims

FINANCIAL REPORTING THROUGH THE LENS OF A PROPERTY/CASUALTY ACTUARY
Part III. SAP in the U.S.: Fundamental Aspects of the Annual Statement
164
Case development is intended to cover upward and downward movements in the reserves
established by the adjusters as additional information becomes available about the claim. For
example, an adjuster may establish an initial reserve for a workers’ compensation claim based
on the initial injury reports from the employer or claimant’s doctor. However, subsequent
medical examinations may uncover that the injury is worse than originally expected, resulting
in additional cost and the need for an increase in the case reserve estimate to reserve the
claim to its ultimate value.
Reported loss is equal to the amount of paid plus case outstanding; it represents the dollar
value of loss known to the insurance company. The term “case incurred” is synonymous with
“reported” and represents the reported value of known cases.
Unpaid loss (or loss reserve) equals the amount of case outstanding plus IBNR reserves. It
represents the remaining amount expected to be paid on claims incurred by the insurance
company.
Actuaries often derive an ultimate loss estimate using triangular projection methods. The
amount unpaid (or loss reserve) can be derived using the above formulas by subtracting paid
losses from the ultimate estimate. Similarly, IBNR can be determined by subtracting reported
losses from the ultimate estimate.
Data used in actuarial projections can be derived from the information contained in Parts 2
through 4 of Schedule P, as will be discussed later in this chapter under the heading
“Actuarial Projections” within the section “SCHEDULE P – PARTS 2 THROUGH 4.”
Claim Count Information in Part 1
Certain line of business subparts of Part 1 also provide claim count information that is not
included in Part 1 – Summary because such information is not captured for all lines. Column
12 provides the number of claims reported, direct plus assumed. However, this column only
applies to certain lines and may be left blank for others, including the Summary. The
applicable lines are:
• Homeowners/Farmowners
• Private Passenger Auto Liability/Medical
• Commercial Auto Liability/Medical
• Workers’ Compensation
• Commercial Multiple Peril
• Medical Professional Liability
• Other Liability
• Auto Physical Damage
• Products Liability
• Warranty

FINANCIAL REPORTING THROUGH THE LENS OF A PROPERTY/CASUALTY ACTUARY
Part III. SAP in the U.S.: Fundamental Aspects of the Annual Statement
165
Further, column 25 provides the number of claims outstanding, direct plus assumed. This
column is completed for all lines except the nonproportional reinsurance assumed lines (Parts
N, O and P) and therefore the Summary.
For those lines, including the Summary, where claim count information is not included, the
corresponding columns are filled in with “XXX.”
Claim count data can be used to explore changes in ultimate loss and LAE or reserve levels or
to identify changes in claims settlement or reserving philosophy. We will provide more details
in our discussion of Schedule P, Part 5; however, for now we will show the meaningful
relationships that can be derived from Schedule P, Part 1 for Fictitious’
Homeowners/Farmowners lines of business (Part 1A).
First, it is generally assumed that net claim counts are equal to direct and assumed counts,
unless 100% of the business is ceded. The theory is that a direct claim results in a net claim,
even if the value of the net claim is $0. Therefore, all ratios that we show below, both on a
gross and net of reinsurance basis, are in relation to direct plus assumed counts.
Data from Schedule P, Part 1 can be used to calculate reported claim frequency, which is the
relationship of reported claim counts as of December 31, 2018, to earned premium.

FINANCIAL REPORTING THROUGH THE LENS OF A PROPERTY/CASUALTY ACTUARY
Part III. SAP in the U.S.: Fundamental Aspects of the Annual Statement
166
TABLE 37
Data From Schedule P — Part 1 — Homeowners & Farmowners
(000 omitted)
Average Reported Claim Frequency
Earned Premium
Number of
Average Reported Claim
Frequency
Years in Which
Premiums Were
Earned and Losses
Were Incurred
Direct and
Assumed
(Col. 1)
Net
(Col. 3)
Claims
Reported Direct
and Assumed
(Col. 12)
Di
rect and
Assumed
Counts/Earned
Premium
Direct and
Assumed
Counts/Net
Earned Premium
1 Prior XXX XXX XXX XXX XXX
2 2009 1,931 1,763 242 0.125 0.137
3 2010 2,251 2,084 253 0.113 0.122
4 2011 2,721 2,612 219 0.081 0.084
5 2012 3,123 3,000 217 0.069 0.072
6 2013 3,307 3,231 216 0.065 0.067
7 2014 3,609 3,507 194 0.054 0.055
8 2015 3,816 3,713 300 0.079 0.081
9 2016 4,003 3,895 296 0.074 0.076
10 2017 4,294 4,178 325 0.076 0.078
11 2018 4,550 4,445 427 0.094 0.096
12 Totals XXX XXX XXX XXX XXX
Table 37 can help us identify trends in claim frequency over the accident years. It is not a
complete picture because claim counts are on a reported basis, as opposed to ultimate.
However, for a short-tailed line of business such as homeowners, where losses are generally
reported within the year in which they are incurred (i.e., accident year), it is not a bad
approximation. Reported claim frequency appears to have increased in 2018 relative to both
gross and net earned premiums (e.g., frequency in 2018 of 0.094 per $000 of gross earned
premium versus 2017 of 0.076). This is most likely due to the high frequency of weather-
related and catastrophe claims incurred by the Company during 2018.
We note that the interpretation of frequency trends using earned premium can be misleading
due to the effect of rate changes. In our example, the increasing trend in Fictitious’ claim
frequency relative to earned premium may be partly attributed to soft market conditions in
addition to the number of catastrophe claims. Viewing claim frequency in terms of exposures
(e.g., house years for homeowners) would provide a clearer comparison and enhance the
ability to understand observed trends. Regardless, when investigating trends in claim
frequency, consideration should be made for changes over time in a company’s mix of
business (e.g., by types of exposures, geography), policy limits, reinsurance attachment
points and limits, as well as the way the company counts its claims.

FINANCIAL REPORTING THROUGH THE LENS OF A PROPERTY/CASUALTY ACTUARY
Part III. SAP in the U.S.: Fundamental Aspects of the Annual Statement
167
We can also compute the average value of reported claims by year, with each year evaluated
as of December 31, 2018, using Schedule P, Part 1 data, as shown below.
TABLE 38
Data From Schedule P — Part 1 — Homeowners & Farmowners
(000 omitted)
Average Reported Loss and DCC Severity
Reported Loss and DCC
Average Reported
Loss & DCC
Trend in Average
Reported $
Years in Which
Premiums
Were Earned
and Losses
Were Incurred
Direct and
Assumed
(Cols.
4 + 6 +
13 + 17)
Net
(Direct -
Ceded per
Cols.
5 + 7 +
14 + 18)
Number of
Claims
Reported
Direct and
Assumed
(Col. 12)
Direct and
Assumed
Reported
$/Counts
*1000
Net
Reported
$/Direct and
Assumed
Counts
*1000
Direct and
Assumed
Severity in
Accident
Year
20XX+1
divided
by 20xx
Net
Severity in
Accident
Year
20XX+1
divided
by 20xx
1 Prior 6 6 XXX XXX XXX XXX XXX
2 2009 1,021 942 242 4,219 3,893
3 2010 1,170 1,107 253 4,625 4,375 10% 12%
4 2011 1,450 1,381 219 6,621 6,306 43% 44%
5 2012 1,644 1,368 217 7,576 6,304 14% 0%
6 2013 1,350 1,349 216 6,250 6,245 -18% -1%
7 2014 1,407 1,405 194 7,253 7,242 16% 16%
8 2015 2,186 2,185 300 7,287 7,283 0% 1%
9 2016 2,214 2,208 296 7,480 7,459 3% 2%
10 2017 2,421 2,419 325 7,449 7,443 0% 0%
11 2018 3,372 3,369 427 7,897 7,890 6% 6%
12 Totals 18,241 17,739 XXX XXX XXX XXX XXX
We see that there hasn’t been much of a trend in the average cost per reported claim since
2015, until we get to 2018. The relatively flat trend from 2015 through 2017 is most likely
due to economic factors during the time period and general flattening of costs associated with
the repair and rebuilding of damaged properties. Similar to the increase in frequency in 2018,
the increase in claim costs is primarily attributed to an increase in the size of claims due to
the catastrophic events of 2018.
Here again, the comparison does not provide a complete picture because we are comparing
accident year data at different levels of maturity rather than evaluating the reported loss and
claims counts at their ultimate values. As we shall see, comparisons at the ultimate level can
be made by developing loss and DCC data provided in Parts 2 through 4 and claim count data
provided in Part 5.
Finally, we can also show the average cost of open claims as of December 31, 2018, using
Part 1 data, as provided in the Table 39:

FINANCIAL REPORTING THROUGH THE LENS OF A PROPERTY/CASUALTY ACTUARY
Part III. SAP in the U.S.: Fundamental Aspects of the Annual Statement
168
TABLE 39
Data From Schedule P — Part 1 — Homeowners & Farmowners
(000 omitted)
Average Case Outstanding Loss and DCC Severity
Case Basis Loss and DCC
Number of
Average Case O/S Loss & DCC
Years in Which
Premiums Were
Earned and Losses
Were Incurred
Direct and
Assumed
(Cols.
13 + 17)
Net (Direct –
Ceded per
Cols.
(14 + 18)
Claims
Outstanding
Direct and
Assumed
(Col. 25)
Direct and
Assumed
Case Basis
$/Counts
*1,000
Net
Case Basis
$/Direct and
Assumed Counts
*1,000
1 Prior 4 4 1 4,000 4,000
2 2009 0 0 1 0 0
3 2010 1 1 1 1,000 1,000
4 2011 2 2 1 2,000 2,000
5 2012 3 0 1 3,000 0
6 2013 8 8 1 8,000 8,000
7 2014 18 18 1 18,000 18,000
8 2015 40 40 1 40,000 40,000
9 2016 61 61 1 61,000 61,000
10 2017 124 124 3 41,333 41,333
11 2018 366 366 21 17,429 17,429
12 Totals 627 624 33 19,000 18,909
What we see in Table 39 is that the case outstanding reserve values and number of open
claims generally decrease with maturity (ignoring the prior years row, which is a compilation
of all prior years into one line). This makes sense, as eventually all claims will be closed and
the outstanding reserves will be $0.
81
We also see that the average case reserves increase in
maturity to a certain point, at which they decrease (ignoring the prior years row). This
suggests that the claims that remain open after 24 months (accident year 2017 in this case)
tend to be the larger dollar-valued claims. Put another way, the claims that cost the least tend
to be the easiest to administer and close, while the more costly claims take longer to settle
and pay out. This makes sense and is generally the case with property/casualty lines of
business. As time goes on, the average case reserve for homeowners claims tends to
decrease as the payments decline to closure.
The average case reserve values are lower on accident year 2018 relative to the immediately
prior periods. There are still small to midsized claims, in addition to the large dollar-value
claims, that remain open on the current accident year. These low-value claims suppress the
average.
81
Sometimes we will see a very high severity in a mature accident year, relative to the surrounding years and the
general decreasing trend with maturity. This will happen when there’s one or a small number of large dollar-valued
claims outstanding.

FINANCIAL REPORTING THROUGH THE LENS OF A PROPERTY/CASUALTY ACTUARY
Part III. SAP in the U.S.: Fundamental Aspects of the Annual Statement
169
SCHEDULE P — PARTS 2 THROUGH 4
Parts 2 through 4 provide a historical array of incurred, paid and IBNR loss and DCC,
respectively. The data is provided on a net of reinsurance and net of S&S (as applicable) basis.
Similar to Part 1 – Summary, the information in the Summary of Parts 2 through 4 is provided
for each of the past 10 years in which losses were incurred using the aforementioned
definitions depending on the type of policies (e.g., occurrence, claims-made, tail, or fidelity
and surety). The data is evaluated as of December 31 for each of the last 10 years.
Details are provided by line of business in the same breakdowns as in Part 1, with 10 accident
years shown for all lines except for those lines previously mentioned (e.g., Special Property,
Auto Physical Damage).
Discounting
Parts 2 through 4 of Schedule P are gross of all discounting. Therefore, the reserve amounts
shown in Parts 2 through 4 will not reconcile to those provided in Part 1 for companies that
discount nontabular reserves. The amount of discount is reported in the Notes to Financial
Statements, which enables reconciliation between Part 1 and Parts 2 through 4.
We can illustrate this using Schedule P, Parts 1, 2 and 3, Summary for Fictitious. As displayed
in Table 40b, the difference between the total net loss and DCC reserve reported in Schedule
P, Part 1 and the amount indicated by subtracting the figures in column 10 of Parts 2 and 3
provides the $1.365 million of reduction for tabular discount taken in Schedule P, Part 1.

FINANCIAL REPORTING THROUGH THE LENS OF A PROPERTY/CASUALTY ACTUARY
Part III. SAP in the U.S.: Fundamental Aspects of the Annual Statement
170
TABLE 40a
Data from 2018 Annual Statement for Fictitious Insurance Company
Years in Net Loss and DCC at Year End per Schedule P (000 omitted)
Which
Net Incurred
Net Paid
Net Unpaid
Losses Were
Part 2
Part 3
Part 2
—
Part 3
Incurred
Summary
Summary
Summar
y
Prior 46,022 30,210 15,812
2009 13,387 12,202 1,185
2010 13,540 12,238 1,302
2011 12,099 10,933 1,166
2012 12,321 10,919 1,402
2013 11,679 9,804 1,875
2014 12,895 10,503 2,392
2015 15,635 12,130 3,505
2016 14,745 10,332 4,413
2017 16,345 9,774 6,571
2018 19,364 8,660 10,704
Total 188,032 137,705 50,327
TABLE 40b
Net Unpaid Loss and DCC Reserves Per Schedule P — Part 1 — Summary
(000 omitted)
Column 24, Total Net Losses and Expenses Unpaid, Line 12, Totals: 51,557
Column 21, Direct and Assumed A&O Unpaid, Line 12, Totals: 2,599
Column 22, Ceded A&O Unpaid, Line 12, Totals: 4
Column 24 — (Column 21 — Column 22), Total Net Losses and DCC Unpaid: 48,962
Difference, Schedule P — Part 2 minus Part 3 and Schedule P — Part 1: 1,365
Note to Financial Statement on Discounting (in whole dollars)
Workers’ Compensation Cases: 495,000
Workers’ Compensation IBNR: 664,000
Other Liability Cases: 21,000
Other Liability IBNR: 15,000
Other Liability — Structured Payments IBNR: 170,000
Total Amount of Tabular Discount per Notes to Financial Statements: 1,365,000
Total Amount of Tabular Discount per Notes to Financial Statements,
divided by 1,000:
1,365
The amount of tabular discount included in Schedule P, Part 1 should reconcile to the amount
disclosed in the Note titled “Discounting of Liabilities for Unpaid Losses or Unpaid Loss
Adjustment Expenses” (Note 32 of the 2018 Annual Statement).

FINANCIAL REPORTING THROUGH THE LENS OF A PROPERTY/CASUALTY ACTUARY
Part III. SAP in the U.S.: Fundamental Aspects of the Annual Statement
171
Actuarial Projections
The format of Parts 2 through 4 is conducive for loss development projection methods used
by actuaries to assess a company’s reserve adequacy. However, actuaries tend to view the
data in a slightly different format than that presented in Parts 2 through 4. Shifting all of the
cells to the left so that each accident year starts with figures in column 1 transforms the data
into standard triangular format used in the loss development (or “chain ladder”) method. The
paid loss triangle comes directly from Schedule P, Part 3, and the case incurred loss triangle
can be derived by subtracting the IBNR in Part 4 from the incurreds in Part 2. The following
provides the calculation of the net case incurred (reported) triangle for Fictitious Insurance
Company.
TABLE 41a
Data from 2018 Annual Statement for Fictitious Insurance Company,
Schedule P — Part 2 — Summary
Incurred Net Losses and Defense and Cost Containment Expenses Reported at Year-End
(000 omitted)
Years in
Which
Losses Were
12
24
36
48
60
72
84
96
108
120
120
Incurred
Months
Months
Months
Months
Months
Months
Months
Mon
ths
Months
Months
Months
Prior XXX 35,994 38,360 41,784 43,601 44,861 45,378 45,947 45,884 45,845 46,022
2009 14,249 13,109 13,545 13,763 13,842 13,778 13,722 13,657 13,408 13,387
2010 14,434 13,651 14,040 13,994 14,032 14,042 13,748 13,617 13,540
2011 15,733 14,265 13,630 13,209 12,726 12,485 12,288 12,099
2012 15,982 14,733 14,195 13,210 12,768 12,445 12,321
2013 13,501 13,051 12,370 12,056 11,837 11,679
2014 13,938 13,629 13,303 13,265 12,895
2015 15,980 16,106 16,015 15,635
2016 14,917 14,851 14,745
2017 15,972 16,345
2018 19,364
2009 2010 2011 2012 2013 2014 2015 2016 2017 2018
Ending 50,243 65,903 84,713 101,651 114,561 127,581 141,626 154,924 169,543 188,032
Check: — — — — — — — — — —

FINANCIAL REPORTING THROUGH THE LENS OF A PROPERTY/CASUALTY ACTUARY
Part III. SAP in the U.S.: Fundamental Aspects of the Annual Statement
172
TABLE 41b
Data from 2018 Annual Statement for Fictitious Insurance Company,
Schedule P — Part 4 — Summary
Bulk and IBNR Net Losses and Defense and Cost Containment Expenses Reported at Year-End
(000 omitted)
Years in
Which
Losses Were
12
24
36
48
60
72
84
96
108
120
120
Incurred
Months
Months
Months
Months
Months
Months
Months
Months
Months
Months
Months
Prior XXX 17,126 14,330 13,764 12,807 12,285 11,632 10,529 9,752 8,907 8,088
2009 7,093 3,349 2,393 1,821 1,445 1,249 1,121 1,010 728 677
2010 7,149 3,583 2,544 1,799 1,479 1,370 1,016 814 713
2011 8,512 4,667 3,068 2,149 1,505 1,122 864 651
2012 7,337 4,644 3,505 2,131 1,522 1,030 876
2013 6,333 4,175 2,757 1,959 1,440 1,114
2014 6,022 3,756 2,640 2,018 1,459
2015 6,400 3,932 2,810 1,850
2016 6,008 3,544 2,511
2017 5,817 3,682
2018 6,422
2009 2010 2011 2012 2013 2014 2015 2016 2017 2018
Ending 24,219 24,828 28,252 29,176 29,574 30,211 29,569 28,961 27,972 28,043
Check: — — — — — — — — — —

FINANCIAL REPORTING THROUGH THE LENS OF A PROPERTY/CASUALTY ACTUARY
Part III. SAP in the U.S.: Fundamental Aspects of the Annual Statement
173
TABLE 41c
Difference between Schedule P — Part 2 — Summary and Part 4 — Summary
Case Incurred (Reported) Net Losses and Defense and Cost Containment Expenses
Reported at Year-End (000 omitted)
Years in
Which
Losses Were
12
24
36
48
60
72
84
96
108
120
120
Incurred
Months
Months
Months
Months
Months
Months
Months
Months
Months
Months
Months
Prior XXX 18,868 24,030 28,020 30,794 32,576 33,746 35,418 36,132 36,938 37,934
2009 7,156 9,760 11,152 11,942 12,397 12,529 12,601 12,647 12,680 12,710
2010 7,285 10,068 11,496 12,195 12,553 12,672 12,732 12,803 12,827
2011 7,221 9,598 10,562 11,060 11,221 11,363 11,424 11,448
2012 8,645 10,089 10,690 11,079 11,246 11,415 11,445
2013 7,168 8,876 9,613 10,097 10,397 10,565
2014 7,916 9,873 10,663 11,247 11,436
2015 9,580 12,174 13,205 13,785
2016 8,909 11,307 12,234
2017 10,155 12,663
2018 12,942
2009 2010 2011 2012 2013 2014 2015 2016 2017 2018
Ending 26,024 41,075 56,461 72,475 84,987 97,370 112,057 125,963 141,571 159,989
Check: — — — — — — — — — —
The “ending” rows simply provide the sum of each of the diagonals of data, thereby showing
the ending balances as of December 31 of the respective years.
The following provides the net paid loss and DCC triangle for Fictitious in the same triangular
format as shown above for reported loss and DCC.

FINANCIAL REPORTING THROUGH THE LENS OF A PROPERTY/CASUALTY ACTUARY
Part III. SAP in the U.S.: Fundamental Aspects of the Annual Statement
174
TABLE 42
Data from 2018 Annual Statement for Fictitious Insurance Company,
Schedule P — Part 3 — Summary
Cumulative Paid Net Losses and Defense and Cost Containment Expenses Reported at Year-End
(000 omitted)
Years in
Which
Losses Were
1
2
24
36
48
60
72
84
96
108
120
120
Incurred
Months
Months
Months
Months
Months
Months
Months
Months
Months
Months
Months
Prior XXX 000 9,061 13,830 18,110 21,281 23,728 26,341 27,752 29,108 30,210
2009 3,881 6,637 8,297 9,620 10,627 11,289 11,686 11,961 12,108 12,202
2010 4,121 7,109 9,011 10,142 11,035 11,552 11,847 12,070 12,238
2011 4,061 6,981 8,385 9,439 10,067 10,485 10,772 10,933
2012 4,376 7,649 8,904 9,766 10,329 10,724 10,919
2013 4,208 6,630 7,898 8,803 9,481 9,804
2014 4,591 7,325 8,821 9,846 10,503
2015 6,026 9,265 10,971 12,130
2016 5,626 8,740 10,332
2017 6,278 9,774
2018 8,660
2009 2010 2011 2012 2013 2014 2015 2016 2017 2018
Ending 3,881 19,819 33,297 48,098 62,292 75,616 90,661 104,889 120,098 137,705
Check: — — — — — — — — — —
Cautions When Using Schedule P to Assess Reserve Adequacy
Age-to-age loss development factors can be computed from the above triangles and
projections of ultimate loss and DCC made. However, we note several issues that we have
observed in practice with blindly using Schedule P data to assess the adequacy of an
insurance company’s reserves:
• While there are Instructions to the Annual Statement and third-party companies
provide software to assist insurers in preparing their Schedule P, certain allocations
and presentations are left up to interpretation of the person completing Schedule P.
• Internal pooling or reinsurance agreements may have an impact on the data set, and
that impact may not be readily apparent from Schedule P. For example, we have seen
pooling and reinsurance arrangements on a calendar year basis, as opposed to
accident or policy year, which distorts Schedule P since it is on a net (or after pool)
basis.

FINANCIAL REPORTING THROUGH THE LENS OF A PROPERTY/CASUALTY ACTUARY
Part III. SAP in the U.S.: Fundamental Aspects of the Annual Statement
175
• Schedule P contains experience from a company’s participation in voluntary and
involuntary pools and/or associations. Many underwriting pools report IBNR reserves
as case reserves, thereby distorting analytics and projections that use case base
reserves. Further, a company’s level of participation in the pool may have changed
over time.
• Schedule P only contains data for the last 10 accident years. Most casualty lines have
experienced loss development significantly longer than 10 years. Tail development
factors have to be estimated using other (external) sources, thereby increasing the
uncertainty of the projections.
• Commutations of reinsurance agreements can also distort an analysis of loss
development using Schedule P. Commutations represent an agreement between a
reinsurer and the reinsured to release all obligations under a reinsurance contract.
Typically, the reinsurer will pay a lump sum to the reinsured to extinguish all future
liabilities. The reinsurer’s case and IBNR reserves for the assumed contract will drop to
$0 upon paying the lump sum, while the ceding company’s net reserves should
increase since the ceding company can no longer take credit for the reinsurance and
“reassumes” the liability.
• The data triangles in Parts 2 through 4 include DCC expenses, potentially masking
trends in the loss or DCC components that may impact reserve needs.
• Analytics of the data, including a review of loss ratios, claim closure rates from Part 5
data, and average severities from data contained in Parts 2 through 5 can provide
observations regarding trends. However, the underlying cause for these trends, and
determination of their impact on future claim payments, can only be obtained through
discussion with company management, including interviews with management in the
pricing, underwriting and claims departments of the insurance company. Care should
be taken in the interpretation of these trends absent these discussions.
This list is not intended to be all-inclusive, but rather illustrate that care should be taken when
drawing conclusions about a company’s recorded reserves using Schedule P data alone.
As with any unpaid claim analysis, consideration should be made for changes in the
company’s business, including but not limited to retentions, claims settlement and reserving,
business mix, and underlying exposures. One of the Schedule P Interrogatories helps to
address this. Interrogatory 7 asks for further explanation regarding “any especially significant
events, coverage, retention or accounting changes that have occurred that must be
considered” in using Schedule P data to assess reserve adequacy.

FINANCIAL REPORTING THROUGH THE LENS OF A PROPERTY/CASUALTY ACTUARY
Part III. SAP in the U.S.: Fundamental Aspects of the Annual Statement
176
Hindsight Tests from Part 2
Part 2 represents ultimate incurred loss and DCC by accident year, recorded by the company
at the end of each of the last 10 years. Part 2 is particularly useful as it shows how the
company’s estimates of ultimate loss and DCC have fared over the past year and past two
years, as displayed in columns 11 and 12, respectively. The figures in column 11 provide the
change in ultimates over the past year (column 10 minus column 9) for all accident years
prior to the current accident year. Column 12 provides the change in ultimates over the past
two years (column 10 minus column 8) for all but the most recent two accident years.
The totals of the figures in columns 11 and 12 of Part 2 – Summary reconcile directly to the
current calendar year figures in column 1, lines 73 and 75 respectively, of the Five-Year
Historical Data exhibit within the Annual Statement. This is illustrated below for Fictitious
Insurance Company using the 2018 Annual Statement:
TABLE 43a
Data from 2018 Annual Statement for Fictitious Insurance Company
Schedule P — Part 2 — Summary (000 omitted)
Incurred Net Losses and Defense and Cost Containment Expenses
Reported at Year-end
Years in Which Development
Losses Were
One
Two
Incurred
Year
Year
Prior 177 138
2009 (21) (270)
2010 (77) (208)
2011 (189) (386)
2012 (124) (447)
2013 (158) (377)
2014 (370) (408)
2015 (380) (471)
2016 (106) (172)
2017 73 XXX
2018 XXX XXX
Total (875) (2,601)

FINANCIAL REPORTING THROUGH THE LENS OF A PROPERTY/CASUALTY ACTUARY
Part III. SAP in the U.S.: Fundamental Aspects of the Annual Statement
177
TABLE 43b
Five-Year Historical Data
(000 omitted)
2018
73. Development in estimated losses and loss expenses incurred prior
to current year (Schedule P, Part 2 — Summary, Line 12, Col. 11)
(875)
75. Development in estimated losses and loss expenses incurred
2 years before the current year and prior year (Schedule P,
Part 2—- Summary, Line 12, Col. 12)
(2,602)
While the absolute dollar amount of development is useful, it is valuable to view loss
development in relation to prior year reserves from which the development has emerged, as
well as on prior year surplus. For Fictitious, the $0.875 million of favorable development
represents less than 1.8% of prior year reserves totaling $49.445 million.
82
This means that,
with perfect hindsight, company management would have established reserves at $48.570
million ($49.445 million minus $0.875 million).
In Part IV, Statutory Fillings to Accompany the Annual Statement of this publication, we
discuss loss development as a ratio to surplus in further detail. This is a measure used by the
NAIC IRIS. For now, we will simply state that the $0.875 million of favorable development
represents less than 2.8% of policyholders’ surplus as of December 31, 2017, totaling
$31.608 million per column 2, line 37 of page 3 of the company’s 2018 Annual Statement.
A benefit of Part 2 is that it provides further insight into the observed development. The
development across all accident years may be negligible in aggregate; however, there may be
large increases or decreases in certain accident years or lines of business that warrant further
investigation.
As displayed above, Fictitious Insurance Company experienced favorable development in
2018, totaling $0.875 million on prior accident years. We see that the favorable development
on accident years 2009 through 2016 was somewhat offset by adverse development on the
prior accident years and the current accident year. This is where the actuary becomes a
detective to uncover the cause of the development.
• First, when we see adverse development in the prior accident years, we might first
look to the longer-tailed casualty lines as the culprit. Schedule P, Parts 2A through 2T
82
The net loss and DCC reserve of $49.4 million as of December 31, 2017, was computed by subtracting column 9
in Schedule P, Part 2 – Summary from column 9 in Schedule P, Part 3 – Summary (i.e., ultimate incurred minus
paid = unpaid). This was done to put the reserve amount on the same basis as the development amount, both of
which are undiscounted.

FINANCIAL REPORTING THROUGH THE LENS OF A PROPERTY/CASUALTY ACTUARY
Part III. SAP in the U.S.: Fundamental Aspects of the Annual Statement
178
provide net incurred loss and DCC development for each of the Schedule P lines of
business.
• Second, when we see adverse development on the “all prior” years, and then a
consistent trend of favorable development, we question the difference between the
exposures in the prior accident years versus those in the subsequent accident years.
Generally speaking, if the exposures underlying the prior years were consistent with
those in subsequent accident years, we would expect the adverse development to flow
through to the current years as well.
Once we identify the line of business, we could look to other areas of the Annual Statement
for guidance. For example, we can turn to the Notes to the Financial Statements, in particular
“Changes in Incurred Losses and Loss Adjustment Expenses” (Note 25 of the 2018 Annual
Statement) for further details. This Note provides management’s explanation for development
during the year. This may lead to review of additional notes, such as the note titled
“Asbestos/Environmental Reserves.” Oftentimes when we see adverse development isolated
to the prior years row, we look to see if it stems from asbestos and environmental (A&E)
claims activity.
83
While the line of business details in Parts 2A through 2T and Notes to the Financials provide
further insight into the source of loss development, they do not substitute the value of a
conversation with management of the insurance company. Management can provide further
color around the causes of development that pure numbers and notes cannot.
Prior Years Row
The calculation of the prior years row in Schedule P, Parts 2 through 4 can be a bit
cumbersome and confusing. The easiest way to explain the calculation is to start backwards,
providing the source of the prior years row for Schedule P, Part 4, and then work our way to
the details underlying the computation of Part 3, and then Part 2.
Prior Years Row – Part 4
The prior row in Part 4 is the most straightforward. It is simply the amount recorded by the
company for bulk and IBNR reserves for all accident years prior to the most recent 10. This
amount is determined by the company’s management and recorded in Part 4, as are the
amounts for all subsequent accident years.
One can reconcile the prior year balances at each evaluation date (i.e., across the columns) to
Schedule P, Part 1 of the current and prior year Annual Statements. Specifically, the amount
in column 15 (direct and assumed bulk + IBNR loss) minus 16 (ceded bulk + IBNR loss) plus 19
83
There is considerable uncertainty around the reserving for these types of claims due to the length of time
between exposure to manifestation of disease that gives rise to a claim. As such, the industry has experienced
considerable adverse development on reserves established for these claims over the years.

FINANCIAL REPORTING THROUGH THE LENS OF A PROPERTY/CASUALTY ACTUARY
Part III. SAP in the U.S.: Fundamental Aspects of the Annual Statement
179
(direct and assumed bulk + IBNR DCC) minus 20 (ceded bulk + IBNR DCC) of Schedule P,
Part 1, should equal the last number in column 10 of the prior row in Part 4 after adjusting for
any tabular discount. The following provides the calculation for Fictitious for 2018.
TABLE 44a
84
Sch P
Part 1
Amount
Prior years row
Column
$000s
Direct plus assumed bulk + IBNR loss 15 7,719
minus Ceded bulk + IBNR loss 16 1,416
plus direct plus assumed bulk + IBNR DCC 19 1,545
minus Ceded bulk + IBNR DCC 20 138
Net bulk + IBNR loss & DCC (net of tabular discount) 7,710
plus tabular discount 378
Net bulk + IBNR per Schedule P, Part 4 2018 8,088
The entire prior years row for Part 4 is provided below.
TABLE 44b
Bulk and IBNR Reserves on Net Losses and Defense Cost Containment Expenses
Reported at Year End (000 omitted)
Years in Which 1 2 3 4 5 6 7 8 9 10
Loss
es Were
Incurred
200
9
20
10
20
11
20
12
20
13
20
14
20
15
20
16
201
7
201
8
1. Prior 17,126 14,330 13,764 12,807 12,285 11,632 10,529 9,752 8,907 8,088
Prior Years Row – Part 3
As discussed previously, Part 3 provides cumulative paid loss and DCC for the latest 10
accident years, evaluated as of the end of each of those years. The prior row for Part 3 also
provides cumulative paid data; however, it does not start with the cumulative payments from
the first year that the company wrote business. Rather, it shows the payments that have
occurred on loss and DCC reserves as of the earliest evaluation date in the table, for all prior
accident years. Only payments made subsequent to the establishment of reserves as of the
earliest evaluation date in the table are shown. The 2018 Annual Statement for Fictitious
shows the prior row for Part 3 as the following.
84
The amount of tabular discount shown in the table is derived from the data in Fictitious’ Schedule P by taking the
bulk and IBNR in the prior years row from Part 4 minus the corresponding amount in Part 1.

FINANCIAL REPORTING THROUGH THE LENS OF A PROPERTY/CASUALTY ACTUARY
Part III. SAP in the U.S.: Fundamental Aspects of the Annual Statement
180
TABLE 45
Data from 2018 Annual Statement for Fictitious Insurance Company,
Schedule P — Part 3 — Summary
Cumulative Paid Net Losses and Defense and Cost Containment Expenses Reported at Year-End
(000 omitted)
Years in Which 1 2 3 4 5 6 7 8 9 10
Losses
Were
Incurred
200
9
20
10
20
11
20
12
20
13
20
14
20
15
20
16
201
7
201
8
1. Prior 000 9,061 13,830 18,110 21,281 23,728 26,341 27,752 29,108 30,210
The amount of $9,061 in column 2 represents net amounts paid in 2010 on net loss and DCC
reserves established by the Company as of December 31, 2009. The amount shown in
column 3 of $13,830 represents net amounts paid since year-end 2009 on net loss and LAE
reserves as of December 31, 2009, for all prior accident years. This continues all the way
until 2018, where the amount of $30,210 represents net amounts paid since year-end 2002
(through year-end 2018) on net loss and DCC reserves as of December 31, 2009, for all prior
accident years.
Only loss and DCC payments on reserves evaluated as of the earliest evaluation date
(December 31, 2009, in our example) are shown in the prior row. As a result, the balance in
the first column is always zero.
The calculation of the prior row in Part 3 is done by computing the incremental payments
subsequent to the earliest evaluation date (2009 in our example) for both the prior and first
subsequent accident year from the previous year’s Schedule P, Part 3 (2017 in our example).
The following provides this calculation using Part 3 from the 2017 Schedule P for Fictitious.
FINANCIAL REPORTING THROUGH THE LENS OF A PROPERTY/CASUALTY ACTUARY
Part III. SAP in the U.S.: Fundamental Aspects of the Annual Statement
181
TABLE 46
Data from 2017 Annual Statement for Fictitious Insurance Company,
Schedule P — Part 3 — Summary
Cumulative Paid Net Losses and Defense and Cost Containment Expenses Reported at Year-End
(000 omitted)
Years in Which 1 2 3 4 5 6 7 8 9 10
Losses Were
Incurred
200
8
200
9
20
10
20
11
20
12
20
13
20
14
20
15
20
16
201
7
Prior 000 8,238 14,960 18,129 21,279 23,817 25,840 28,163 29,380 30,519
2008 4,680 8,297 10,637 12,236 13,367 13,999 14,424 14,714 14,908 15,124
Calculation to Transition 2017 Part 3 Prior Row to 2011 Schedule P, Part 3
Current Column minus 2002 Column (Column 2) in 2010 Part 3
Years in Which 1 2 3 4 5 6 7 8 9 10
Losses Were
Incurred
200
8
200
9
20
10
20
11
20
12
20
13
20
14
20
15
20
16
201
7
Prior — 6,722 9,891 13,041 15,579 17,602 19,924 21,142 22,281
2008 — 2,340 3,939 5,070 5,702 6,127 6,417 6,611 6,828
Sum — 9,062 13,830 18,110 21,282 23,729 26,342 27,753 29,108
Data from 2018 Annual Statement for Fictitious Insurance Company,
Schedule P — Part 3 — Summary
Cumulative Paid Net Losses and Defense and Cost Containment Expenses Reported at Year-End
(000 omitted)
Years in Which 1 2 3 4 5 6 7 8 9 10
Losses Were
Incurred
200
9
20
10
20
11
20
12
20
13
20
14
20
15
20
16
201
7
201
8
Prior 000 9,061 13,830 18,110 21,281 23,728 26,341 27,752 29,108 30,210
As displayed above, the starting point for the calculation is the first two rows (prior and
2008) of Part 3 of the Fictitious 2017 Annual Statement. To calculate the prior years row for
Part 3 of Fictitious’ 2018 Annual Statement, the difference between amounts in each column
and the amounts in column 2 (2009) is computed. The prior and subsequent accident year
(2008) payments are then added together to produce the new prior row for Part 3 of the
Company’s 2018 Schedule P.
For example, cumulative net paid loss and DCC for column 2 (2010) are calculated as:
14,960 - 8,238 + 10,637 - 8,297 = 6,722 + 2,340 = 9,061
85
85
Minor differences due to rounding.

FINANCIAL REPORTING THROUGH THE LENS OF A PROPERTY/CASUALTY ACTUARY
Part III. SAP in the U.S.: Fundamental Aspects of the Annual Statement
182
As another example, the cumulative net paid loss and DCC for column 10 (2017) are
calculated as:
30,519 - 8,238 + 15,124 - 8,297 = 22,281 + 6,827 = 29,108
86
Prior Years Row – Part 2
As discussed previously, Part 2 provides cumulative ultimate incurred loss and DCC for the
latest 10 accident years, evaluated as of the end of each of those years. The prior row for
Part 2 also provides cumulative incurred data; however, it does not start with the cumulative
incurreds from the first year that the company wrote business. Rather, it starts with the net
loss and DCC reserves recorded by the Company as of the earliest evaluation date in the table
and includes this amount in column 1 of Schedule P, Part 2. For example, using Schedule P,
Parts 2 through 4, Summary, of the 2017 and 2018 Annual Statements for Fictitious
Insurance Company, we see that column 1 of the prior row in the 2011 Schedule P, Part 2, is
equal to the sum of the following amounts in column 2 (labeled “2009”) from the 2017
Annual Statement (USD in 000s).
TABLE 47
Data from 2017 Annual Statement 2009 Source
Case outstanding:
Schedule P, Part 2
—
Summary minus Part 3
—
Summary minus Part 4 — Summary
Prior Year
s
row
15,123
Line 1
200
8
row
3,745
Line 2
Sum
18,868
Bulk and IBNR:
Schedule P, Part 4
—
Summary
Prior Year
s
row
13,241
Line 1
200
8
row
3,886
Line 2
Sum
17,127
Total Unpaid:
Prior Year
s
row
28,365
Sum of above (case outstanding plus bulk an
d
IBNR)
200
8
row
7,630
Sum of above (case outstanding plus bulk and
IBNR)
Sum
35,995
Sum of above (case outstanding plus bulk and
IBNR)
2018 Annual Statement 2009 Source
Schedule P
—
Part 2
—
Summary, Prior Year
s
row
35,994
Line 1
86
Minor differences due to rounding.
FINANCIAL REPORTING THROUGH THE LENS OF A PROPERTY/CASUALTY ACTUARY
Part III. SAP in the U.S.: Fundamental Aspects of the Annual Statement
183
As displayed above, the amount in column 1 of the prior row in 2018 Schedule P, Part 2,
Summary is $35,994
87
.
Then, amounts in columns 2 and subsequent are equal to the ending reserves (case plus bulk
plus IBNR reserves) as of each corresponding year-end, plus the paids from the corresponding
prior row in Schedule P, Part 3. This is shown below for Fictitious:
TABLE 48
Data from 2018 Annual Statement for Fictitious Insurance Company,
Schedule P — Parts 2 through 4 — Summary
Prior Years Row, Net Loss & DCC
Years in Which 1 2 3 4 5 6 7 8 9 10
Losses Were
Incurred
200
9
20
10
20
11
20
12
20
13
20
14
20
15
20
16
201
7
201
8
Prior Paid from Part 3 000 9,061 13,830 18,110 21,281 23,728 26,341 27,752 29,108 30,210
Prior Case Outstanding
from Part 2 — Part 3 —
Part 4 XXX 14,969 14,190 12,684 11,295 10,018 9,077 8,380 7,830 7,724
Prior Bulk + IBNR
from
Part 4 17,126 14,330 13,764 12,807 12,285 11,632 10,529 9,752 8,907 8,088
Total Prior Unpaid
(Case + Bulk + IBNR) 29,299 27,954 25,491 23,580 21,650 19,606 18,132 16,737 15,812
Prior Incurred Loss =
Paid + Unpaid 35,994 38,360 41,784 43,601 44,861 45,378 45,947 45,884 45,845 46,022
Data from 2018 Annual Statement for Fictitious Insurance Company,
Schedule P — Part 2 — Summary
Incurred Net Losses and Defense and Cost Containment Expenses Reported at Year-End
(000 omitted)
Years in Which 1 2 3 4 5 6 7 8 9 10
Losses Were
Incurred
200
9
20
10
20
11
20
12
20
13
20
14
20
15
20
16
201
7
201
8
Prior 35,994 38,360 41,784 43,601 44,861 45,378 45,947 45,884 45,845 46,022
As displayed above, the case outstanding plus bulk plus IBNR reserves in the prior rows,
derived from Parts 2 through 4, are summed and then added to the corresponding cumulative
paids since 2010. This produces the “incurreds” on all prior accident years, as shown in
Schedule P, Part 2.
All the examples above are provided for the Summary of Schedule P, Parts 2 through 4, with
the calculation being the same for all of the lines of business in Parts 2A through 2T.
87
Minor differences due to rounding.

FINANCIAL REPORTING THROUGH THE LENS OF A PROPERTY/CASUALTY ACTUARY
Part III. SAP in the U.S.: Fundamental Aspects of the Annual Statement
184
Prior Years Row – Fictitious 2017 Annual Statement
For completion, and so that a reconciliation can be made of the amounts shown in Table 48
for 2017, the following provides the prior years and 2008 rows from Schedule P, Parts 2 and
4 from Fictitious’ 2017 Annual Statement.
TABLE 49
Data from 2017 Annual Statement for Fictitious Insurance Company,
Schedule P — Part 2 — Summary
Incurred Net Losses and Defense and Cost Containment Expenses Reported at Year-End
(000 omitted)
Years in Which 1 2 3 4 5 6 7 8 9 10
Losses Were
Incurred
200
8
200
9
20
10
20
11
20
12
20
13
20
14
20
15
20
16
201
7
Prior 31,760 36,602 38,321 41,474 43,475 44,539 45,113 45,607 45,605 45,706
2008 15,976 15,927 16,574 16,844 16,661 16,856 16,799 16,875 16,814 16,673
Data from 2017 Annual Statement for Fictitious Insurance Company,
Schedule P — Part 4 — Summary
Bulk and IBNR Net Losses and Defense and Cost Containment Expenses Reported at Year-End
(000 omitted)
Years in Which 1 2 3 4 5 6 7 8 9 10
Losses Were
Incurred
200
8
200
9
20
10
20
11
20
12
20
13
20
14
20
15
20
16
201
7
Prior 14,550 13,241 11,605 11,986 11,610 11,089 10,606 9,506 8,852 8,191
2008 7,241 3,885 2,725 1,778 1,197 1,196 1,026 1,023 900 716
As a reminder, Part 3 from Fictitious’ 2017 Annual Statement is shown in Table 46.
Claim Counts
Part 3 also provides the number of claims closed with and without loss payment in columns
11 and 12, respectively. These figures are provided only for those lines where this
information is provided in Part 5 (see below); these figures are not shown in the Summary.
SCHEDULE P — PART 5
Part 5 is provided in the following three sections, which are provided by accident year as of
the last 10 year-end evaluations on a direct plus assumed basis:
Section 1: Cumulative number of claims closed with loss payment
Section 2: Number of claims outstanding
Section 3: Cumulative number of claims reported

FINANCIAL REPORTING THROUGH THE LENS OF A PROPERTY/CASUALTY ACTUARY
Part III. SAP in the U.S.: Fundamental Aspects of the Annual Statement
185
Part 5 is provided for the following lines of business:
A - Homeowners/Farmowners
B - Private Passenger Auto Liability/Medical
C - Commercial Auto Liability/Medical
D - Workers’ Compensation
E – Commercial Multiple Peril
F – Section A
88
– Medical Professional Liability – Occurrence
F – Section B – Medical Professional Liability – Claims-Made
H – Section A – Other Liability – Occurrence
89
H – Section B – Other Liability – Claims-Made
R – Section A – Products Liability – Occurrence
R – Section B – Products Liability – Claims-Made
T – Warranty
No summary is provided for Part 5.
As noted, claim counts can assist the user in identifying trends or changes in the way claims
are settled and reserved. However, caution should be made in relying solely on the analytics
without discussion with company management, ideally management within the claims
department of the insurance company. There is inconsistency in the way that companies
record and report claim counts, and sole reliance on the data without confirmation with
management can be misleading. One known inconsistency is that some companies record
claims on a per-claim basis and others on a per-claimant basis. As we shall see later in this
chapter, the Interrogatories of Schedule P require that companies disclose the method for
recording claim counts.
Actuaries can derive many statistics from the data contained in Part 5. In the following
paragraphs we discuss the most common claim count statistics used by actuaries, as well as
other uses of Part 5.
Claim Closure Rates
These represent the ratio of closed claims to total reported claims. The ratio can be computed
as all closed claims, or only those claims closed with payment, divided by reported claims.
This relationship, in particular when viewed in the current accident year in comparison to
prior accident years during the first 12 months of a development, helps to identify any
changes in the rate at which claims are settled (closed).
88
The line of business section headings change from 1 and 2 to A and B in Part 5, due to the naming of Sections 1
through 3 herein.
89
Business reported as an aggregate write-in for other lines of business in the State Page is included here (either as
occurrence or claims-made, depending on the coverage written).

FINANCIAL REPORTING THROUGH THE LENS OF A PROPERTY/CASUALTY ACTUARY
Part III. SAP in the U.S.: Fundamental Aspects of the Annual Statement
186
We often hear claims adjusters say, “The best claim is a closed claim,” the reason being that
the longer a claim stays open, the greater the likelihood it will develop adversely and cost the
insurer more money. A closed claim significantly reduces that potential, in most cases to
zero.
90
Closed claims also benefit the insured by allowing the insured to receive medical
treatment, repair damaged property and recover from the loss. Claims departments look for
ways to increase claim settlement rates to achieve this mutual benefit.
Despite the benefits of such improvements, they can have an adverse effect on the projection
of unpaid claims if not explicitly taken into consideration. Take for example the situation
where a company has implemented a new strategy to increase claim settlement rates in the
current year. This will result in higher than average claim payments being made in the current
year and will cause the paid loss development factors at the latest evaluation date (i.e., last
diagonal) to be higher than in prior evaluation dates along the diagonals. Giving weight to this
higher factor in the application of loss development factors to paid losses (that are
themselves higher than normal) will result in the over-projecting of ultimate losses and
therefore the overestimate of unpaids.
Similarly, a claims department may also experience a reduction in claim settlement rates for
numerous reasons, such as reductions in staffing levels, growth in a book without a
commensurate increase in claim staff, or influx of claims resulting from the occurrence of a
catastrophe, among others. A reduction in claim settlement rates could result in
underestimating unpaid claims because the last diagonal of loss development factors and
current evaluation of paid losses are suppressed relative to prior years.
A review of claim closure rates will help to identify these trends, thereby enabling the actuary
to consider the impact on the analysis of unpaid claims.
Table 50 shows the triangle of claim closure rates for Fictitious’ homeowners line of business.
90
There is always the chance that a claim could reopen.

FINANCIAL REPORTING THROUGH THE LENS OF A PROPERTY/CASUALTY ACTUARY
Part III. SAP in the U.S.: Fundamental Aspects of the Annual Statement
187
TABLE 50
Data from 2018 Annual Statement for Fictitious Insurance Company,
Data from Schedule P — Part 5A — Homeowners/Farmowners
Calculation of Claim Closure Rate (Total Claims Closed from Section 3 minus Section 2,
divided by Total Reported Claim Counts from Section 3)
Years in
Which
Losses Were
12
24
36
48
60
72
84
96
108
120
Incurred
Months
Months
Months
Months
Months
Mon
ths
Months
Months
Months
Months
2009 90.7% 97.9% 98.8% 98.8% 99.2% 99.6% 99.6% 99.6% 99.6% 99.6%
2010 91.9% 98.4% 99.2% 99.6% 99.6% 99.6% 99.6% 99.6% 99.6%
2011 88.9% 97.7% 99.1% 99.5% 99.5% 99.5% 99.5% 99.5%
2012 87.7% 98.1% 98.6% 99.5% 99.5% 99.5% 99.5%
2013 92.9% 98.6% 99.5% 99.5% 99.5% 99.5%
2014 91.4% 98.4% 99.0% 99.5% 99.5%
2015 92.8% 98.7% 99.3% 99.7%
2016 92.7% 99.0% 99.7%
2017 93.6% 99.1%
2018 95.1%
The above was computed by taking total reported counts in Section 3 of Part 5A and
subtracting the open counts in Section 2 to compute a triangle of closed counts. We then took
the resulting closed count triangle and divided by the reported count triangle in Section 3.
Depending on the line of business, generally, only the first two to three columns are relevant
to the actuary, as claim adjusters tend to have the biggest impact on claim settlement in the
first couple of years of development. After that, it is often difficult to have a widespread
effect on the open claims. For a short-tailed line of business such as homeowners, actuaries
will tend to focus on the first 12 months in the above triangle. The following provides a
graphic depiction of the first 12 months of settlement rates.
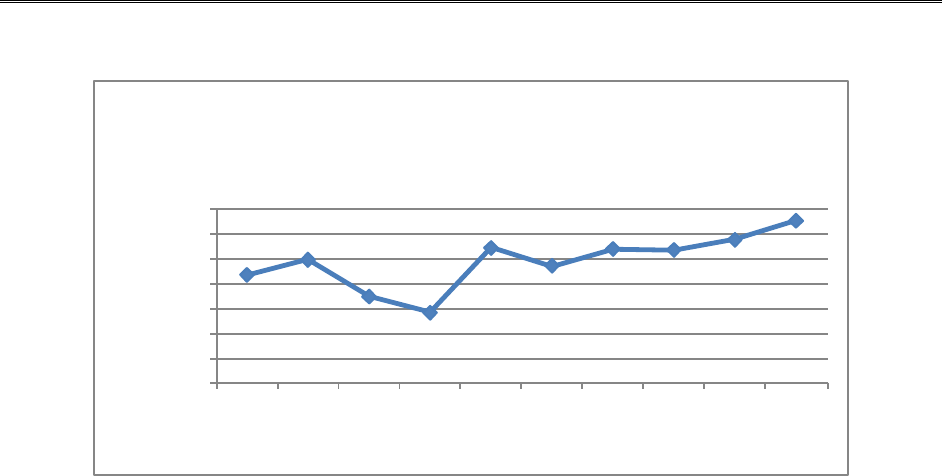
FINANCIAL REPORTING THROUGH THE LENS OF A PROPERTY/CASUALTY ACTUARY
Part III. SAP in the U.S.: Fundamental Aspects of the Annual Statement
188
TABLE 51
From the chart we see a slight uptick in the claim settlement rates since 2016. While the
change is relatively benign, it would be important to talk to Fictitious’ management to see if
there are any internal or external changes than might impact the rate at which homeowners
claims are being settled. Additionally, it would be interesting to inquire as to the changes that
occurred in 2011 and 2012, as there appears to have been a large drop in the rate at which
claims were being closed. If, for example, there was an uptick in weather-related claims
during 2012, it may be that Fictitious’ claims department had some difficulties keeping pace
with the large number of claims reported during 2012.
Closed With Pay (CWP) Ratios
These represent the ratio of CWP claims to total closed claims. Companies may experience
changes in the rate that claims are closed without payment. It is important for the actuary to
understand the implications of changes in CWP rates on the unpaid claim analysis. While an
increasing trend in CWP rates is generally a good sign, it may result in increases in reopened
claims in the future or have other effects that are not easily discernible in the loss data.
Table 52 provides the ratio of claims closed without payment to total closed claims for
Fictitious. While we can show the ratio of CWPs as well, which is simply one minus the ratios
shown within Table 52, we thought the ratios of closed without pay more clearly highlights
some changes in the Company’s experience.
82.0%
84.0%
86.0%
88.0%
90.0%
92.0%
94.0%
96.0%
2009 2010 2011 2012 2013 2014 2015 2016 2017 2018
Ratio of closed to reported claims
Accident Year
Homeowners Claim Closure Rates at 12
months of Development

FINANCIAL REPORTING THROUGH THE LENS OF A PROPERTY/CASUALTY ACTUARY
Part III. SAP in the U.S.: Fundamental Aspects of the Annual Statement
189
TABLE 52
Data from 2018 Annual Statement for Fictitious Insurance Company,
Data from Schedule P — Part 5A — Homeowners/Farmowners
Ratio of Claims Closed Without Payment to Total Closed Claims
Years in
Which
Losses Were
12
24
36
48
60
72
84
9
6
108
120
120
Incurred
Months
Months
Months
Months
Months
Months
Months
Months
Months
Months
Months
2009 1% 16% 15% 15% 15% 15% 16% 16% 16% 16%
2010 14% 14% 14% 14% 14% 13% 13% 13% 13%
2011 16% 16% 16% 16% 16% 16% 16% 16%
2012 13% 13% 13% 13% 13% 13% 12%
2013 9% 9% 9% 9% 9% 9%
2014 8% 9% 8% 8% 8%
2015 8% 8% 8% 8%
2016 9% 9% 9%
2017 8% 8%
2018
6%
As displayed above, there appears to have been a drop in claims closed without pay between
the 2011 and 2013 accident years from around the 15% level at 12 months of development
to about the 8% level for accident years 2013 through 2017 at 12 months. There seems to be
a further decline in accident year 2018, although to a much lesser degree. Inquiries would
have to be made of company management to understand the cause for these trends and
ascertain the impact on future loss and LAE development.
Claim Frequency
The rate of claim frequency can be determined using Schedule P data by dividing claim counts
in Part 5 by earned premiums in Part 1. This can be useful in identifying changes in the rate
claims are closed and reported relative to the exposure. However, we note that the exposure
here is influenced by rate changes. Therefore, similar to loss ratios, these rates can go up or
down depending on pricing changes. Schedule P does not provide the raw exposure base
(e.g., home years for homeowners, car years for auto, payroll or employee count for workers’
compensation). As a result, one cannot identify pure loss cost trends using this data without
making manual adjustments for changes in rate.
Average Claim Severities
In addition to providing statistics based solely on counts, the actuary can also analyze
severities using the loss data from Parts 2 through 4 and the count data in Part 5. The
actuary can analyze the following:

FINANCIAL REPORTING THROUGH THE LENS OF A PROPERTY/CASUALTY ACTUARY
Part III. SAP in the U.S.: Fundamental Aspects of the Annual Statement
190
• Average closed claim severities, which are computed as the ratio of net paid loss and
DCC to direct plus assumed claims closed with payment (or total closed claim counts).
The numerator in the equation comes from Schedule P, Part 3, and the denominator
comes from Schedule P, Part 5, Section 1 (or Section 3 minus Section 2 for total
closed claim counts).
• Average case outstanding severities, which are computed as the ratio of net case
outstanding loss and DCC to direct plus assumed open counts. The numerator in the
equation comes from Schedule P, Part 2 minus Part 3 minus Part 4, and the
denominator comes from Schedule P, Part 5, Section 2.
• Average reported claim severities, which are computed as the ratio of net reported
loss and DCC to direct plus assumed reported counts. The numerator in the equation
comes from Schedule P, Part 2 minus Part 4, and the denominator comes from
Schedule P, Part 5, Section 3.
The above enables the actuary to identify trends in the cost of insurance claims. Such trends
may be inflationary, a result of law changes, attributed to one-time catastrophic claims, due
to changes in deductibles or retentions, or caused by internal factors, among others.
As with claim counts, actuaries generally look for changes in the first few years of
development, as these changes tend to have the biggest impact on reserve levels.
A review of average case reserves is particularly useful to the reserving actuary. Changes in
case reserve levels may be a sign that the company has strengthened or weakened its case
reserves. For example, if we were to compute a triangle of average case outstanding
severities and observe a decrease along the last diagonal relative to the prior diagonal, then
that may be a sign that the company has weakened its case reserves.
91
Of course, this
observation would warrant discussion with the company’s claims department. However,
assuming there was a weakening in case reserves, use of the reported loss development
method to project unpaid loss, without adjustment to reflect the weakening, may understate
the reserve need.
To be more specific, loss development methods assume that the past is predictive of the
future. When a company weakens reserves, the reported losses are at a lower level than they
had been at the past. Therefore, application of prior average loss development factors to
current, lower loss amounts, will tend to understate the ultimate loss estimate and therefore
the reserve need. The effect is similar to what happens to development methods using paid
91
The last diagonal represents average case outstanding reserves corresponding to the accident years in the left
most column, as of the current evaluation date, which is December 31, 2018 for Fictitious. The prior diagonal is
one year prior to the current evaluation (i.e., December 31, 2017 for Fictitious).

FINANCIAL REPORTING THROUGH THE LENS OF A PROPERTY/CASUALTY ACTUARY
Part III. SAP in the U.S.: Fundamental Aspects of the Annual Statement
191
loss data when there has been a change in the rate claims are being closed. A decrease in
claim settlement rates (i.e., “slowdown”) along the last diagonal will result in an
understatement of the reserve need absent adjustment to the paid loss triangle or paid loss
development methods. The opposite can happen when there has been a strengthening in case
reserves or a speed-up in claim settlement. While not the topic of this publication, there are
loss reserving methods that explicitly adjust for changes in case reserve adequacy and claim
closure rates, such as those described in the Berquist-Sherman paper.
92
Table 53 provides the average case outstanding reserves for Fictitious’ homeowners line of
business:
TABLE 53
Data from 2018 Annual Statement for Fictitious Insurance Company,
Data from Schedule P — Parts 2 through 5 — Homeowners/Farmowners
Average Net Case Outstanding Loss and DCC Severities
(Net Case Outstanding Loss and DCC / Open Claim Counts)
Years in
Which
Losses Were
12
24
36
48
60
72
84
96
108
120
120
Incurred
Months
Months
Months
Months
Months
Months
Months
Months
Months
Months
Months
2009 7,350 10,800 10,677 6,000 5,000 7,000 5,000 2,000 1,000 —
2010 9,053 16,750 19,000 21,000 12,000 7,000 5,000 2,000 1,000
2011 8,636 18,600 23,500 25,000 14,000 9,000 5,000 2,000
2012 9,360 13,750 8,667 9,000 11,000 12,000 —
2013 14,571 30,333 45,000 26,000 15,000 8,000
2014 18,333 37,000 30,500 34,000 18,000
2015 14,684 32,250 37,500 40,000
2016 15,789 42,000 61,000
2017 16,789 41,333
2018 17,429
200
9
20
10
20
11
20
12
20
13
20
14
20
15
20
16
201
7
201
8
Ending 10,966 10,844 11,243 14,833 17,920 17,071 17,774 19,194 18,909
Annual Trend -1% 4% 32% 21% -5% 4% 8% -1%
The bottom row shows the trend across all accident years combined, over each evaluation
year. We see that in 2016 and 2017, average reserve levels increased by about 4% and 8%,
respectively. However, in 2018, reserve levels decreased by 1%. As a result of this decline,
the actuary may see ultimate loss and DCC estimates based on reported methods coming in
lower than the ultimate loss and DCC estimates based on paid methods.
92
Berquist, J.R.; and Sherman, R.E., “Loss Reserve Adequacy Testing: A Comprehensive, Systematic Approach,”
Proceedings of the Casualty Actuarial Society (PCAS) LXIV, 1977, pp.123-184.
FINANCIAL REPORTING THROUGH THE LENS OF A PROPERTY/CASUALTY ACTUARY
Part III. SAP in the U.S.: Fundamental Aspects of the Annual Statement
192
Looking down the column at the first 12 months, we see a significant increase in case reserve
between 2012 and 2013. This is a bit more obvious graphically. The following provides the
change in average case reserves, from one accident year to the next, going down the 12-
month development column.
TABLE 54
A large spike is seen in 2013. The approximate 56% increase was computed by taking the
average case outstanding severity for accident year 2013 of $14,571 and dividing by the
average for accident year 2012 of $9,360 to obtain the year-over-year change of 1.56
(+56%).
Despite the large increase in 2013 and subsequent sharp decline in 2015, the year-over-year
trend rates in the first 12 months of development appear to have been on a slight decline
from 8% to 4% between 2016 and 2018.
As previously mentioned, the value of these analytics is to identify trends and generate
discussion with management so that the actuary can appropriately consider them in the
analysis of unpaid claims.
Reasonableness Tests
In addition to the raw trends, actuaries also use Part 5 data to provide checks on the
reasonableness of unpaid claim estimates. For example, actuaries can compute the following
statistics and compare the results to see if the trends across the accident years are in
alignment with what they expect:
-30%
-20%
-10%
0%
10%
20%
30%
40%
50%
60%
2010 2011 2012 2013 2014 2015 2016 2017 2018
Percent change year-over-year
Accident Year
Trend in Homeowners Average
Outstanding at 12 months

FINANCIAL REPORTING THROUGH THE LENS OF A PROPERTY/CASUALTY ACTUARY
Part III. SAP in the U.S.: Fundamental Aspects of the Annual Statement
193
• Average claim frequency — the ratio of the ultimate claim count estimate by accident
year to the corresponding earned premium
• Average ultimate severity — the ratio of the ultimate loss and DCC estimate by
accident year to the corresponding estimate of ultimate claim counts
• Average unpaid claim severity — the ratio of the unpaid loss and DCC estimate by
accident year to the corresponding estimate of unpaid claims
The above can be computed using direct plus assumed loss and DCC estimates in addition to
the net estimates.
Uses of Part 5 in Estimating Unpaid Claims
Before turning to Part 6, we should add that actuaries also use Part 5 for purposes of
projecting ultimate loss and DCC estimates. These methods are referred to as “counts and
averages” methods. Projections are made by developing average paid and reported loss
severities to ultimate and applying them to estimates of ultimate claim counts using closed
and reported claims count development methods. These methods can be valuable when
adjusting for observed trends in each of their specific components.
SCHEDULE P — PART 6
Part 6 provides cumulative premiums earned as of December 31 for each of the last 10
calendar years. The first year of report includes premiums earned in the calendar year.
Moving left to right, subsequent years show premiums earned after positive or negative
adjustments from premium audits, retrospectively rated policies, lags in reporting or
accounting for premiums, among others. Part 6 provides the information needed to develop
earned premium to its ultimate amount using methods similar to those used to develop
ultimate loss and DCC (i.e., using traditional, triangular development methods). Part 6 is
provided for the following lines of business, as these lines tend to be the ones subject to the
aforementioned adjustments:
C – Commercial Auto Liability/Medical
D – Workers’ Compensation
E – Commercial Multiple Peril
H – Section A – Other Liability – Occurrence
93
H – Section B – Other Liability – Claims-Made
M - International
93
Business reported as an aggregate write-in for other lines of business in the State Page is included here (either as
occurrence or claims-made, depending on the coverage written).

FINANCIAL REPORTING THROUGH THE LENS OF A PROPERTY/CASUALTY ACTUARY
Part III. SAP in the U.S.: Fundamental Aspects of the Annual Statement
194
N – Reinsurance – Nonproportional Assumed Property
94
O – Reinsurance – Nonproportional Assumed Liability
95
P – Reinsurance – Nonproportional Assumed Financial Lines
96
R – Section A – Products Liability – Occurrence
R – Section B – Products Liability – Claims-Made
The premium displayed in Part 1 of Schedule P is that which is earned during each specified
calendar year; it is not updated for subsequent adjustments to the specified exposure year
premium. It is equal to the left-most diagonal in Part 6 plus adjustments that come through
during the specified calendar year to premiums on prior exposure years. Adjustments made
after the first year of report are included in the appropriate column of Part 6.
Workers’ compensation provides a good example of a line that is subject to premium
adjustment. At inception, the premium charged for a workers’ compensation policy is
determined by applying a rate to an estimate of the payroll (exposure) for the policy term. At
the end of the year, or shortly thereafter, the actual payroll is known. The insurance carrier,
however, has determined its premium earnings on the basis of the estimated premium. As a
result, the premium figure will change from its initial amount, and this change is recorded in
Part 6.
Additionally, the exposure base used to determine the premium can be subject to audit by the
insurance carrier. For example, an insurance company can verify that payroll amounts used in
determining an insured’s workers compensation premium, or revenue figures used in
computing an insured’s general liability premium, are accurate and complete. Differences
uncovered through these audits will emerge as premium development in Part 6.
The one area where we tend to see the most development on earned premium is
retrospectively rated insurance policies. Under these policies, the insured is charged a base
premium that is adjusted over time based on the insured’s loss experience based on a
formula. The formula incorporates tax multipliers and expense factors and typically imposes a
minimum and maximum premium amount.
Insurance companies record the claim experience associated with retrospectively rated
insurance policies within Schedule P, and the loss reserve estimates typically include a
provision for these claims. Without adjustment for the additional premium income expected
under these policies, a company’s surplus would be understated. This adjustment comes in as
94
Property includes fire, allied, ocean marine, inland marine, earthquake, group, credit and other A&H, auto
physical damage, boiler and machinery, burglary and theft and international property.
95
Liability includes farmowners, homeowners and commercial multiperil; medical professional liability workers’
compensation; other liability; products liability; auto liability; aircraft (all peril); and international liability.
96
Financial includes financial guaranty, fidelity, surety, credit and international financial.

FINANCIAL REPORTING THROUGH THE LENS OF A PROPERTY/CASUALTY ACTUARY
Part III. SAP in the U.S.: Fundamental Aspects of the Annual Statement
195
an asset on line 15.3 of page 2 of the Annual Statement titled “Accrued Retrospective
premium.”
Estimates of future premium can be determined by developing the earned premiums in Part 6
using development methods. However, as with reliance on the rest of Schedule P for
projection purposes, exclusive reliance on Part 6 should not be made without having a good
understanding of its contents.
SCHEDULE P — PART 7
Part 7 is optional and completed only by those companies using the loss sensitive adjustment
in the RBC calculation. It provides premium and loss information on loss sensitive contracts. It
is broken into two parts: A for Primary Contracts (i.e., direct written business) and B for
Reinsurance Contracts (i.e., assumed business). Parts A and B each have the same five
sections:
• Section 1 provides net loss and LAE unpaid and net written premium on loss sensitive
contracts, relative to all contracts written by the company, for each Schedule P line of
business in total.
• Section 2 provides incurred loss and DCC reported at year-end on loss sensitive
contracts in the same format as Schedule P, Part 2.
• Section 3 provides loss and DCC IBNR at year-end on loss sensitive contracts in the
same format as Schedule P, Part 4.
• Section 4 provides net earned premiums reported at year-end on loss sensitive
contracts in the same format as Schedule P, Part 6.
• Section 5 provides net reserves for premium adjustments and accrued retrospective
premiums for each of the last 10 years in which the policies were issued, evaluated at
each of the last 10 years.
The information provided in Part 7 is on a policy year basis.
As noted, the primary use of this exhibit is for RBC purposes. The Reserve RBC and Written
Premium RBC are adjusted to reflect the fact that loss experience under loss sensitive
contracts is shared in whole or in part with the insured. As such, the risk of adverse loss
development is also shared with the insured. The insurance company receives a discount to
its RBC reserve charge to reflect this reduction in risk. This discount is computed separately
by line of business. Columns 3 and 6 of Schedules A and B provide the percentage of loss and
LAE reserves and written premiums by line of business for loss sensitive contracts. Column 3
provides the distribution of reserves, and column 6 provides the distribution of net written
premium.
Examples of how this information is used in computing RBC are contained in Part IV. Statutory
Filings to Accompany the Annual Statement of this publication.

FINANCIAL REPORTING THROUGH THE LENS OF A PROPERTY/CASUALTY ACTUARY
Part III. SAP in the U.S.: Fundamental Aspects of the Annual Statement
196
SCHEDULE P INTERROGATORIES
The Schedule P Interrogatories are a series of seven questions that the insurance company is
required to answer to provide further insight into the information reported in Schedule P. We
will briefly discuss those interrogatories that are most widely referred to by property/casualty
actuaries.
Question 1 pertains to extended reporting endorsements (EREs) arising from death, disability
or retirement (DDR). EREs essentially turn a medical professional liability claims-made policy
into an occurrence policy upon the policyholder’s death, disability or retirement. In the
1990s, DDR endorsements were issued for free and known as “free tail coverage” as a
marketing effort by medical insurers to attract physicians. Many such DDR extended reporting
period endorsements are still offered for free.
Question 1 has six parts, the first of which pertains to whether the company issues such
endorsements for free or at a reduced rate. The remaining five parts serve to identify where
and how the company reports the DDR reserve: as unearned premium or loss reserve, claims-
made or occurrence, etc. The main point is to make sure these policies have been reserved
for somewhere in the company’s financial statements, either as losses or unearned premium.
Question 2 asks whether LAE are reported as DCC and A&O as per the definitional change
effective January 1, 1998. This is relevant to the actuary or other user who may be relying
on Schedule P data to perform reserve adequacy tests.
Question 4 requires disclosure on whether the company’s recorded loss and LAE reserves are
net of non-tabular discount and reminds the preparer of the Annual Statement that:
• Disclosure of non-tabular discount must be included in the Notes to Financial
Statements.
• Discounting is only allowed if the company has permission from its state insurance
regulator.
• Schedule P must be prepared gross of non-tabular discounts, with the amount of
discount reported in Schedule P – Part 1, Columns 32 and 33.
• Support for the amount of discount must be available for regulatory review upon
request.
In question 6, the company is required to indicate whether the company reports claim counts
on a per-claim or per-claimant basis in Schedule P. This, along with whether the reporting
convention has changed over time, is relevant in interpreting trends in claim frequency and
severity. It is also relevant when assessing reserve adequacy using counts and averages
(frequency and severity) methods.
Question 7 is the most important and aligns most directly with the use of Schedule P. It asks if
there are any changes or if there is anything special that the user should be aware of if the

FINANCIAL REPORTING THROUGH THE LENS OF A PROPERTY/CASUALTY ACTUARY
Part III. SAP in the U.S.: Fundamental Aspects of the Annual Statement
197
user decides to rely on the data provided in Schedule P to assess the adequacy of the
recorded loss and LAE reserves. If the answer is yes, disclosure of such is required.
INTERCOMPANY POOLING AND SCHEDULE P
It is important to know that intercompany pooling differs from intercompany reinsurance.
According to SSAP No. 63, “Intercompany pooling arrangements involve establishment of a
conventional quota share reinsurance agreement under which all of the pooled business is
ceded to the lead entity and then retroceded back to the pool participants in accordance with
their stipulated shares.“
97
Under intercompany pooling, business underwritten by affiliated
insurance companies is consolidated by the “lead” company and the premiums, losses and
related expenses are shared based on a fixed and predetermined percentage per the
agreement.
Intercompany reinsurance refers to a transaction whereby one company (the reinsurer)
agrees to indemnify the other (the ceding company) against all or part of the loss that the
latter may sustain under the policies that it has issued. Intercompany reinsurance is
accounted for in the same way as third-party reinsurance, subject of course to statutory
accounting rules. Very broadly, cessions to affiliated reinsurers under straight reinsurance
agreements serve to reduce gross premiums, losses and related expenses.
The treatment of intercompany pooling in Schedule P is different from that of a typical
reinsurance agreement. Gross losses are combined or “pooled” and then shared based on the
pooling percentage of each member company, regardless of the policy issuing entity. Net
losses are treated in the same manner in that they are first pooled and then shared based on
each company’s pooling percentage. Very simply, assume Companies A, B and C participate in
intercompany pooling, with 60%, 20% and 20% participation, respectively. If each company
has $100 of loss reserves on a direct basis and cedes $30 to outside reinsurers, the recorded
reserves in Schedule P of Companies A, B and C would be $180, $60 and $60 on a gross of
reinsurance basis and $126, $42 and $42 on a net of reinsurance basis, respectively. That is,
the pooled gross ($300) and net amounts ($210) are shared based on each company’s
participation rates. This is summarized in Table 55.
97
NAIC Accounting Practices and Procedures Manual, March 2019, SSAP No. 63, Underwriting Pools, page 63-3,
paragraph 7.

FINANCIAL REPORTING THROUGH THE LENS OF A PROPERTY/CASUALTY ACTUARY
Part III. SAP in the U.S.: Fundamental Aspects of the Annual Statement
198
TABLE 55
Reporting in Schedule P
Company A Company B Company C
(Lead)
(Non
-
Lead)
(Non
-
Lead)
Total
Total Gross
180
60
60
300
Total Net
126
42
42
210
While Schedule P for companies that operate under an intercompany pooling arrangement is
prepared on a pooled basis, as exemplified above, other schedules and exhibits within the
Annual Statement treat intercompany pooling as if it is a typical reinsurance arrangement.
Therefore, using the above example, if Company A were the lead in the intercompany pool,
then Company A would have $100 in direct loss reserves, plus $70 assumed from each of
Companies B and C, for a total of $240 in gross reserves. The $70 in assumed loss reserves
from each non-lead company is after cessions to outside reinsurance.
For each non-lead company, the amount of gross loss reserves is $100 in direct reserves plus
the amount assumed after the lead company cedes through the intercompany reinsurance
relationship. The amount of business in the intercompany pool is $300 of direct loss reserves
minus $90 (=$30*3) of ceded business, for a total of $210 net reserves. The $210 pooled
net loss reserve is shared 60%, 20%, 20%, so each non-lead gets $42. Thus, the total gross
loss reserves for each non-lead is $100 in direct plus $42 of intercompany pooled loss
reserves for a total of $142. These amounts are summarized in Table 56.
TABLE 56
Reporting in Annual Statement Exhibits and Schedules other than P
Company A Company B Company C
(Lead)
(Non
-
Lead)
(Non
-
Lead)
Total
Total Gross
240
142
142
524
Total Net
126
42
42
210
Notice that on a net basis, the amounts are the same in all of the exhibits and schedules
within the Annual Statement. However, on a gross basis, exhibits and schedules other than
Schedule P essentially double count the cessions to intercompany pooling, whereas Schedule
P nets them out.
The fact that Schedule F does not show IBNR on an assumed basis, the double counting effect
of pooling, as well as the fact that some companies have other intercompany reinsurance
relationships outside the intercompany pooling relationship, complicates the reconciliation

FINANCIAL REPORTING THROUGH THE LENS OF A PROPERTY/CASUALTY ACTUARY
Part III. SAP in the U.S.: Fundamental Aspects of the Annual Statement
199
between Schedules within the Annual Statement to Schedule P. This is the main reason we
have not used Fictitious in our examples.
We used loss reserves in our example. However, it is important to note that pooling
percentages apply to the premium, loss, expense and claim count data within Schedule P.
Therefore, all figures provided in Part 1 and the triangles provided in Parts 2 through 7 are
provided after intercompany pooling. If one wanted to determine total premium, loss,
expense and/or claim count data for the pool in aggregate, all one would need to do is divide
the figures in Schedule P for a pool member by its intercompany pooling percentage in
Schedule P, Part 1, column 34.
Intercompany pooling percentages can change over time, based on a particular group’s
business strategy. Schedule P is generally restated retroactively when there is a change in
intercompany pooling.
Ignoring differences in underwriting expense structure, underwriting income for members of
an intercompany pool is shared based on their respective pooling percentage. Each company
will likely have its own underwriting expense structure, as well as structure for investment
and other income, therefore policyholders’ surplus will differ by company and may not align
with the companies’ particular pooling percentages. However, pooling percentages are
generally determined with consideration of the level of policyholders’ surplus at the legal
entity level; in general, the larger the surplus, the greater the share.
As with reinsurance, companies use intercompany pooling for surplus relief. Under
intercompany reinsurance, an individual company provides the relief. Under intercompany
pooling, the members of the pool utilize the capital and surplus of all the companies, rather
than each individual company.
Actuaries often think of intercompany pooling as advantageous over intercompany
reinsurance, given that the unpaid claim analysis for both gross and net reserves can be
calculated on pooled (combined) basis, as opposed to having to perform separate analyses of
gross reserves for each entity. However, many companies use intercompany reinsurance as
opposed to intercompany pooling.
In general, intercompany pooling should be easier to administer than having to maintain
separate intercompany reinsurance agreements between affiliates. Over time, one table of
pooling percentages can be updated as things change, therefore intercompany pooling can be
more flexible. Intercompany pooling also makes it easier for a rating agency to review the
financial condition of a group and assign a single rating. The group can then market its rating
across all member underwriting companies. We expect that intercompany pooling would also
facilitate regulatory review at a group level versus each individual company.

FINANCIAL REPORTING THROUGH THE LENS OF A PROPERTY/CASUALTY ACTUARY
Part IV. Statutory Filings to Accompany the Annual Statement
200
PART IV. STATUTORY FILINGS TO ACCOMPANY THE ANNUAL
STATEMENT
INTRODUCTION TO PART IV
Insurance companies are required to file numerous documents with state insurance
regulators each year, either included within or supplemental to the Property/Casualty Annual
Statement. These annual filings include those listed in the Official NAIC Annual Statement
Instructions Property/Casualty,
98
such as the Statement of Actuarial Opinion (SAO), Actuarial
Opinion Summary Supplement (AOS), Supplemental Compensation Exhibit, Insurance Expense
Exhibit (IEE), Supplemental Investment Risks Interrogatories, Financial Guaranty Insurance
Exhibit and others such as the National Association of Insurance Commissioners (NAIC)
Insurance Regulatory Information System (IRIS) ratio and Risk-Based Capital (RBC)
calculation. Many of these filings serve as a means for regulators to obtain a relatively quick
view of an insurance company’s financial health, thereby enabling regulators to prioritize
those insurance companies requiring immediate attention.
This section addresses the filings that tend to be used the most by property/casualty
actuaries, namely:
• SAO
• AOS
• IEE
• RBC
• IRIS
We will discuss the purpose and important aspects of each filing. Many of these filings are
addressed in considerable detail in other publications, and the NAIC has issued instructions,
manuals and/or software applications that provide the preparer of these filings with
authoritative guidance. This section is not intended to replace those readings or provide
instructions on how to prepare those filings. Rather, we will limit our discussion to the
purpose of each and a general overview of how they are prepared.
98
2018 NAIC Annual Statement Instructions Property/Casualty, pages i-v.

FINANCIAL REPORTING THROUGH THE LENS OF A PROPERTY/CASUALTY ACTUARY
Part IV. Statutory Filings to Accompany the Annual Statement
201
CHAPTER 16. STATEMENT OF ACTUARIAL OPINION
OVERVIEW
The Statement of Actuarial Opinion (SAO) provides the opinion of a qualified actuary on the
reasonableness of the loss and loss adjustment expense (LAE) reserves recorded by a
property/casualty insurance company as of December 31 each year. It is filed with the Annual
Statement, either included or attached to page 1 of the Annual Statement. The SAO must be
prepared by a qualified actuary, as defined by the National Association of Insurance
Commissioners (NAIC),
99
who is appointed by the company’s board and then referred to as
the appointed actuary.
100
Certain companies may qualify for an exemption from the SAO requirement. Possible
exemptions include the following:
• Size of the insurer (less than $1 million of total gross written premiums during a
calendar year and less than $1 million of total gross loss and LAE reserves at year-
end)
• Insurers under supervision or conservatorship
• Nature of business written
• Insurers under financial hardship (if the cost of the SAO is greater than either 1% of
surplus or 3% of gross written premiums during the calendar year within which the
exemption is requested)
Simply meeting one of the above criteria does not provide automatic exemption. To qualify,
the insurer has to file for exemption with its domiciliary commissioner. It is at the discretion of
the domiciliary commissioner to decide whether to exempt a company from the SAO
requirement.
The main purposes of the SAO are the following:
99
A qualified actuary is defined by the NAIC as “a person who meets the basic education, experience and
continuing education requirements of the Specific Qualification Standard for Statements of Actuarial Opinion, NAIC
Property and Casualty Annual Statement, as set forth in the Qualification Standards for Actuaries Issuing
Statements of Actuarial Opinion in the United States, promulgated by the American Academy of Actuaries, and is
either: (i) A member in good standing of the Casualty Actuarial Society, or (ii) A member in good standing of the
American Academy of Actuaries who has been approved as qualified for signing casualty loss reserve opinions by
the Casualty Practice Council of the American Academy of Actuaries” 2011 NAIC Annual Statement Instructions
Property/Casualty, page 9.
100
The 2011 NAIC Annual Statement Instructions Property/Casualty go on further by saying that the requirements
of the company’s domiciliary state may permit individuals to issue the SAO despite not meeting the definition of
qualified actuary per the NAIC. In these instances, a letter from the state must be attached to the SAO indicating
that the individual meets the state’s requirement to issue SAOs. Throughout this text we will use the terms
“qualified actuary” and “appointed actuary” to encompass these individuals.

FINANCIAL REPORTING THROUGH THE LENS OF A PROPERTY/CASUALTY ACTUARY
Part IV. Statutory Filings to Accompany the Annual Statement
202
• Provide the appointed actuary’s opinion on the reserves specified within the scope of
the SAO.
• Inform the reader, in particular regulators, of significant risk factors and/or
uncertainties with respect to those reserves.
• Advise whether those risks and uncertainties are reasonably expected to lead to
material adverse deviation in the reserves.
There is considerable guidance for the actuary in issuing the SAO. Every appointed actuary
should read and be familiar with the most current versions of the following:
• Qualification Standards, as set forth by the American Academy of Actuaries (AAA)
• NAIC Instructions for the SAO
• AAA Committee on Property and Liability Financial Reporting (COPLFR) Practice Note
on Statements of Actuarial Opinion on Property and Casualty Loss Reserves (COPLFR
P/C Practice Note)
• NAIC Regulatory Guidance On Property and Casualty Statutory Statements of Actuarial
Opinion Prepared by the NAIC’s Casualty Actuarial and Statistical (C) Task Force
101
• Actuarial Standards of Practice (ASOP), including but not limited to:
• ASOP No. 20. Discounting of Property/Casualty Unpaid Claim Estimates
(September 2011)
• ASOP No. 23. Data Quality
• ASOP No. 36. Statement of Actuarial Opinion Regarding Property/Casualty
Loss and LAE Reserves
• ASOP No. 41. Actuarial Communications
• ASOP No. 43. Property/Casualty Unpaid Claim Estimates
• Applicable state laws, in particular with respect to reserve requirements, SAO
requirements, discounting, etc. (the Property/Casualty Loss Reserve Law Manual
published annually by the AAA provides a compilation of this material)
102
• SSAP No. 55, Unpaid Claims, Losses and Loss Adjustment Expenses
• SSAP No. 62R, Property and Casualty Reinsurance
• SSAP No. 65, Property and Casualty Contracts
The SAO is organized into four required sections:
1. Identification
2. Scope
3. Opinion
4. Relevant comments
101
This is updated annually and typically included as an appendix to COPLFR P/C Practice Note.
102
Applicable laws and regulations supersede any applicable ASOPs.

FINANCIAL REPORTING THROUGH THE LENS OF A PROPERTY/CASUALTY ACTUARY
Part IV. Statutory Filings to Accompany the Annual Statement
203
Each section must be included and clearly identified within the SAO.
The SAO also contains two exhibits, A and B. Exhibit A provides the recorded amounts
associated with the items identified in the scope section, generally on a direct plus assumed
and net basis. Exhibit B provides relevant disclosure items with respect to the net reserves
identified in the scope section, as identified in the relevant comments section. For example,
loss and LAE reserves for asbestos are disclosed in Exhibit B on a net of reinsurance basis.
There is no separate exhibit within the SAO showing asbestos reserves on a gross of
reinsurance basis. Differences between the net and gross (direct plus assumed) amounts
reported in Exhibit B may be discussed in the relevant comments section.
While there are other publications on the CAS Exam 6 U.S. Syllabus of Basic Education that
cover the SAO, there is not a “real” SAO on the Syllabus to bring the instructions to life for
the student. As a result, we have created a SAO for Fictitious Insurance Company to illustrate
the application of the SAO instructions in practice. Fictitious’ SAO was issued by an imaginary
actuary named Mr. William H. Smith, who is a consulting actuary with the make-believe firm,
WS Actuarial Consulting. Smith’s opinion is included in of this publication and should be read
side-by-side with this chapter.
The Fictitious SAO is the author’s interpretation of the NAIC instructions as they might apply
to Fictitious. It should not be taken as authoritative guidance on format or content of the
SAO.
The following provides a summarized view of each of the four sections of the SAO and how
Fictitious’ appointed actuary responded to each required section in his 2018 SAO for the
company.
IDENTIFICATION
The identification section of the SAO provides the actuary’s name and credentials, the
actuary’s qualifications for issuing the SAO, the actuary’s relationship to the company, and
the date the actuary was appointed by the company’s board of directors (or its equivalent) to
issue the opinion. This section typically includes a statement identifying the intended
purposes and users of the opinion, consistent with ASOP 36 requirements.
For Fictitious, the 2018 SAO was issued by Mr. William H. Smith, who is a Fellow of the
Casualty Actuarial Society and Member, American Academy of Actuaries, and is associated
with the firm of WS Actuarial Consulting. He was appointed by the company’s board of
directors on September 7, 2018. At the time of issuance of his opinion (February 24, 2019),
Smith met the qualification standards to issue SAOs.
The intended purpose of Smith’s opinion was to satisfy the requirements of the NAIC. The
intended users were the company’s management, the directors of its board and state
regulatory officials.

FINANCIAL REPORTING THROUGH THE LENS OF A PROPERTY/CASUALTY ACTUARY
Part IV. Statutory Filings to Accompany the Annual Statement
204
SCOPE
The scope section identifies the reserve items upon which the actuary is giving an opinion as
well as the accounting basis for those reserves. The reserve items include:
• Loss and LAE reserves
• Retroactive reinsurance assumed reserves
• Unearned premium reserves for Property and Casualty (“P&C”) Long-Duration
Contracts
103
• Unearned premium reserves for extended reporting endorsements, such as those
included in Schedule P Interrogatory No. 1 of the company’s Annual Statement
• Other reserve items for which the actuary is providing an opinion
The scope also identifies the “review date,” which is defined in ASOP 36 as “the date
(subsequent to the valuation date) through which material information known to the actuary
is included in forming the reserve opinion.”
104
If no such date is explicitly disclosed, it is likely
to be assumed by the reader of the opinion that the review date is the date the opinion is
signed.
It also contains a statement regarding who provided the data relied upon by the actuary in
forming the opinion and that either the actuary performed a reconciliation of that data, or
reviewed a reconciliation prepared by the company, to Schedule P of the company’s Annual
Statement.
If the company participates in intercompany pooling, the actuary may wish to disclose this
and the basis for reconciling data used in the actuary’s analysis to Schedule P.
Further, regulatory guidance suggests that the scope section for each pooled company
provide information about the pooling arrangement, including the intercompany pooling
percentage for the company.
There are special requirements for opinions on non-lead companies operating under an
intercompany pooling arrangement in which the lead company retains 100% of the pooled
reserves. We refer the reader to the NAIC opinion instructions and COPLFR Practice Note for
further guidance.
103
P&C Long Duration Contracts are defined on page 10 of the NAIC SAO Instructions as “contracts (excluding
financial guaranty contracts, mortgage guaranty contracts and surety contracts) that fulfill both of the following
conditions: (1) the contract term is greater than or equal to 13 months; and (2) the insurer can neither cancel the
contract not increase the premium during the contract term. These contracts are subject to the three tests of
SSAP No. 65-Property and Casualty Contracts of the NAIC Accounting Practices and Procedures Manual.”
104
Actuarial Standards Board of the American Academy of Actuaries, “Actuarial Standard of Practice No. 36,
Statements of Actuarial Opinion Regarding Property/Casualty Loss and Loss Adjustment Expense Reserves,”
December 2010, page 3.

FINANCIAL REPORTING THROUGH THE LENS OF A PROPERTY/CASUALTY ACTUARY
Part IV. Statutory Filings to Accompany the Annual Statement
205
The reserve items on which Smith opined for Fictitious are presented in Exhibit A of his 2018
SAO. As displayed on Exhibit A, Smith opined on net loss and LAE reserves in lines 1 and 2,
totaling $51,557,000 as of December 31, 2018. The amounts in lines 1 and 2 of Exhibit A
reconcile to lines 1 and 3, respectively, of the Liabilities, Surplus and Other Funds page of the
2018 Annual Statements.
Smith also opined on total direct plus assumed (or gross) loss and LAE reserves of
$61,699,000, as shown in lines 3 and 4. The amounts in lines 3 and 4 reconcile to Schedule
P, Part 1, Summary, columns 13 plus 15, and columns 17, 19 and 21, respectively.
As disclosed in the Notes to Financial Statements (see Chapter 10. Notes to Financial
Statements) and displayed in Exhibit A of the SAO, Fictitious did not have any retroactive
reinsurance assumed as of December 31, 2018. Nor were there any other loss reserve items
on which Smith expressed an opinion.
Smith disclosed his “review date” as January 28, 2019. This means that information received
through January 28, 2019, was relevant to his analysis of unpaid claims and his opinion on
the company’s loss and LAE reserves. Information after that date, to the time he signed the
opinion on February 24, 2019 (see the signature line of the opinion), was not relied on by
Smith in forming his opinion.
The scope section also provides a statement from Smith that he reconciled the data that he
relied upon for purposes of forming his opinion to Schedule P, Part 1, of Fictitious’ 2018
Annual Statement.
OPINION
The opinion section provides exactly what the name says, the actuary’s opinion with respect
to the reserves identified in the scope section. The actuary has five options in terms of the
type of opinion, as outlined in ASOP 36. These are:
1. Reasonable: if the recorded reserve lies within the actuary’s range of reasonable
unpaid claim estimates
2. Inadequate or deficient: if the recorded reserves are below what the actuary deems to
be reasonable
3. Excessive or redundant: if the recorded reserves are above what the actuary deems to
be reasonable
105
4. Qualified: if the actuary is unable to issue an opinion on certain items and those items
are believed to be material
5. No opinion: if the actuary is unable to conclude on the reasonableness of the recorded
reserves
105
Ibid., page 9.

FINANCIAL REPORTING THROUGH THE LENS OF A PROPERTY/CASUALTY ACTUARY
Part IV. Statutory Filings to Accompany the Annual Statement
206
Note that in accordance with ASOP 36, the actuary should disclose the minimum amount that
he or she deems reasonable when issuing an inadequate or deficient opinion.
106
Similarly, the
actuary should disclose the maximum amount deemed to be reasonable when issuing an
excessive or redundant opinion.
The actuary is also required to state whether the recorded reserves identified in the scope
section meet the requirements of the insurance laws of the state the company is domiciled in
and are computed in accordance with actuarial standards.
Additionally, if use was made of the work of another actuary, such as for pools and
associations, for a subsidiary, or for special lines of business, in forming the SAO, the other
actuary must be identified by name and affiliation within the opinion section. The appointed
actuary cannot simply rely on another actuary’s opinion. The appointed actuary needs to
perform enough analysis on the other actuary’s work to issue an unqualified opinion on the
total reserve amounts listed in Exhibit A. A situation where the actuary may make use of
another’s work is for reserves assumed by the company for its participation in underwriting
pools and associations. ASOP No. 36 provides the relevant guidance, and the COPLFR P/C
Practice Note provides good examples of how to handle this situation in practice.
107
The 2018 SAO for Fictitious states the following:
“In my opinion, the amounts carried in Exhibit A on account of the items identified:
• Make a reasonable provision for all unpaid losses and loss adjustment expenses, gross
and net as to reinsurance ceded, under the terms of the Company’s contracts and
agreements
• Are computed in accordance with accepted standards and principles
• Meet the requirements of the insurance laws of Florida”
108
Note that Smith opined on the loss and LAE reserves in Exhibit A, items 1 through 6. These
reserves include “Retroactive Reinsurance Reserve Assumed,” which in the case of Fictitious
totaled $0.
Unless otherwise disclosed, the Appointed Actuary will generally opine on the loss and LAE
reserves including the amount of retroactive reinsurance assumed, despite the fact that the
amount of retroactive reinsurance is not accounted for within lines 1 and 3 of page 3 of the
Annual Statement under SAP. This treatment is in accordance with the NAIC instructions.
106
Ibid., page 10.
107
Committee on Property and Liability Financial Reporting, American Academy of Actuaries, “Property and
Casualty Practice Note, Statements of Actuarial Opinion on P&C Loss Reserves as of December 31, 2018,” page 55.
108
See Appendix I of this publication for the Statement of Actuarial Opinion for Fictitious Insurance Company.

FINANCIAL REPORTING THROUGH THE LENS OF A PROPERTY/CASUALTY ACTUARY
Part IV. Statutory Filings to Accompany the Annual Statement
207
Retroactive reinsurance assumed is a liability, and regulators look for assurance that this
balance is reasonable.
The reserves for retroactive reinsurance ceded are not separately listed on Exhibit A and are
therefore not explicitly opined on by the actuary. The absence of this reserve from Exhibit A is
not because regulators don’t care about the reasonableness of the balance. Rather, the
reserve for retroactive reinsurance ceded is already included as a component of the gross
loss and LAE reserves, which are opined on by the actuary.
109
An overstatement or
understatement of retroactive reinsurance ceded would impact gross and ceded reserves
equally and have no impact on the net reserve balance.
RELEVANT COMMENTS
The relevant comments section provides commentary and disclosures relative to the reserves
opined on to assist the reader in understanding the context and composition of those
reserves. Commentary is required on the following items:
• The actuary’s materiality standard for purposes of addressing the risk of material
adverse deviation
• Significant risks and uncertainties that could result in material adverse deviation
• The significance of items listed in Exhibit B, including:
• Anticipated net salvage and subrogation
• Nontabular discounting
• Tabular discounting
• Net reserves for the company’s share of voluntary and involuntary pools and
associations
• Net reserves for asbestos and environmental liabilities
• Claims-made extended loss and LAE reserve reported as unearned premium
and as loss reserves
• Retroactive or financial reinsurance
• Uncollectible reinsurance
• The results of IRIS ratios 11, 12 and 13 and explanation for exceptional values
• Changes in methods and assumptions from those employed in the most recent prior
opinion that are deemed to have a material effect on the recorded reserve or actuary’s
unpaid claim estimate
• Unearned premium reserves for P&C Long Duration Contracts
• Net reserves for Accident and Health (“A&H”) Long Duration Contracts that the
company carries on the Liabilities, Surplus and Other Funds page as Losses, Loss
109
Recall from Chapter 10. Notes to Financial Statements, a company’s gross reserves are not reduced for
retroactive reinsurance ceded. Rather, retroactive reinsurance ceded is recorded separately as a write-in item on
the balance sheet.

FINANCIAL REPORTING THROUGH THE LENS OF A PROPERTY/CASUALTY ACTUARY
Part IV. Statutory Filings to Accompany the Annual Statement
208
Adjustment Expenses, Unearned Premium or other Write-In items (e.g., Premium
Deficiency Reserves, Contract Reserves, or AG 51 Reserves)
110
With respect to the risk of material adverse deviation, the NAIC Instructions require the
appointed actuary to make an explicit statement as to whether or not he/she believes there
are significant risks and/or uncertainties that could result in material adverse deviation.
Smith addresses the above items within the 2018 SAO for Fictitious, as applicable. We will not
discuss each item but rather provide further details on some to assist in reading this section
of the opinion.
MATERIALITY STANDARD
There are numerous ways an actuary can establish his or her materiality standards, and
examples are provided in the COPLFR Practice Note. Common methods are based on a
percentage of reserves, surplus and movements in Risk-Based Capital (RBC) levels, among
others. Materiality standards such as 10% of loss and LAE reserves or anywhere from 10% to
20% of surplus are commonly used. However, some actuaries establish materiality standards
using a set dollar amount based on the actuary’s particular knowledge of the company’s
operations. As an extreme example, for a company operating with limited surplus and/or
under regulatory intervention, a deviation in loss and LAE reserves greater than $0 might be
considered material.
Regardless, there is no “one size fits all” in terms of formulaic materiality standards. The
standard is based on the actuary’s personal opinion as to what he or she considers material in
relation to the company’s reserves and surplus.
Smith considered a deviation in net loss and LAE reserves of more than:
1. 10% of net loss and LAE reserves, which he calculated as:
10% of $51.557 million = $5.156 million
2. 20% of policyholders’ surplus, which he calculated as:
110
“A&H Long Duration Contracts are defined on page 10 of the NAIC SAO Instructions as “contracts in which the
contract term is greater than or equal to 13 months and contract reserves are required. See Schedule H
instructions for a description of categories of contract reserves, as well as policy features that give rise to contract
reserves. Two specific examples of contracts that typically require contract reserves are long-term care and
disability income insurance.” According to page 15 of the NAIC SAO Instructions, “Actuarial Guideline LI—The
Application of Asset Adequacy Testing to Long-Term Care Insurance Reserves (AG 51) in the NAIC Accounting
Practices and Procedures Manual requires a company to perform a stand-alone asset adequacy analysis for its in
force long-term care (LTC) contracts with more than 10,000 in force lives as of the valuation date. The Actuarial
Report and workpapers summarizing the results, assumptions and testing procedures for the asset adequacy
testing of LTC business must be in compliance with AG 51 requirements.”

FINANCIAL REPORTING THROUGH THE LENS OF A PROPERTY/CASUALTY ACTUARY
Part IV. Statutory Filings to Accompany the Annual Statement
209
20% of $31.024 million = $6.205 million
Or
3. The reduction in surplus that would result in additional action per the NAIC RBC
formula, which he calculated as the difference between the following:
• The company’s total adjusted capital of $31.024 million,
111
which
produces an RBC ratio of 555% based on authorized control level
(ACL) RBC of $5.588 million per the Five-Year Historical Data
exhibit
• Adjusted capital at the next RBC level of $11.176 million, which is
equal to two times ACL
The difference between $31.024 million and $11.176 million is $19.848
million.
For purposes of establishing his materiality standard, Smith selects the smallest of the three
balances, which in this case happens to be 10% of net loss and LAE reserves ($5.156 million).
MAJOR RISK FACTORS
Once materiality is defined, the actuary determines whether there are significant risks or
uncertainties that could result in material adverse deviation in the company’s loss and LAE
reserve. According to the NAIC instructions to the SAO, “If such risk exists, the actuary
should include an explanatory paragraph to describe the major factors, combination of
factors, or particular conditions underlying the risks and uncertainties that the actuary
reasonably believes could result in material adverse deviation.”
112
Examples of risk factors
are provided in the COPLFR Practice Note.
Note that the actuary is not expected to list all risks that the company is exposed. Rather,
only those major risk factors that could result in the reserves developing adversely by an
amount that is material relative to the actuary’s materiality standard. To illustrate, Smith
identifies and provides details about major risk factors that materially affect the variability of
the reserves held by Fictitious Insurance Company. The major risk factors identified are mass
tort claims; so-called “Chinese drywall” claims; cumulative injury losses; claims from large
deductible workers’ compensation policies; and claims related to catastrophic weather events,
including wildfires, tornadoes and hurricanes. The uncertainty associated with these types of
claims adds to the variability in the company’s recorded reserves.
111
Differences from above due to immaterial rounding errors that may occur in the Annual Statement.
112
2018 NAIC Annual Statement Instructions Property/Casualty, page 13.

FINANCIAL REPORTING THROUGH THE LENS OF A PROPERTY/CASUALTY ACTUARY
Part IV. Statutory Filings to Accompany the Annual Statement
210
RISK OF MATERIAL ADVERSE DEVIATION
The actuary is required to make a clear statement within the SAO as to whether or not there
are significant risks or uncertainties that could result in material adverse deviation. That
determination is based on the major risk factors identified by the actuary, the actuary’s
professional opinion of the variability inherent in the unpaid claim estimates and the actuary’s
materiality standard.
In the case of Fictitious, Smith concludes that there are significant risks that could result in
the net reserve amount deviating adversely from that recorded by the company by a material
amount. This conclusion was determined in part quantitatively, by comparing the distance
between the company’s net recorded loss and LAE reserve and the high end of Smith’s range
to his materiality standard.
As shown in the Smith’s Actuarial Opinion Summary for the company, he has developed a
range of reasonable unpaid loss and LAE claim estimates on a net of reinsurance basis of $43
million to $57 million with a point estimate of $50 million. The distance between the
company’s recorded reserve of $51.556 million and the high end of Smith’s range is $5.443
million. Smith’s materiality standard is $5.156 million, which is less than the distance
between the high end of his range and the recorded reserve. This means that a deviation of
$5.156 million is reasonably expected by Smith, as it lies within his range relative to the
recorded balance. The compilation of these figures is shown in Table 57.
TABLE 57
WS Actuarial Consultin
g
Carried +
Low Point High
Fictitious
Carried
Materiality
Standard
Reserve estimates
43,000
50,000
57,000
51,557
56,713
Stated differently, Smith reasonably expects that the company’s carried reserve could deviate
by an amount equal to the materiality standard since the carried reserve plus the materiality
standard lies within his range of reasonable unpaid claim estimates. The results of his
quantitative analysis, coupled with his knowledge of the significant risks and uncertainties
inherent in the company’s reserves, lead Smith to conclude that there are significant risks and
uncertainties that could result in material adverse deviation in the recorded reserves.
It is important to note that there is no requirement for an actuary to provide a range. Even
when a range is provided, the actuary may believe there are significant risks and uncertainties
that could result in material adverse deviation despite the results of the calculation described
above. In other words, there may be qualitative reasons for concluding there are significant
risks that could result in material adverse deviation absent quantitative reasons. For
example, a company might have a significant portion of its gross loss and LAE reserves ceded

FINANCIAL REPORTING THROUGH THE LENS OF A PROPERTY/CASUALTY ACTUARY
Part IV. Statutory Filings to Accompany the Annual Statement
211
to a reinsurer of relatively weak financial strength. In this case, the carried net reserve plus
materiality standard might exceed the high end of the actuary’s range (assuming all
reinsurance was considered valid and collectible in determining the range). However, the risk
that the company may not be able to recover a portion of its gross reserves due to the
financial strength of one of its reinsurers may be considered significant by the actuary, and
lead him/her to conclude the carried net reserves could deviate adversely by a material
amount. Therefore, both qualitative and quantitative considerations should be considered in
determining whether there are significant risks that could result in material adverse deviation.
REMAINING RELEVANT COMMENTS
The remaining relevant comments in Smith’s opinion speak to the disclosure items in Exhibit
B, addressing the fact that the company anticipates salvage and subrogation in its reserves
totaling $1.363 million and discounts its reserves for certain workers’ compensation and
other liability claims on a tabular basis, the amount of which totals $1.365 million.
According to Smith, the company does not have claims-made extended reporting
endorsement loss and expense reserves, participate in any underwriting pools or associations
or write either P&C or A&H Long Duration Contracts.
As noted, retroactive and financial reinsurance is addressed in the relevant comments
section. The liability for the one retroactive reinsurance assumed contract that the company
has been deemed immaterial by Smith.
Finally, Smith has disclosed in his opinion that IRIS ratios 11, 12 and 13 did not produce
unusual values for the company. We have confirmed this statement in our recalculation of
Fictitious’ IRIS ratios in Appendix I of this publication.
SIGNATURE OF THE APPOINTED ACTUARY
The SAO closes with an affirmative statement that an actuarial report supporting the SAO will
be provided to the company and retained for a period of seven years at its administrative
offices and will be made available for regulatory examination, if requested.
The SAO is signed and dated by the actuary for delivery along with the Annual Statement by
March 1 of the year following the Annual Statement date (December 31). Note that some
states require an original signature on each signed opinion, as opposed to a photocopy. The
signature line includes the actuary’s address (both postal and email).
Smith signed the opinion on February 24, 2019.
NOTEWORTHY CHANGES TO THE NAIC SAO INSTRUCTIONS IN 2019
While this text contemplates the NAIC SAO Instructions for 2018, there were significant
changes to the NAIC SAO Instructions for 2019 pertaining to the requirements for an actuary

FINANCIAL REPORTING THROUGH THE LENS OF A PROPERTY/CASUALTY ACTUARY
Part IV. Statutory Filings to Accompany the Annual Statement
212
to be qualified to sign property/casualty SAOs. In particular, the NAIC set the definition of a
“Qualified Actuary” as “a person who:
(i) Meets the basic education, experience and continuing education requirements
of Specific Qualifications Standard for Statements of Actuarial Opinion, NAIC
Property and Casualty Annual Statement, as set forth in the Qualification
Standards for Actuaries Issuing Statements of Actuarial Opinion in the United
States (U.S. Qualification Standards), promulgated by the American Academy
of Actuaries (Academy), and
(ii) has obtained and maintains an Accepted Actuarial Designation; and
(iii) is a member of a professional actuarial association that requires adherence to
the same Code of Professional Conduct promulgated by the Academy, requires
adherence to the U.S. Qualification Standards, and participates in the Actuarial
Board for Counseling and Discipline when its members are practicing in the U.S.
An exception to parts (i) and (ii) of this definition would be an actuary evaluated by the
Academy’s Casualty Practice Council and determined to be a Qualified Actuary for
particular lines of business and business activities.”
113
The NAIC has defined the term “Accepted Actuarial Designation as “an actuarial designation
accepted as meeting or exceeding the NAIC’s Minimum Property/Casualty (P/C) Actuarial
Educational Standards for a P/C Appointed Actuary (published on the NAIC website). The
following actuarial designations, with any noted conditions, are accepted as meeting or
exceeding basic education minimum standards:
(i) Fellow of the CAS (FCAS) – Condition: basic education must include Exam 6 –
Regulation and Financial Reporting (United States);
(ii) Associate of the CAS (ACAS) – Conditions: basic education must include Exam 6 –
Regulation and Financial Reporting (United States) and Exam 7 – Estimation of
Policy Liabilities, Insurance Company Valuation, and Enterprise Risk Management;
(iii) Fellow of the SOA (FSA) – Conditions: basic education must include completion of
the general insurance track, including the following optional exams: the United
States’ version of the Financial and Regulatory Environment Exam and the
Advanced Topics in General Insurance Exam.“
114
The 2019 NAIC SAO Instructions include a table of allowable exam substitutions for (i), (ii)
and (iii) in the definition of “Accepted Actuarial Designation” given that exams have changed
over time.
113
2019 NAIC Annual Statement Instructions Property/Casualty, page 10.
114
Ibid.

FINANCIAL REPORTING THROUGH THE LENS OF A PROPERTY/CASUALTY ACTUARY
Part IV. Statutory Filings to Accompany the Annual Statement
213
In accordance with these changes, Exhibit B, Item 3 of the SAO (the Appointed Actuary’s
designation) has been modified to provide the Appointed Actuary’s Accepted Actuarial
Designation and the NAIC now requires the Appointed Actuary to provide qualification
documentation to company’s Board of Directors, including a description of how the Appointed
Actuary meets the definition of Qualified Actuary and his or her experience relevant to the
subject of the SAO.
We refer the reader to the 2019 NAIC SAO Instructions, AOWG Regulatory Guidance and
COPLFR Practice Note for further details on these changes and new requirements for the
Appointed Actuary.

FINANCIAL REPORTING THROUGH THE LENS OF A PROPERTY/CASUALTY ACTUARY
Part IV. Statutory Filings to Accompany the Annual Statement
214
CHAPTER 17. ACTUARIAL OPINION SUMMARY SUPPLEMENT
OVERVIEW
The Actuarial Opinion Summary Supplement (AOS) is required to be filed by the company with
its domiciliary state by March 15 of the year following the Annual Statement date (December
31). This is a confidential document containing the appointed actuary’s range of unpaid claim
estimates and/or point estimate, as calculated by the actuary, in comparison to the
company’s recorded reserves on a net and gross of reinsurance basis. Due to its confidential
nature, it is filed separately from the public Annual Statement document, which is due on
March 1.
Non-domiciliary states that provide evidence of the ability to preserve the confidential nature
of the document may request a copy.
The AOS also provides a statement regarding whether the company has experienced one-year
adverse development in excess of 5% of surplus in three or more of the past five years. The
amount of adverse development is computed in Schedule P, Part 2, Summary, and is also
provided in the one-year development line of the Five-Year Historical Data exhibit within the
Annual Statement. If the company has experienced adverse development in excess of 5% of
surplus in three or more of the past five years, an explanatory paragraph is required so that
the regulator can determine what additional review, if any, is required.
Prior to 2011, the actuary had the choice of providing his or her range, point estimate, or
both, regardless of whether the actuary calculated both. In 2011, the instructions changed,
requiring the actuary to include the point estimate and range, if both are calculated. If only
one is calculated, the actuary would need only to provide one.
Because the AOS document is confidential, it is not available for public review, unlike the
Statement of Actuarial Opinion (SAO). As a result, the student will not be able to find the AOS
for the companies listed on the Casualty Actuarial Society Syllabus of Basic Education.
However, we created an AOS for Fictitious Insurance Company, which is provided in Appendix
I of this publication and should be read side by side with this chapter of the publication.
Like the SAO, the AOS is signed and dated by the actuary. In the case of Fictitious, this is Mr.
William H. Smith. As we see in items A and B, Smith has produced a range and point estimate
in his independent analysis of unpaid claims supporting the SAO. Items A and B include his
range and point estimate on a net and gross of reinsurance basis, as displayed in Table 58.

FINANCIAL REPORTING THROUGH THE LENS OF A PROPERTY/CASUALTY ACTUARY
Part IV. Statutory Filings to Accompany the Annual Statement
215
TABLE 58
Net Reserves (USD in 000s)
Gross Reserves (USD in 000s)
Lo
w
Point
High
Low
Point
High
A. Actuary’s range of reserve estimates
43,000
57,000
52,000
68,000
B. Actuary’s point estimate
50,000
60,000
Item C provides the company’s carried loss and loss adjustment expense (LAE) reserves on
which the actuary has based his opinion. Item D highlights the company’s position within the
actuary’s range by showing the difference between the carried loss and LAE reserves and the
actuary’s range and point estimate. In Table 59 we see that Fictitious’ recorded reserves lie
above Smith’s point estimate.
TABLE 59
Net Reserves (USD in 000s)
Gross Reserves (USD in 000s)
Low
Point
High
Low
Point
High
C.
Company carried
reserves
51,557
61,699
D.
Difference between
Company carrie
d
and Actuary’s estimate
(C. - A. and C. – B., if applicable)
8,557
1,557
(5,443)
9,699
1,699
(6,301)
It is not surprising that Fictitious’ recorded reserves lie within the high end of the actuary’s
range given that the Fictitious’ recorded loss and LAE reserves have developed favorably over
time. This favorable development is seen in the one-year development line of the Five-Year
Historical Data exhibit within Fictitious’ 2018 Annual Statement. At the risk of being
repetitious (see Table 13), we show the one-year development line again in Table 60.
TABLE 60
Data from Fictitious Insurance Company 2018 Five-Year Historical Data
2018 2017 2016 2015 2014
73.
Development in estimated losses and loss
expenses incurred prior to current year
(Schedule P, Part 2 — Summary, Line 12,
Column 11); USD in 000s
(875)
(1,354)
(1,618)
(1,9
3
5)
(
1,918
)
74.
Percent of development of losses and loss
expenses incurred to policyholders’ surplus of
prior year end (Line 73 divided by Page 4,
Line 21, Column 1 x 100)
(2.8)
(3.8)
(5.0)
(5.6
)
(2.6)
While the AOS only displays the company’s current position within the actuary’s range, the
AOS Instructions require that the actuary state whether the company has experienced one-

FINANCIAL REPORTING THROUGH THE LENS OF A PROPERTY/CASUALTY ACTUARY
Part IV. Statutory Filings to Accompany the Annual Statement
216
year adverse development in excess of 5% of surplus in three or more of the past five years.
This and an explanation are provided in Item E of the AOS. The information contained in Item
E enables the regulator to obtain an understanding of why the company’s recorded reserves
continue to show adverse development over time. The concern, of course, is whether the
company is consistently understating reserves and therefore overstating surplus. Depending
on the result, the information provided in Item E could trigger additional regulatory review in
assessing the company’s financial health. As shown in Table 60, Fictitious’ loss and LAE
reserves have developed favorably in each of the past five years. As a result, Smith has
responded with the following in Item E of his AOS:
E. The Company has not had 1-year adverse development in excess of 5% of
surplus in at least three of the last five calendar years, as measured by
Schedule P, Part 2 Summary, and disclosed in the Five-Year Historical
Data, on line 74, of the Company’s December 31, 2018 statutory-basis
Annual Statement.
In those cases where there has been adverse development in excess of 5% of surplus in three
or more of the last five years, we have seen explanations in Item E vary from providing vague
detail to very specific reasons for the changes. The more detail that can be provided as to the
root cause, the easier time the regulator will have in his or her review.
To illustrate we have provided sample wording in the 2018 AOS of a fictional company that
experienced one-year development in excess of 5% of surplus during 2015 through 2017:
The company had one-year adverse development in excess of 5% of statutory
surplus in three of the past five years. The exceptional values occurred in years
2015 through 2017. The exceptional values resulted from a strengthening in
loss reserves made by management to reflect unexpected trends in asbestos
and environmental claims on excess liability policies written by the company
from 1968 to 1986.
These trends include increased likelihood of exposure to higher-layer policies as
a result of greater than expected emergence of reported claims on underlying
policies, and efforts by insureds to expand coverage periods and expose
additional policies.
It should be noted that in 2018 the company entered into a retroactive
reinsurance agreement whereby 100% of this run-off business is ceded to an
unaffiliated reinsurance company. Going forward, this reinsurance agreement
will mitigate the impact of adverse development of loss reserves on the
company’s statutory surplus.

FINANCIAL REPORTING THROUGH THE LENS OF A PROPERTY/CASUALTY ACTUARY
Part IV. Statutory Filings to Accompany the Annual Statement
217
The regulator reading the above will determine whether additional steps are necessary to
understand the cause of the adverse development and impact on the company’s financial
health. While the regulator may gain comfort that the company’s balance sheet is protected
against future adverse development because of the new reinsurance agreement, we expect
that the regulator would want to understand the potential impact of such development on the
financial health of the company’s unaffiliated reinsurer.

FINANCIAL REPORTING THROUGH THE LENS OF A PROPERTY/CASUALTY ACTUARY
Part IV. Statutory Filings to Accompany the Annual Statement
218
CHAPTER 18. INSURANCE EXPENSE EXHIBIT
OVERVIEW
As discussed in Chapter 4. Primary Financial Statements, the Statement of Income within the
Annual Statement provides a view of an insurance company’s profitability over the past year
on a net of reinsurance basis, but only on an aggregate level for all lines of business
combined. The Insurance Expense Exhibit (IEE) enables a deeper review of an insurance
company’s profitability by showing the components of statutory profit (loss) by line of
business on a direct and net of reinsurance basis.
The IEE is required to be filed by April 1 of the year following the Annual Statement date
(December 31). It contains three parts plus interrogatories. Part I provides an allocation of
the other underwriting expense category within Part 3, Expenses, of the Underwriting and
Investment Exhibit (U&IE) of the Annual Statement. Parts II and III allocate pretax profit by
line of business, on a net and direct written basis, respectively. All dollars are shown in
thousands within the IEE, either by rounding or truncating.
The uses of the IEE are numerous. The following provides some examples:
• Regulators use the IEE as a means for monitoring financial health. Changes or
historical trends in an insurance company’s profitability at the line of business level
may put a strain on the company’s surplus in total, thereby threatening solvency.
• Regulators also use the IEE as a means to monitor rate adequacy. Inadequate rates
also threaten an insurance company’s financial health. Conversely, excessive rates are
also a concern to the regulator as they are unfair to the consumer.
• Stakeholders in general use the IEE as a means to identify those lines of business that
have performed profitably and those that have not in order to make informed business
decisions, such as where to deploy capital and/or where the company should grow.
• An investor might look at the IEE in light of the company’s future growth plans to make
decisions as to how much to invest in the company. Growth into unprofitable lines
might lead the investor to reduce his or her level of investment in the company.
• Actuaries use the IEE as a publicly available source of premium, loss and expense data
for benchmarking company performance by line of business.
As we shall see, there are cautions to using the IEE as described above, and we have
presented several within this chapter.
Throughout our discussion of the IEE, we will continue to use Fictitious Insurance Company in
our examples.

FINANCIAL REPORTING THROUGH THE LENS OF A PROPERTY/CASUALTY ACTUARY
Part IV. Statutory Filings to Accompany the Annual Statement
219
PART I — ALLOCATION TO EXPENSE GROUPS
The National Association of Insurance Commissioners (NAIC) instructions to the
Property/Casualty Annual Statement provide directions for classifying expenses to the 22
operating expense categories provided in Part 3, Expenses, of the U&IE within the Annual
Statement. The instructions provide uniformity in classification of expenses among
property/casualty insurance companies.
The 22 operating expense categories are as follows, by line number per the U&IE, Part 3,
Expenses:
1. Claims adjustment services
2. Commission and brokerage
3. Allowances to managers and agents
4. Advertising
5. Boards, bureaus and associations
6. Surveys and underwriting reports
7. Audit of assureds’ records
8. Salary and related items
9. Employee relations and welfare
10.Insurance
11.Directors’ fees
12.Travel and travel items
13.Rent and rent items
14.Equipment
15.Cost or depreciation of Electronic Data Processing (EDP) equipment and software
16.Printing and stationery
17.Postage, telephone and telegraph, exchange and expenses
18.Legal and auditing
20.Taxes, licenses and fees
21.Real estate expenses
22.Real estate taxes
24.Miscellaneous
Amounts for the above operating expenses are each allocated into the following three
categories (column headings) within the U&IE:
1. Loss Adjustment Expenses
2. Other Underwriting Expenses
3. Investment Expenses
Part 1 of the IEE further allocates other underwriting expenses into the following three
components (column headings):

FINANCIAL REPORTING THROUGH THE LENS OF A PROPERTY/CASUALTY ACTUARY
Part IV. Statutory Filings to Accompany the Annual Statement
220
1. Acquisition, Field Supervision and Collection Expenses
2. General Expenses
3. Taxes, Licenses and Fees
The allocation of other underwriting expenses from the U&IE, Part 3, Expenses, into Part I of
the IEE is as follows:
• All commission and brokerage expenses from line 2 of U&IE, Part 3 should be allocated
to acquisition, field supervision and collection expenses in column 2 of Part I of the
IEE.
• All taxes, licenses and fees from line 20 of U&IE, Part 3 should be allocated to taxes,
licenses and fees in column 4 of Part I of the IEE.
• The remaining operating expenses from lines 3 through 18 of the IEE can be allocated
to acquisition, field supervision and collection expenses in column 2 or general
expenses in column 3 of Part I of the IEE, as applicable.
Part 1 of the IEE looks like Part 3, Expenses, of the U&IE within the Annual Statement, except:
1. There are three columns under the other underwriting expenses heading, rather than
one in total.
2. The operating expense classification line items end with line 25, total expenses
incurred, and therefore do not include amounts unpaid, amounts relating to uninsured
plans or total expenses paid (lines 26 through 30 of U&IE, Part 3).
3. Amounts are reported in thousands of dollars in the IEE rather than in whole dollars as
in the U&IE.
The totals in column 4 of the U&IE, Part 3, line 25 should equal the totals in column 6 of Part I
of the IEE multiplied by 1,000.
Table 61 provides the other underwriting expenses column from Part3, Expenses, of the U&IE
from Fictitious’ 2018 Annual Statement, with the allocation to acquisition, field supervision
and collection expenses, general expenses, and taxes licenses and fees, as in Part I of the
company’s 2018 IEE.

FINANCIAL REPORTING THROUGH THE LENS OF A PROPERTY/CASUALTY ACTUARY
Part IV. Statutory Filings to Accompany the Annual Statement
221
TABLE 61
Annual Statement
Insurance Expense Exhibit
Underwriting and
Other Underwriting Expenses
Investment Exhibit
(USD in 000s)
Part 3
-
Expenses
Part 1
-
Alloca
tion to Expense Groups
Column 2
Column 2
Column 3
Column 4
Operating Expense Classifications
Other
Underwriting
Expenses
Acquisition,
Field
Supervision and
Collection
Expenses
General
Expenses
Taxes,
Licenses and
Fees
2. Commission and brokerage
2.1 Direct excluding contingent
4,759,000
4,759
2.2
Reinsurance assumed, excluding contingent
–
–
2.3
Reinsurance ceded, excluding contingent
816,000
816
2.4
Contingent
-
direct
121,000
121
2.5
Contingent
-
reinsurance assumed
–
–
2.6
Contingent
-
reinsurance ceded
9,000
9
2.7
Policy and membership fees
–
–
2.8
Net commission and brokerage
(2.1 + 2.2 - 2.3 + 2.4 + 2.5 - 2.6 + 2.7) 4,055,000 4,055 – –
3. Allowances to manager and agents
4,000
1
3
4. Advertising
208,000
75
13
3
5. Boards, bureaus and associations
106,000
38
68
6. Surveys and
underwriting reports
99,000
36
63
7. Audit of assureds’ records
–
–
–
8. Salary and related items:
–
–
8.1 Salaries
1,845,000
664
1,181
8.2 Payroll taxes
115,000
41
74
9. Emp
loyee relations and welfare
293,000
105
188
10. Insurance
23,000
8
15
11. Directors' fees
–
–
–
12. Travel and travel items
95,000
34
61
13. Rent and rent items
133,000
48
85
14. Equipment
42,000
15
27
15. Cost or depreciation of EDP equipment
and
software 330,000 119 211
16. Printing and
stationery
19,000
7
12
17. Postage, telephone and telegraph, exchange
and express 112,000 40 72
18. Legal and auditing
14,000
5
9
19. Totals (Lines 3 to 18)
3,438,000
1,236
2,202
–
20.
Taxes, licenses and fees:
20.1
State and local
insurance taxes deducting
guaranty association credits of $1,103 791,000 791
20.2
Insurance department licenses and fees
53,000
53
20.3
Gross guaranty association assessments
(2,000)
(2)
20.4
A
ll other (excluding federal and
foreign income and real estate) 18,000 18
20.5
Total taxes, licenses and fees
(20.1 + 20.2 + 20.3 + 20.4) 860,000 – – 860
21. Real estate expenses
–
22. Real estate
taxes
–
23. Reimbursements by uninsured plans
–
24. Aggregate write
-
ins for miscellaneous
expenses 130,000 47 83
25. Total expenses incurred
8,483,000
5,338
2,285
860

FINANCIAL REPORTING THROUGH THE LENS OF A PROPERTY/CASUALTY ACTUARY
Part IV. Statutory Filings to Accompany the Annual Statement
222
PART II — ALLOCATION TO LINES OF BUSINESS NET OF REINSURANCE
Part II provides the components of total profit (loss) on a pretax basis, net of reinsurance, and
additional information needed to calculate net profit (loss) for the line of business segments
used in the U&IE of the Annual Statement. The line of business segments differ slightly from
the U&IE in the following ways:
• Allied lines are broken down into further components in the IEE as:
2.1 Allied lines
2.2 Multiple peril crop
2.3 Federal flood
• Commercial multiple peril is broken down into further components in the IEE as:
5.1 Commercial multiple peril (non-liability portion)
5.2 Commercial multiple peril (liability portion)
• Medical professional liability occurrence and claims-made lines are combined in the IEE
into line 11, as are the corresponding product liability lines into line 18.
• Auto physical damage is broken down into further segments in the IEE as:
21.1 Private passenger auto physical damage
21.2 Commercial auto physical damage
• Reinsurance lines 31 through 33 are summed in the IEE.
Line 35 of the IEE provides the totals for all lines of business in lines 1 through 34.
Similar to the U&IE, the line of business segments are displayed in the first column of the IEE,
with the components of profit (loss) and additional items in the remaining columns, providing
the amounts (or percentages) for each line of business. These components and additional
items are as follows:
• Net premiums written
• Net premiums earned
• Dividends to policyholders
• Incurred:
• Loss
• Defense and cost containment (DCC)
• Adjusting and other (A&O) expenses
• Unpaid:
• Loss
• DCC
• A&O expenses

FINANCIAL REPORTING THROUGH THE LENS OF A PROPERTY/CASUALTY ACTUARY
Part IV. Statutory Filings to Accompany the Annual Statement
223
• Unearned premium reserves
• Agents’ balances
• Other underwriting expenses:
• Commission and brokerage expenses incurred
• Taxes, licenses and fees incurred
• Other acquisitions, field supervision and collection expenses incurred
• General expenses incurred
• Other income less other expenses
• Pre-tax profit or loss excluding all investment gain
• Investment gain on funds attributable to insurance transactions
• Profit or loss excluding investment gain attributable to capital and surplus
• Investment gain attributable to capital and surplus
The above items are organized in two columns: the first containing the dollar amount and the
second providing the ratio of the dollar amount to premiums earned. There are 42 columns:
21 provide dollar amounts (odd-numbered columns) and 21 provide percentages to earned
premium (even-numbered columns).
Total profit (loss) is calculated using the same components as in the Statement of Income,
with the exception that the IEE is on a pretax basis. Most of the aforementioned components
used to compute pretax profit (loss) either reconcile directly to exhibits within the Annual
Statement, or are reasonably straightforward for companies to compute.
115
However, the
calculation of investment gain is not straightforward, as the allocation of investment gain by
line of business is not intuitive.
We will discuss the computation of each component (odd-numbered columns), reconciling to
Annual Statement exhibits, and provide example(s) as to how to calculate investment gain.
We will not address the even-numbered columns, other than to say that they represent the
ratio of the dollar amount to net earned premium, on a line-by-line basis.
There are numerous ways to estimate profit by line of business; the approach used by the
NAIC for the IEE is only one of them. The NAIC approach is a retrospective one. It allocates
total profit that has emerged rather than providing an estimate of future profit, as is used in
pricing insurance policies.
Further, the allocation of surplus by line of business does not consider how much surplus is
needed to support the line, as is the intention in pricing insurance policies and capital
115
According to page 419 of the 2018 NAIC Annual Statement Instructions Property/Casualty, “In instances where
the reporting entity cannot allocate amounts to lines of business by direct and accurate allocation, the methods of
allocation stated in the Uniform Classification of Expenses found in the Appendix of the NAIC Annual Statement
Instructions must be used. Where the instructions do not define means of allocation, a reasonable method of
allocation must be applied and disclosed in Interrogatory 4.”

FINANCIAL REPORTING THROUGH THE LENS OF A PROPERTY/CASUALTY ACTUARY
Part IV. Statutory Filings to Accompany the Annual Statement
224
modeling. Rather, as we shall see, the entire amount of surplus is allocated by line based on
the level of the company’s reserves (loss and unearned premium) and earned premium, which
do not necessarily measure the inherent risk of a particular line of business. Good examples
are catastrophe-exposed short-tailed lines, such as homeowners. In non-catastrophe years,
the reserves for these lines may be relatively small because claims are reported and paid out
relatively quickly when compared to longer-tailed casualty lines. However, as the
property/casualty insurance industry observed in 2018, this short-tailed line of business is
exposed to considerable risk. We shall see this in our examples for Fictitious. Therefore,
caution should be made when reviewing and placing reliance on the results of the IEE
calculations of surplus and profit by line of business for pricing or capital allocation purposes.
Columns 1 through 32
The following components or items within Part II reconcile directly to the U&IE within the
Annual Statement by line of business as follows:
TABLE 62
IEE Part II
Reconciles
to
U&IE
Column
Colu
mn
Number
Heading
Part
Heading
Number
1 Premiums Written --------> 1B Net Premiums Written 6
3 Premiums Earned --------> 1 Premiums Earned During Year 4
7 Incurred Loss --------> 2 Losses Incurred Current Year 7
13 Unpaid Losses --------> 2A Net Losses Unpaid 8
19 Unearned Premium Reserves --------> 1A
Total Reserve for Unearned
premiums 5
Dividends to policyholders in column 5 reconcile in total to the amount in the Statement of
Income of the Annual Statement, line 17. The allocation by line of business is based on the
policies eligible and receiving dividends or on a company’s formulaic determination if the line
of business per the policy does not correspond directly to a line of business in the Annual
Statement.
116
Loss adjustment expense (LAE), provided separately for DCC and A&O expenses incurred and
unpaid, in columns 9, 11, 15 and 17 of the IEE, cannot be found within the Annual Statement
for the line of business breakdowns required in the IEE. However, insurance companies track
expenses by line of business and therefore know which expenses are allocated to which lines.
In total, the LAE incurred amounts in columns 9 plus 11 reconcile to the Statement of Income,
line 3, column 1 (current year) and Part 3 of the U&IE, line 25, column 1. The LAE unpaid
116
Feldblum, S., “The Insurance Expense Exhibit and the Allocation of Investment Income” (Fifth Edition), CAS
Study Note, May 1997, page 32.

FINANCIAL REPORTING THROUGH THE LENS OF A PROPERTY/CASUALTY ACTUARY
Part IV. Statutory Filings to Accompany the Annual Statement
225
amounts reconcile to page 3 of the Annual Statement, line 3, column 1 (current year) and
Part 2A of the U&IE, line 35, column 9.
Like policyholder dividends, insurance companies know which lines agents’ balances stem
from and therefore can allocate the amounts directly in column 21. The amounts should
agree to balances included within lines 15.1 plus 15.2, column 3 of the Assets page of the
Annual Statement.
Other underwriting expenses in columns 23, 25, 27 and 29 reconcile directly to Part I of the
IEE.
Other income less other expenses in column 31 of the IEE reconciles in total to line 15 minus
line 5 of the Statement of Income. Line 15 of the Statement of Income provides total other
income incurred, and line 5 provides aggregate write-ins for underwriting deductions. The
allocation by line is performed directly by accumulating the sources of other income and
underwriting deductions on specific policies and mapping the income/deductions by policy to
the Annual Statement lines of business.
Calculation of Pretax Profit or Loss Excluding All Investment Gain (Column 33)
Column 33 provides pretax profit (loss) excluding all investment gains and is calculated from
the information contained in the previous columns of Part II of the IEE as follows:
Pretax profit (loss) excluding all investment gains =
Premiums earned (column 3)
- Dividends to policyholders (column 5)
- Incurred loss (column 7)
- DCC expenses incurred (column 9)
- A&O expenses incurred (column 11)
- Commission and brokerage expenses incurred (column 23)
- Taxes, licenses and fees incurred (column 25)
- Other acquisitions, field supervision and collection expenses incurred (column 27)
- General expenses incurred (column 29)
+ Other income less other expenses (column 31).
Simply put, pretax profit equals inflows of earned revenue minus outflows of incurred
expenses.
The total amount in column 33 reconciles to line 18 (net income after dividends to
policyholders, after capital gains tax and before all other federal and foreign income taxes)
minus line 11 (net investment gain (loss)) of the Statement of Income.
Table 63 demonstrates the calculation of column 33 of Part II of the IEE in total and shows
the reconciliation to the Statement of Income within the Annual Statement for Fictitious in

FINANCIAL REPORTING THROUGH THE LENS OF A PROPERTY/CASUALTY ACTUARY
Part IV. Statutory Filings to Accompany the Annual Statement
226
2018. Recall that figures in the IEE are provided in thousands; any differences from the
Statement of Income are due to rounding errors.
TABLE 63
Data from Fictitious Insurance Company 201
8
IEE (USD in 000s) for All Lines of Business
Column
Total
Number
IEE Part II
Column Heading
Line 35
Statement of Income Reference
3
Premiums Earned
26,512
Line 1
5
Dividends to Policyholders
46
Line 17
7
Incurred Loss
16,907
Line 2
9
Defense and Cost Containment Expenses
Incurred
1,671
11
Adjusting and Other Expenses
Incurred
1,585
Subtotal Loss Adjustment Expenses Incurred
3,256
Line
3
23
Commissions and Brokerage Expenses Incurred
4,055
25
Taxes, Licenses and Fees Incurred
860
27
Other Acquisitions, Field Supervision and Collection
Expenses Incurred 1,283
29
General Expenses
Incurred
2,285
Subtota
l Other Underwriting Expenses
Incurred
8,483
Line 4
31
Other
Income
Less Other Expenses
33
Line 15 minus Line 5
33
Pre
-
Tax Profit or Loss Excluding All Investment Gain
(2,147)
= Line 1
-
Lines
17, 2, 3, 4 + Line 15
As displayed in Table 63, Fictitious operated at a pretax loss (before any gains or losses from
investments) of $2.1 million in 2018, most of which was due to underwriting (underwriting
loss totaled $2.1 million as per line 8 of the Statement of Income). Net incurred loss and LAE
during 2018 was $4.4 million higher than that incurred in 2017, with less than $1 million
more in net earned premium. As previously explained, this was due to the high frequency of
catastrophe losses incurred by Fictitious in 2018, compared to a relatively benign
catastrophe year for Fictitious in 2017.
Of the $2.1 million pretax loss (before investment gain), $1.2 million stems from the
homeowners of business. Homeowners is the largest line of business written by the company
in terms of net written premium volume ($4.6 million per column 1 of the IEE, Part II).
Further, the homeowners line was hit hardest by the catastrophe losses in 2018. Given its
significance to the 2018 results, we will use homeowners as the line of business example for
computing total profit or loss for Fictitious.
The remaining columns, columns 35 through 41, are determined formulaically and are the
crux of Part II of the IEE.
Overview of the Calculation of Total Profit or Loss (Column 41)
Column 41 provides total profit (loss) on a pretax basis to an insurance company for each line
of business. It is computed by taking pretax profit (loss) before any investment gain and
adding investment gains.

FINANCIAL REPORTING THROUGH THE LENS OF A PROPERTY/CASUALTY ACTUARY
Part IV. Statutory Filings to Accompany the Annual Statement
227
Column 41 of the IEE is equal to net income as calculated in the Statement of Income within
the Annual Statement, except all amounts in the IEE are gross of taxes. Column 41 reconciles
to line 18 (net income after dividends to policyholders, after capital gains tax and before all
other federal and foreign income taxes) plus the amount of capital gains tax provided in line
10 (Net realized capital gains (losses) less capital gains tax) of the Statement of Income.
Capital gains taxes are added back to the calculation simply because total profit is shown on a
pretax basis.
Table 64 demonstrates the calculation of column 41 of Part II of the IEE in total and shows
the reconciliation to the Statement of Income within the Annual Statement for Fictitious in
2018.
TABLE 64
Data from Fictitious Insurance Company 201
8
IEE (USD in 000s) for All Lines of Business
Column
Total
Number
IEE Part II Column Heading
Line 35
Sta
tement of Income Reference
33
Pre
-
tax Profit or Loss Excluding All Investment Gain
(2,147)
= Line 1
-
Lines 17, 2, 3, 4 + Line 15
35
Investment Gain on Funds Attributable to Insurance
Transactions 2,663
39
Investment Gain Attributable to
Capital and
Surplus
1,741
Subtotal Net Investment Gain (Loss)
Before
Capital
Gains Tax 4,404 Line 11 + Capital Gains Tax of $99 per Line 10
41
Total Profit or Loss
2,257
Line 18 + Capital Gains Tax of $99 per Line 10
As displayed in Table 64, net investment gain (loss) ($4.4 million) more than offset the
Fictitious’ underwriting loss in 2018.
The same formula is used to calculate total profit or loss (column 41) for each line of
business. The tricky part, of course, is how to allocate the net investment gain (loss) by line of
business and between funds attributable to insurance transactions versus those attributable
to capital and surplus. The following provides an overview of the allocation procedure, with
details in the subsequent sections.
The first step of the calculation is to determine the ratio of net investment gain (loss) to total
investable assets then apply that ratio to investable assets by line of business. This
calculation provides net investment gain (loss) by line. The ratio of net investment gain (loss)
to total investable assets is called the net investment gain ratio.
The second step is to apply the net investment gain ratio to funds attributable to insurance
transactions by line of business. This calculation provides investment gain on funds
attributable to insurance transactions in column 35.
Investment gain attributable to capital and surplus in column 39 is computed as the difference
between net investment gain (loss) and investment gain on funds attributable to insurance
transactions in column 35. Formulaically, for each line of business,

FINANCIAL REPORTING THROUGH THE LENS OF A PROPERTY/CASUALTY ACTUARY
Part IV. Statutory Filings to Accompany the Annual Statement
228
Investment gain attributable to capital and surplus (column 39) =
Net investment gain (loss)
117
- Investment gain on funds attributable to insurance transactions (column 35).
As indicated, both of the inputs in the calculation of investment gain attributable to capital
and surplus (column 39) are determined by applying the ratio of net investment gain (loss) to
total investable assets for all lines of business to the applicable investable funds (either in
total or attributable to insurance transactions) associated with the particular line of business.
Net Investment Gain Ratio
The net investment gain ratio is the ratio of net investment gain (loss) to total investable
assets. Total investable assets equal the sum of net loss and LAE reserves, net unearned
premium reserves, ceded reinsurance payable and policyholders’ surplus, minus agents’
balances. These amounts are intended to be a proxy for investable assets as they are
amounts that are available for investment by the insurance company.
118
Agents’ balances are
subtracted in the formula because they are not investable assets.
In the calculation of total investable assets, the mean of the aforementioned amounts are
used (i.e., average of the prior year and current year) because investment income during the
year is earned on reserves and surplus throughout the year, rather than a fixed point in time.
Formulaically, the net investment gain ratio is calculated as follows, for all lines of business in
total:
Net investment gain ratio =
Net investment gain (loss)
Total investable assets
where,
Total investable assets =
Mean net loss and LAE reserves
+ Mean net unearned premium reserves
+ Mean ceded reinsurance premiums payable
+ Mean policyholders’ surplus
- Mean agents’ balances.
117
The calculation of net investment gain (loss) is provided in subsequent paragraphs below.
118
Going back to basics, admitted assets minus liabilities equals surplus. Or equivalently, admitted assets equals
liabilities plus surplus. Reserves and ceded reinsurance payables are liabilities that the insurance carrier must hold.
As with surplus, the company can invest the assets backing these liabilities. They are therefore used in the
calculation to represent investable assets.

FINANCIAL REPORTING THROUGH THE LENS OF A PROPERTY/CASUALTY ACTUARY
Part IV. Statutory Filings to Accompany the Annual Statement
229
Table 65 demonstrates the calculation of the net investment gain ratio based on 2018 Annual
Statement data for Fictitious.
TABLE 65
Data from Fictitious Insurance Company 201
8
IEE and Annual Statement
(USD in 000s)
2018 2017
201
8
IEE
Part II
All Lines of Business
Current
Year
Prior
Year Mean
Total,
Line 35 Annual Statement
(1)
Net Investment Gain Ratio
5.0%
= (2) current year divided by
(3) mean
(2)
Net Investment Gain (loss)
before Capital Gains Tax
4,404
Statement o
f Income Page 4,
Line 11 plus Capital Gains Tax
of $99 per Line 10
(3)
Investable Assets
87,
540
87,
0
8
0
87,
310
= (4) + (5) + (6) + (7) + (8)
-
(9)
(4)
Net Loss Reserve
41,894
40,933
41,414
Column (13)
U&IE, Part 2A, Total line,
Column 8, divided by 1,000
(5)
Net Loss Adjustment Expense
Reserve
9,663
9,664
9,664
Column
(15) + (17)
U&IE, Part 2A, Total line,
Column 9, divided by 1,000
(6)
Net Unearned Premium
Reserve
11,
691
11,
451
11,
571
Column
(19)
U&IE, Part 1A, Total line 3
5
,
Column 4, divided by 1,000
(7)
Policyholders’ Surplus
31,024
31,608
31,316
Liabilities
, Surplus and Other
Funds, Page 3, Line 37, divided
by 1,000
(8)
Ceded Reinsurance Premiums
Payable
440
608
524
Liabilities, Surplus and Other
Funds, Page 3, Line 12, divided
by 1,000
(9)
Agents’ Balances
7,172
7,184
7,178
Column (21)
Equals the portion of Assets
Line 15.1 plus 15.2, divided by
1,000, for Agents’ Balances
As displayed above, the 2018 investment gain ratio for Fictitious was 5%. This means the
company earned 5% on its “investable assets” during 2018.
Net Investment Gain (Loss) by Line of Business
Net investment gain (loss) by line of business is determined as the investment gain ratio
multiplied by total investable assets for that line of business.

FINANCIAL REPORTING THROUGH THE LENS OF A PROPERTY/CASUALTY ACTUARY
Part IV. Statutory Filings to Accompany the Annual Statement
230
Net investment gain (loss) for a particular line of business =
Net investment gain ratio (for all lines)
* Total investable assets for the line of business
where,
Total investable assets for the line of business =
Mean net loss and LAE reserves for the line of business
+ Mean net unearned premium reserves for the line of business
+ Mean ceded reinsurance premiums payable for the line of business
+ Mean policyholders’ surplus for the line of business
- Mean agents’ balances for the line of business.
Table 66 demonstrates the calculation of the net investment gain for the homeowners line of
business based on 2018 Annual Statement and IEE data for Fictitious.
TABLE 66
Data from Fictitious Insurance Company 201
8
IEE and Annual Statement
(USD in 000s)
2018 2017
201
8
IEE
Part II
Line of Business: Homeowners
Multiple Peril
Current
Year
Prior
Year Mean
Total,
Line 35 Annual Statement (AS)
(1)
Investment Gain for Line of
Business
232
Column (35)
= (3) Current Year * (3) Mean
(2)
Net Investment Gain Ratio (all
lines of business)
5.0%
Calculated in Table 65
(3)
Invest
able Funds for Line of
Business
4,603
= (4) + (5) + (6) + (7)
-
(8) + (9)
(4)
Net Loss Reserve for Line of
Business
1,311
1,161
1,236
Column (13)
U&IE, Part 2, Line 4, Columns 5
and 6, divided by 1,000
(5)
Net Loss Adjustment Expense
Reserve for Line of Business
144
170
157
Column (15)
+ (17)
U&IE, Part 2A, Line 4, Column 9,
divided by 1,000; and prior year
AS
(6)
Net Unearned Premium
Reserve for Line of Business
2,401
2,290
2,346
Column (19)
U&IE, Part 1A, Line 4, Column 5,
divided by 1,000; and prior year
AS
(7)
Ceded Reinsurance Premiums
Payable for Line of Business
21
3
12
Calculated in Table 67
(8)
Agents’ Balances for Line of
Business
1,901
2,134
2,018
Column (21)
IEE, Column 21,
line 4 provided
in each of the 2018 and 2017
AS
(9)
Surplu
s Allocable to Line of
Business
2,869
Calculated in Table 69
As displayed in Table 66, $232,000 of the company’s total $4.4 million in net investment
gain during 2018 was allocated to the homeowners line using the NAIC’s approach.
The net loss and LAE reserves, unearned premium reserves and agents’ balances by line of
business used in the above calculation come from columns 13, 15, 17, 19 and 21 of the IEE,

FINANCIAL REPORTING THROUGH THE LENS OF A PROPERTY/CASUALTY ACTUARY
Part IV. Statutory Filings to Accompany the Annual Statement
231
current year and prior year, respectively. Ceded reinsurance premiums payable by line and
policyholders’ surplus by line, are calculated separately.
Ceded Reinsurance Premiums Payable by Line of Business
Ceded reinsurance premiums payable are allocated to line of business based on the
distribution of ceded written premiums by line. Formulaically, the calculation is as follows:
Ceded reinsurance premiums payable for the line of business =
Ceded written premiums for the line of business * Total ceded reinsurance premiums payable.
Total ceded written premiums
Table 67 demonstrates the calculation of Fictitious’ ceded reinsurance premiums payable for
homeowners.
TABLE 67
Data from Fictitious Insurance Com
pany 201
7
and 201
8
Annual Statement
(USD in 000s)
2018 2017
201
8
IEE
Part II
Line of Business: Homeowners
Multiple Peril
Current
Year
Prior
Year Mean
Total,
Line 35 Annual Statement (AS)
(1)
Ceded Reinsurance Premiums
Payable for Line of Business
21
3
12
N/A
= (4) * (5)
(2)
Ceded Premiums Written
for
Line of Business
91
12
N/A
U&IE, Part 1B, Line 4,
Columns 4 + 5, divided by
1,000; and prior year AS
(3)
Ceded Premiums Written,
Total
1,882
2,149
N/A
U&IE, Part 1B, Totals,
Columns 4 + 5, divided by
1,000; and prior year AS
(4)
Ratio of Ceded Pr
emiums
Written for Line of Business to
Total
4.8%
0.6%
N/A
= (2) / (3)
(5)
Ceded Reinsurance Premiums
Payable, Total
440
608
N/A
Liabilities
, Surplus and Other
Funds, Page 3, Line 12,
divided by 1,000
The mean ceded reinsurance payable for homeowners that was used in the calculation of
Fictitious’ total investable assets for homeowners was $12 (dollars in thousands).
Policyholders’ Surplus by Line of Business
The NAIC allocates surplus to line of business in proportion to the sum of net loss and LAE
reserves, net unearned premium reserves and net earned premium. The mean values are
used in the calculation of the balance sheet figures (reserves), while the current-year value is
used for the income statement figure (net earned premium).

FINANCIAL REPORTING THROUGH THE LENS OF A PROPERTY/CASUALTY ACTUARY
Part IV. Statutory Filings to Accompany the Annual Statement
232
The first step in the calculation is to compute the ratio of mean policyholders’ surplus to the
sum of mean net loss and LAE reserves, mean net unearned premium reserves and current
year net earned premiums, in total for all lines combined. This ratio is called the surplus ratio.
Surplus ratio =
Mean policyholders’ surplus in total divided by
[Mean net loss and LAE reserves in total
+ Mean net unearned premium reserves in total
+ Current year net earned premium in total].
Table 68 demonstrates the calculation of the 2018 surplus ratio for Fictitious.
TABLE 68
Data from Fictitious Insurance Company 201
8
IEE and 201
7
and 201
8
Annual Statement
(USD in 000s)
2018 2017
201
8
IEE
Part II
All Lines of Business
Current
Year
Prior
Year Mean
Total,
Line 35 Annual Statement (AS)
(1)
Surplus Ratio
35.1%
= (2) / [Sum of means of (3)
through (5) plus (6) for
current year]
(2)
Policyholders’ Surplus
31,024
31,608
31,316
Liabilities, Surplus and Other
Funds, Page 3, Line 37,
Columns 1 and 2,
respectively, divided by 1,000
(3)
Net Loss Reserve
41,894
40,933
41,414
Column (13)
U&IE, Part 2A,
Total line,
Column 8, divided by 1,000;
and prior year AS
(4)
Net Loss Adjustment Expense
Reserve
9,663
9,664
9,664
Column (15) +
(17)
U&IE, Part 2A, Total line,
Column 9, divided by 1,000;
and prior year AS
(5)
Net Unearned Premium
Reserve
11,
691
11,
451
11,
571
Column (19)
U&IE, Part 1A, Total line 3
5
,
Column 4, divided by 1,000;
and prior year AS
(6)
Net Earned Premium
26,512
Column (3)
U&IE, Part 1, Total line 35,
Column 4, divided by 1,000
The surplus ratio for Fictitious was 35.1% in 2018.
The surplus ratio is then applied to the applicable mean balance sheet amounts and the
income statement amount (earned premium) for the current year for the particular line of
business to determine the amount of surplus allocated to that line.
Surplus allocated to line of business =
Mean surplus ratio (for all lines) multiplied by
[Mean net loss and LAE reserves for the line of business
+ Mean net unearned premium reserves for the line of business
+ Current year net earned premium for the line of business].

FINANCIAL REPORTING THROUGH THE LENS OF A PROPERTY/CASUALTY ACTUARY
Part IV. Statutory Filings to Accompany the Annual Statement
233
Table 69 shows the application of the surplus ratio in determining the amount of surplus
allocated to Fictitious’ homeowners line of business.
TABLE 69
Data fr
om Fictitious Insurance Company 201
8
I
EE and 201
7
and 201
8
Annual Statement
(USD in 000s)
2018 2017
201
8
IEE
Part II
Line of Business: Homeowners
Multiple Peril
Current
Year
Prior
Year Mean
Total,
Line 35 Annual Statement (AS)
(1)
Surplus Allocable to Line of
Business
2,8
72
= (2) * [ Sum of means of (3)
through (5) plus (6) for
current year]
(2)
Surplus Ratio
35.1%
Calculated in Table 68
(3)
Net Loss Reserve for Line of
Business
1,311
1,161
1,236
U&IE, Part 2, Line 4, Columns
5 and 6, divided by 1,000
(4)
Net Loss Adjustment Expense
Reserve for Line of Business
144
170
157
U&IE, Part 2A, Line 4, Column
9, divided by 1,000; and prior
year AS
(5)
Net Unearned Premium
Reserve for Line of Business
2,401
2,290
2,346
U&IE, Part 1A, Line 4, Column
5, divided by 1,000; and prior
year AS
(6)
Net Earned Premium for Line
of Business
4,445
Column (3)
U&IE, Part 1, Line 4, Column
4, divided by 1,000
As displayed in Table 69, $2.9 million of the Fictitious’ total $31 million in policyholders’
surplus at year-end 2018 was allocated to the homeowners line using the NAIC’s allocation
approach. Stated differently, less than 10% of the company’s policyholders’ surplus was
allocated to homeowners using the IEE allocation. This exemplifies the caution noted earlier in
relying on this method for prospective pricing or even retrospective evaluation of
profitability. Given the catastrophe risk inherent in this line of business, which is quite evident
based on 2018 experience, one might expect more than 10% of the surplus to be allocated to
this line. To provide some perspective, in 2018 we saw that homeowners contributed more
than 50% of the company’s underwriting loss. If the IEE allocation is used in pricing for
Fictitious, the rates will be inadequate and could eventually result in the insolvency of
Fictitious.
Investment Gain by Line of Business Attributable to Insurance Transactions
Investment gain attributable to insurance transactions is allocated to line of business by
applying the net investment gain ratio to funds attributable to insurance transactions for the
particular line. Funds attributable to insurance transactions for a particular line are equal to
the sum of mean net loss and LAE reserves, mean net unearned premium reserves and mean
ceded reinsurance premiums payable for that line, reduced by agents’ balances and the
portion of prepaid expenses in the unearned premium reserves.

FINANCIAL REPORTING THROUGH THE LENS OF A PROPERTY/CASUALTY ACTUARY
Part IV. Statutory Filings to Accompany the Annual Statement
234
Funds attributable to insurance transactions for the line of business =
Mean net loss and LAE reserves for the line of business
+ Mean net unearned premium reserves for the line of business
+ Mean ceded reinsurance premiums payable for the line of business
- Mean agents’ balances for the line of business
- Prepaid expenses in the unearned premium reserves.
The elements that go into the calculation of funds attributable to insurance transactions differ
from total investable funds in two ways. First, mean policyholders’ surplus is not included in
the calculation of funds attributable to insurance transactions. This is because here the focus
is on funds attributed to insurance transactions and not to capital and surplus. Second,
prepaid expenses in the unearned premium reserves are not included in the calculation
because they are not an investable asset; they have already been expensed. These expenses
were not explicitly removed in the calculation of total investable funds because they are
already out of policyholders’ surplus, which is a component of the calculation.
Table 70 provides the calculation of investment gain attributable to insurance transactions
for Fictitious’ homeowners line.

FINANCIAL REPORTING THROUGH THE LENS OF A PROPERTY/CASUALTY ACTUARY
Part IV. Statutory Filings to Accompany the Annual Statement
235
TABLE 70
Data from Fictitious Insurance Company 201
8
IEE and 201
7
and 201
8
Annual State
ment
(USD in 000s)
2018 2017
201
8
IEE
Part II
Line of Business: Homeowners
Multiple Peril
Current
Year
Prior
Year Mean
Total,
Line 35 Annual Statement (AS)
(1)
Investment Gain on Funds
Attributable to Insurance
Transactions for Line of
Business
53
Column (35)
= (2) Current Year * (3)
Mean
(2)
Net Investment Gain Ratio (all
lines of business)
5.0%
Calculated in Table 6
5
(3)
Funds Attributable to
Insurance Transactions for
Line of Business
1,283
829
1,056
= (4) + (5) + (6) + (7)
-
(9)
-
[(6) * (8)]
(4)
Net Loss Reserve for Line of
Business
1,311
1,161
1,236
Column (13)
U&IE, Part 2, Line 4,
Columns 5 and 6, divided by
1,000
(5)
Net Loss Adjustment Expense
Reserve for Line of Business
144
170
157
Column (15) +
(17)
U&IE, Part 2A, Line 4,
Column 9, divided by 1,000;
and prior year AS
(6)
Net Unearned Premium
Reserve for Line of Business
2,401
2,290
2,346
Column (19)
U&IE, Part 1A, Line 4,
Column 5, divided by 1,000;
and prior year AS
(7)
Ceded Reinsurance Premiums
Payable for Line of Business
21
3
12
Calculated in Table 67
(8)
Prepaid Expense Ratio
29%
Calculated in Table 71
(9)
Agents’
Balances for
Line of
Business
1,901
2,134
2,01
8
Column (21)
As displayed in Table 70, $53,000 of the company’s total $232,000 in net investment gain
on the homeowners line was attributed to gains on insurance transactions using the NAIC
approach.
Prepaid Expense Ratio
The ratio that is used to determine the amount of unearned premium reserves representing
prepaid expenses is calculated for each line of business separately. It is the ratio of net
acquisition expenses to net written premiums (column 1). Net acquisition expenses are
calculated as the sum of commissions and brokerage expenses incurred (column 23); taxes,
licenses and fees incurred (column 25); other acquisition, field supervisions and collection
expenses incurred (column 27); and half of the general expenses incurred (50% of column
29).

FINANCIAL REPORTING THROUGH THE LENS OF A PROPERTY/CASUALTY ACTUARY
Part IV. Statutory Filings to Accompany the Annual Statement
236
The prepaid expense ratio for homeowners is calculated for Fictitious in Table 71.
TABLE 71
Data from Fictitious
Insurance Company 201
8
IEE and 201
7
and 201
8
Annual Statement
(USD in 000s)
2018 2017
201
8
IEE
Part II
Line of Business: Homeowners
Multiple Peril
Current
Year
Prior
Year Mean
Total,
Line 4 Annual Statement
(1)
Prepaid Expense Ratio
29%
= (2) / (7)
(2)
Net Acquisition Expenses for
Line of Business
1,3
15
= (3) + (4) + (5) + 50% of (6)
(3)
Commissions and Brokerage
Expenses Incurred for Line of
Business
867
Column (23)
(4)
Taxes, Licenses and Fees
Incurred for Line of Business
130
Column (25)
(5)
Other Acquisitions, Field
Supervision and Collection
Expenses Incurred for Line of
Business
169
Column (27)
(6)
General Expenses
Incurred for
Lines of Business
298
Column (29)
(7)
Net Written Premium for Line
of Business
4,555
Column (1)
The prepaid expense ratio for Fictitious was 29% in 2018.
Investment Gain by Line of Business Attributable to Capital and Surplus
The difference between net investment gain (loss) and the amount of investment gain
attributed to insurance transactions is the amount of investment gain attributable to capital
and surplus. Table 72 provides this calculation for Fictitious.
TABLE 72
Data from Fictitious Insurance Company 201
8
IEE (USD in 000s)
2018 2017
201
8
IEE
Part II
Line of Business: Homeowners
Multiple Peril
Current
Year
Prior
Year Mean
Total,
Line 35 Annual Statement
(1)
Investment Gain
Attributable to Capital
and Surplus for Line of
Business
179
Column (39)
= (2)
-
(3)
(2)
Investment Gain for Line
of Business
232
Calculated in a Table
66
(3)
Investment Gain on Funds
Attributable to Insurance
Transactions for Line of
Business
53
Column (35)
Calculated in Table 70

FINANCIAL REPORTING THROUGH THE LENS OF A PROPERTY/CASUALTY ACTUARY
Part IV. Statutory Filings to Accompany the Annual Statement
237
As displayed in Table 72, the amount of investment gain attributable to capital and surplus for
homeowners was $179,000.
Total profit or loss
Finally, column 41 provides total profit (loss) by line of business. Table 73 demonstrates the
calculation of total profit in 2018 for Fictitious’ homeowners line. First, we will provide the
calculation of pretax profit excluding all investment gain for homeowners, as shown in column
33. Then we will add the components of net investment gain in columns 35 and 39 to
compute total profit in column 41.
Pretax profit excluding all investment gain is first computed for Fictitious’ homeowners line of
business as follows in Table 73.
TABLE 73
Data from Fictitious Insurance Company 201
8
IEE (USD in 000s)
for Homeowners Multiple Peril
Column Total
Number IEE Part II Column Heading Line 4 Notes
3 Premiums Earned 4,445
5 Dividends to Policyholders -
7 Incurred Loss 3,789
9 Defense and Cost Containment Expenses Incurred 74
11 Adjusting and Other Expenses Incurred 360
23 Commissions and Brokerage Expenses Incurred 867
25 Taxes, Licenses and Fees Incurred 130
27
Other Acquisitions, Field Supervision and Collection Expenses
Incurred 169
29 General Expenses Incurred 298
31 Other Income Less Other Expenses 1
33
Pre
-
Tax Profit of Loss Excluding All Investment Gain
(1,241)
= Column
3
minus Columns 5,
7, 9, 11, 23,25, 27, 29 plus
Column 31
As displayed in Table 73, the NAIC allocation formula shows that Fictitious experienced a
pretax loss of $1.2 million on its homeowners book in 2018, nearly all of which came from
underwriting (since other income is $1).
The calculation of column 41 of Part II of the IEE shows that investment gains only offset
$232,000 of the $1.2 million underwriting loss, such that homeowners showed an overall
loss, after investment gain, of $1.0 million.

FINANCIAL REPORTING THROUGH THE LENS OF A PROPERTY/CASUALTY ACTUARY
Part IV. Statutory Filings to Accompany the Annual Statement
238
TABLE 74
Data from Fictitious Insurance Company 201
8
IEE (USD in 000s)
for Homeowners Multiple Peril
Column
Total
Number
IEE
Part II Column Heading
Line 35
Statement of Income Referen
ce
33
Pre
-
Tax Profit or Loss Excluding All Investment Gain
(1,241)
35
Investment Gain on Funds Attributable to Insurance
Transactions 53
39
Investment Gain Attributable to Capital and
Surplus
179
Subtotal Net Investment Gain (loss)
before
Capital
Gains
Tax 232
41
Total Profit or Loss
(1,009)
42
%
22.7%
= Column 41 divided by Column 3
Out of the total $2.3 million in pretax profit for all lines earned by Fictitious in 2018, $(1.0)
million was allocated to homeowners based on the NAIC calculation. This represents -23% of
net earned premium in 2018. A review of column 41 of IEE shows that Fictitious also
experienced pretax losses in the other liability, automobile physical damage and fidelity lines.
Profits were earned in other lines to absorb the losses in these lines of business, the largest of
which was achieved in workers’ compensation ($3.3 million). This is why companies diversify
insurance risks across property/casualty lines of business; the intent is that any losses would
be offset by gains.
PART III — ALLOCATION TO LINES OF BUSINESS DIRECT
Part III provides the components of direct profit (loss) on a pretax basis, excluding investment
gain. Investment gain is not considered because investment income is earned on the actual
assets held by the company, which are net of reinsurance.
Different from Part II, the components used to compute profit (loss) in Part III are not readily
available from the Annual Statement as presented. Unless assigned with the task of
completing the IEE for their employer, most students will not use the information contained in
Part III of the IEE. This publication is not intended to be an instruction manual for completing
the IEE. As a result, we will only provide a brief discussion of the computation of each
component, reconciling to Annual Statement exhibits when possible.
Columns 1 through 32
As with Part II, the even columns of Part III of the IEE provide the percent of the
corresponding amounts in the odd-numbered columns to earned premium, in this case on a
direct basis.
Direct premiums written in column 1 reconcile to Part 1B, Premiums Written, column 1, of the
U&IE. Direct premiums written also reconcile to column 1 of the Exhibit of Premiums and
Losses (Statutory Page 14 Data) by line and in total to Schedule T, column 2, line 59.

FINANCIAL REPORTING THROUGH THE LENS OF A PROPERTY/CASUALTY ACTUARY
Part IV. Statutory Filings to Accompany the Annual Statement
239
Direct premiums earned in column 3 reconcile to column 2 of the Exhibit of Premiums and
Losses (Statutory Page 14 Data) by line, for all states plus any alien business, and in total to
Schedule T, column 3, line 59.
Dividends to policyholders in column 5 should agree to line 17 of the Statement of Income,
excluding dividends associated with business assumed and ceded.
Incurred loss in column 7 reconciles to column 6 of the Exhibit of Premiums and Losses
(Statutory Page 14 Data) by line, for all states plus any alien business, and in total to
Schedule T, column 6, line 59.
DCC expenses incurred and unpaid in columns 9 and 15, respectively, reconcile to columns 9
and 10, of the Exhibit of Premiums and Losses (Statutory Page 14 Data) by line, for all states
plus any alien business. Incurred expenses also reconcile in total to the U&IE, Part 3,
Expenses, line 1.1 of column 1.
A&O expenses incurred and unpaid in columns 11 and 17, respectively, cannot be tied directly
to amounts presented in the Annual Statement. The NAIC instructions state, “IEE Part III,
columns 9, 11, 15 and 17 must agree with IEE Part II, columns 9, 11, 15 and 17,
respectively, excluding expenses relating to reinsurance assumed and ceded.”
119
An
insurance company knows which expenses are allocated to which lines and can therefore
complete these columns.
Unpaid losses in column 13 reconcile to column 7 of the Exhibit of Premiums and Losses
(Statutory Page 14 Data) by line, for all states plus any alien business, and in total to
Schedule T, column 7, line 59.
Unearned premium reserves in column 19 reconcile to column 4 of the Exhibit of Premiums
and Losses (Statutory Page 14 Data) by line, for all states plus any alien business.
Agents’ balances in column 21 stem from policies written; therefore, companies know the
applicable line of business. The amounts should agree to balances included within lines 15.1
plus 15.2, column 3 of the Assets page, excluding balances relating to reinsurance.
Other underwriting expenses in columns 23, 25, 27 and 29 cannot be found in the line of
business breakdown of Part III. However, they should reconcile in total to the corresponding
amounts in Part I of the IEE excluding amounts relating to reinsurance assumed or ceded. In
fact, commissions and brokerage incurred on a direct basis in column 23 should reconcile in
total to the sum of the amounts in line 2.1 plus 2.4 of IEE Part I, column 2.
Other income less other expense in column 31 also does not reconcile directly to amounts in
the Annual Statement. However, the NAIC instructions note that it should agree in total to
119
2018 NAIC Annual Statement Instructions Property/Casualty, page 422.

FINANCIAL REPORTING THROUGH THE LENS OF A PROPERTY/CASUALTY ACTUARY
Part IV. Statutory Filings to Accompany the Annual Statement
240
amounts in line 15 minus line 5 of the Statement of Income that apply to direct business only
(i.e., “excluding expenses related to reinsurance assumed or ceded”).
120
Calculation of Pretax Profit or Loss Excluding All Investment Gain (Column 33)
Column 33 provides pretax profit (loss) excluding all investment gains and is calculated from
the information contained in the previous columns of Part III of the IEE, using the same
formulaic approach as in Part II. Specifically,
Pretax profit or loss excluding all investment gains =
Premiums earned (column 3)
- Dividends to policyholders (column 5)
- Incurred loss (column 7)
- DCC expenses incurred (column 9)
- A&O expenses incurred (column 11)
- Commission and brokerage expenses incurred (column 23)
- Taxes, licenses and fees incurred (column 25)
- Other acquisitions, field supervision and collection expenses incurred (column 27)
- General expenses incurred (column 29)
+ Other income less other expenses (column 31).
INTERROGATORIES
The interrogatories to the IEE are actually shown before the Parts I through III. The
interrogatories provide explanatory notes on the information contained in Parts I through III,
the most important of which is Interrogatory 4, which provides information on the process by
which the allocations of expenses and profit are made. Specifically, question 4 asks:
4. The information provided in the Insurance Expense Exhibit will be used by
many persons to estimate the allocation of expenses and profit to the
various lines of business.
4.1 Are there any items requiring special comment or explanation?
4.2 Are items allocated to line of business in Parts II and III using
methods not defined in the instructions?
4.3 If yes, explain.
121
Questions 4.1 and 4.2 each require “yes” or “no” responses. If the company answers “yes” to
either question, the company is required to provide an explanation, so the user can consider
differences in the company’s process relative to what is stated in the instructions.
120
Ibid., page 422.
121
2018 IEE.

FINANCIAL REPORTING THROUGH THE LENS OF A PROPERTY/CASUALTY ACTUARY
Part IV. Statutory Filings to Accompany the Annual Statement
241
CHAPTER 19. RISK-BASED CAPITAL
OVERVIEW
The Risk-Based Capital (RBC) system was developed by the National Association of Insurance
Commissioners (NAIC) and has been used since 1994 to provide a means for the early
detection of insurance company insolvency. It was implemented for property/casualty
companies in part in response to reports issued by the federal government in the late 1980s
and early 1990s questioning the ability of state governments to regulate insurance
companies.
122
These reports emerged in the wake of four of the largest property/casualty
insurance company insolvencies in the history of the U.S. insurance industry: Mission
Insurance Company, Transit Casualty Company, Integrity Insurance Company and Anglo-
American Insurance Company.
The implementation of the RBC system was a significant advancement in solvency monitoring
by state governments and has also served as the foundation for many other capital models
that followed, including those currently used by rating agencies.
There are two main components to the RBC system:
1. RBC formula: The RBC formula results in a minimum level of required capital
determined (the authorized control level benchmark, or ACL) formulaically using an
approach that is standard to all insurance companies in a particular industry group
(e.g., property/casualty, life and health). The minimum level of required capital is
intended to reflect the capital needed to support the risks faced by insurance
companies. The company’s actual recorded capital and surplus is compared to the
minimum required capital to produce the RBC ratio.
123
The RBC ratio is compared to a
range of values that define the levels of company and regulatory action.
2. RBC for Insurers Model Act:
124
The RBC Model Act, as adopted in the laws and
regulations of each state, provides the state insurance regulator with authority to take
specific action when a company’s RBC ratio falls below certain thresholds.
The RBC system is applied to property/casualty, life and health insurance companies. Certain
entities are exempt from the RBC system, including title insurance companies, monoline
122
The most widely known of these reports was written by the U.S. House of Representatives Subcommittee on
Oversight and Investigations of the Committee on Energy and Commerce titled, “Failed Promises – Insurance
Company Insolvencies” (see U.S. House of Representatives Subcommittee on Oversight and Investigations of the
Committee on Energy and Commerce. “Failed Promises-Insurance Company Insolvencies.” 101 Cong., 2nd sess.,
February 1990. Washington, D.C.: GPO, 1993).
123
The company’s actual recorded capital and surplus is adjusted to reflect certain items that will be introduced
later in this chapter.
124
NAIC RBC for Insurers Model Act (Model #312).

FINANCIAL REPORTING THROUGH THE LENS OF A PROPERTY/CASUALTY ACTUARY
Part IV. Statutory Filings to Accompany the Annual Statement
242
financial guaranty insurance companies and monoline mortgage guaranty insurance
companies
125
. Other exemptions may apply based on individual state laws and regulations.
This publication will focus on the RBC system as it applies to property/casualty insurance
companies. The formulas differ for property/casualty, life and health insurance companies,
reflecting differing risk factors for each.
Insurance companies are required to file their RBC report with the NAIC by March 1 based on
information evaluated as of the prior year-end (December 31). An insurance company’s RBC
report provides its RBC formula calculations and management discussion and analysis of the
RBC results. The RBC report is confidential; therefore, details of the calculation are not
available to the public. However, the summarized results of the RBC formula calculations are
shown in the Five-Year Historical Data exhibit of the Annual Statement, which is in the public
domain. The disclosure shows the overall result of the authorized control level risk-based
capital calculation together with the company’s total adjusted capital, which can be compared
to determine the RBC ratio.
RBC FORMULA
Overview
The RBC formula is computed by applying a set of factors to asset, reserve, recoverable and
premium items reported in an insurance company’s Annual Statement. The size of the factor
depends on the level of risk associated with each item; the greater the risk, the greater the
factor. The application of the factors to the associated Annual Statement items results in
what are commonly referred to as “risk charges.”
The formula is not a comprehensive measure of every risk for an insurance company; rather it
only considers those risks that are material to an insurance company. Further, risks
associated with a company’s business plans and strategy, management, internal controls,
systems, reserve adequacy and ability to access capital are not considered as these risks are
difficult to quantify.
The general structure of the RBC formula has remained intact since it was first implemented
in 1994, although the risk charges have been subject to periodic revisions since that time. In
recent years, additional risk categories have been introduced to the formula to reflect
evolving practices around the management and quantification of risk in the insurance
industry. The RBC formula was developed based on its predecessor, the life RBC formula,
which the NAIC implemented a year earlier in 1993.
126
125
It should be noted that the NAIC is currently in the process of testing and implementing a proposed risk-based
mortgage guaranty capital model, see: http://www.naic.org/cmte_e_mortgage_guaranty_insurance_wg.htm
126
RBC for stand-alone health insurers was not implemented until 1998.

FINANCIAL REPORTING THROUGH THE LENS OF A PROPERTY/CASUALTY ACTUARY
Part IV. Statutory Filings to Accompany the Annual Statement
243
Risk Categories
The current property/casualty RBC formula includes eight risk categories, with most denoted
by the letter “R” with an indicator subscript to identify the particular risk:
R
0
Subsidiary Insurance Companies and Miscellaneous Other Amounts
R
1
Asset Risk – Fixed Income
R
2
Asset Risk – Equity
R
3
Asset Risk – Credit
R
4
Underwriting Risk – Reserves
R
5
Underwriting Risk – Net Written Premium
R
cat
Catastrophe Risk
- Operational Risk
127
Broadly speaking, the major categories of risk captured by the property/casualty RBC formula
are similar to those within the life and health formulas, focusing mainly on the risks
associated with the company’s investments and other recoverable-based assets (“asset risk”),
as well as risks associated with the issuance of insurance policies (“underwriting risk”).
Visually, the formulas differ by the use of the letter “R” denoting the risks for property-
casualty, while the letter “C” is used for the life formula and “H” for the health formula.
Asset risk is a much smaller portion of the property/casualty total risk charge compared to
the life industry. This is because life insurance policies tend to be purchased as investment
vehicles, whereas property/casualty products are purchased to protect the consumer from
financial loss. As a result, property/casualty companies tend to invest in short-term, liquid
investments (which are generally considered to be lower risk) due to the relatively shorter
duration of liabilities.
As of December 31, 2018, the life insurance industry held more than 17 times the amount of
recorded surplus in admitted assets whereas property/casualty insurers held less than three
times the amount of surplus in admitted assets
128
.
Subsidiary Insurance Companies and Miscellaneous Other Amounts
The R
0
charge considers the risks associated with investments in affiliated entities as well as
miscellaneous off-balance sheet and other items.
127
Operational Risk is added as a final step in the calculation, after applying the covariance adjustment between
other risk types, and does not have a corresponding “R” indicator.
128
S&P Global Market Intelligence, based on YE2018 Annual Statement data.

FINANCIAL REPORTING THROUGH THE LENS OF A PROPERTY/CASUALTY ACTUARY
Part IV. Statutory Filings to Accompany the Annual Statement
244
Affiliated investments fall into two broad categories: insurance affiliates that are subject to
RBC and affiliates that are not subject to RBC. The latter group includes insurance affiliates
that are not subject to RBC, such as title insurers, monoline financial guaranty insurers, and
monoline mortgage guaranty insurers, all of which are currently exempt from the RBC
system.
R
0
contains the risk charges associated with affiliated insurers subject to RBC (whether
property/casualty, life or health), along with alien insurance affiliates.
129
All other affiliates
are subject to R
2
charges.
The miscellaneous off-balance sheet and other items component includes non-controlled
assets, guarantees for affiliates, contingent liabilities and deferred tax assets admitted under
statutory-basis accounting.
Asset Risk
Within the property/casualty RBC formula, there are three categories of asset risk:
R
1
Asset risk — Fixed income
R
2
Asset risk — Equity
R
3
Asset risk — Credit
R
1
and R
2
are risks associated with admitted invested assets (other than those already
captured in R
0
), which are shown on lines 1 through 11, column 3, on the asset side of the
statutory balance sheet on page 2 of the Annual Statement. The R
1
charge considers changes
in interest rates and potential default of fixed income investments (e.g., cash, bonds,
mortgage loans). The R
2
charge considers changes in asset valuations for non-fixed income
investments (e.g., stocks, real estate).
As of December 31, 2018, bonds represented approximately 51% of the admitted assets of
the property/casualty insurance industry, with the next largest investment category dropping
to 20%, represented by holdings of common (19%) and preferred (<1%) stocks, and 5% in
cash.
130
R
3
considers the credit risk associated with receivables on the balance sheet, which include
items listed on lines 14 and subsequent on the asset side of the statutory balance sheet, as
well as risk associated with reinsurance recoverables. Additionally, if a company has written
129
According to the Glossary of Terms in the textbook Property-Casualty Insurance Accounting issued by Insurance
Accounting & Systems Association, Inc., 8th ed. (2003), First Addendum (2006), an alien insurance company is
defined as “An insurer or reinsurer domiciled outside the U.S. but conducting an insurance or reinsurance business
in the U.S.”
130
S&P Global Market Intelligence, based on YE2018 Annual Statement data

FINANCIAL REPORTING THROUGH THE LENS OF A PROPERTY/CASUALTY ACTUARY
Part IV. Statutory Filings to Accompany the Annual Statement
245
5% or more of its premiums in accident & health lines in the last three years, it is also subject
to a Health Credit Risk charge.
Underwriting Risk
There are two categories of underwriting risk in the property/casualty RBC formula:
R
4
Underwriting risk — Reserves
R
5
Underwriting risk — Net written premium
The reserve risk charge (R
4
) is concerned with past business while the premium risk charge
(R
5
) is concerned with future business. Reserve risk is the risk that the company’s recorded
loss and loss adjustment expense (LAE) reserves will develop adversely, under the assumption
that the current reserve balance is adequate. Written premium risk considers the risk that the
company’s business in the following year will be unprofitable.
According to the NAIC RBC instructions, “Underwriting risk is the largest portion of the risk-
based capital charge for most property/casualty insurance companies and makes up
approximately 55 percent of the aggregate industry risk-based capital prior to the covariance
adjustment.”
131
This contrasts with life insurance companies, where the predominant portion
of the RBC charge is asset risk.
Property/casualty insurance companies tend to concentrate in short-term, relatively fixed and
liquid investment categories given the short duration of most property/casualty insurance
products sold and the need to have funds readily available to pay claims. The smaller volume
and relatively short-term nature of the assets for property/casualty insurance companies
significantly limits the asset risk relative to the size of underwriting risk, as compared to life
insurance companies.
Catastrophe Risk
The catastrophe risk charge (R
cat
) was added to the RBC formula in 2017 after more than a
decade of development.
132
It covers risks associated with earthquake and hurricane events
and considers modeled losses at the worst year in 100. Projected losses can be calculated
using one of the approved commercially available catastrophe models (e.g., AIR, RMS,
EQECAT). Beginning in 2019, companies will also be able to use their own internally
developed catastrophe model, upon obtaining written permission by their domestic (where
model output is used for a single entity) or lead state (where model output is used for the
whole group) insurance regulator.
131
NAIC, RBC Property & Casualty 2018 Forecasting & Instructions, page 20.
132
Catastrophe Risk was included as part of RBC filings on an informational only basis only from 2013-16 as part of
the development phase.

FINANCIAL REPORTING THROUGH THE LENS OF A PROPERTY/CASUALTY ACTUARY
Part IV. Statutory Filings to Accompany the Annual Statement
246
The catastrophe risk charge applies on a net of reinsurance basis, with a corresponding
contingent credit risk charge for certain categories of reinsurers.
Covariance Adjustment
Risk charges R
0
through R
cat
are aggregated in the RBC formula to calculate the overall RBC
requirement, before the consideration of operational risk, as follows
133
:
+
+
+
+
+
+
=Total RBC After Covariance Before Basic Operational Risk
The square root calculation within the RBC formula is commonly referred to as the
“covariance adjustment.” Rather than summing up the individual risk charges (R
1
through
R
cat
), it is assumed that the individual risk charge categories are independent of one another.
That is, the formula reflects diversification among these risk categories, thereby assuming
that the aggregate risk is less than the sum of risk of the independent components. For
example, the formula assumes that the risk of default on an insurance company’s invested
assets (e.g., bonds, stocks) is independent of the performance of its loss reserves. Taking the
square root of the sum of the squares for R
1
through R
cat
increases the dependency of the
larger risks in the calculation and decreases the significance of the smaller risk categories in
the overall aggregate RBC requirement.
R
0
is kept outside of the covariance adjustment because the risk for investments in insurance
company subsidiaries is believed to be directly correlated with the combination of the risks
specific to the reporting entity (i.e., the other risk charges R
1
through R
cat
). Therefore, the
risk for investments in insurance company subsidiaries is additive to the aggregate of the
investment and underwriting risks of the reporting entity for which RBC is being calculated. In
other words, RBC should not depend on the organizational structure of the insurance
company and investments in insurance company subsidiaries that are subject to RBC do not
provide a diversification benefit.
The covariance calculation is applied similarly in the life and health RBC formulas, keeping C
0
and H
0
outside of the square root like R
0
.
Basic Operational Risk
Introduced in 2018,
134
the basic operational risk charge considers the risk of financial loss
resulting from operational events, such as the inadequacy or failure of internal systems,
133
Note that under certain circumstances, discussed later, half of the reinsurance component of R
3
is moved in to
R
4
for the purpose of the covariance adjustment calculation
134
The operational risk charge was formally introduced in 2017, but applied a 0% risk charge that year

FINANCIAL REPORTING THROUGH THE LENS OF A PROPERTY/CASUALTY ACTUARY
Part IV. Statutory Filings to Accompany the Annual Statement
247
personnel, procedures or controls, as well as external events. This includes legal risk but
excludes reputational risk arising from strategic decisions. The risk charge accounts for
operational risks that are not deemed to be already reflected in the existing risk categories.
The basic operational risk charge uses a percentage of RBC or “add-on” approach that applies
a risk factor to the Total RBC After Covariance Before Basic Operational Risk amount
described above. The operational risk charge will be reduced by the sum of offset amounts
reported by direct Life RBC filing insurance subsidiaries adjusted for the percentage of
ownership in the direct life insurance subsidiaries (but not to produce a charge that is less
than zero).
Components of the Charges
Within subsequent sections of this chapter, we will walk through the components of each
charge that goes into the RBC formula, deliberately leaving out certain information that would
be necessary to fully prepare and issue the RBC report for a company. We will reference the
requirements of the RBC formula as it stands for year-end 2018 submissions, noting in a few
places modifications that are expected in the 2019 version of the RBC formula.
The NAIC issues instructions on how to prepare the RBC calculation, including an instructional
forecasting spreadsheet containing an example of the necessary formulas. Additionally, RBC
software is available from Annual Statement software vendors and is used by insurance
companies for filing with state regulatory authorities. This publication is only intended to
provide an overview of the RBC formula and is not intended to supplant the NAIC RBC
instructions or electronic filing requirements.
Before we delve into the details, let us provide some perspective on the relevance of each risk
category to the overall formula. Table 75 provides a summarization of figures provided by the
NAIC in its presentation of 2018 RBC results for the property/casualty insurance industry:
135
135
NAIC, Summary: Aggregate P/C RBC Results By Year, 2018,
http://www.naic.org/documents/research_stats_rbc_results_pc.pdf

FINANCIAL REPORTING THROUGH THE LENS OF A PROPERTY/CASUALTY ACTUARY
Part IV. Statutory Filings to Accompany the Annual Statement
248
TABLE 75
Aggregate for 2,465 Property/Casualty Companies
RBC by Category
USD in $million
2018 Risk Category Totals
R
0
— Subsidiary Insurance Companies and Misc. Other Amounts 58,786
R
1
— Asset Risk — Fixed Income 8,046
R
2
— Asset Risk — Equity 119,069
R
3
— Asset Risk — Credit 9,301
R
4
— Underwriting Risk — Reserves 114,979
R
5
—
Underwriting Risk
—
Net Written Premium
R
cat
— Catastrophe Risk
75,532
52,510
Asset Risk – Equity (R
2
) and Underwriting Risk – Reserves (R
4
) represented the largest risk
charges within the RBC formula for the property/casualty insurance industry in 2018, with
$119 billion and $115 billion respectively.
Despite representing approximately half of the invested assets of the property/casualty
insurance industry in 2018 (see Table 2), the asset risk charge for fixed income investments
is the smallest component of the RBC charge for the industry. This is because
property/casualty insurers tend to invest in relatively safe, high-credit quality bonds.
On the other hand, the asset risk charge for equity brings the highest charge, reflecting the
increased risk associated with these investments over fixed income. The NAIC’s report on
2018 RBC results shows that the equity risk component has been growing in significance
relative to other risk charges over the past decade, becoming the largest risk component for
the first time in 2017. This reflects a period where common stocks have increased from 12%
of property/casualty insurers’ total admitted assets in 2008 to 19% in 2018.
Table 76 shows the impact of the Covariance Adjustment. Applying the sum-of-squares
approach to the R
1
through R
cat
charges reduces the combined total of these risk charges by
approximately 50%, reflecting independence between each of the risk types.

FINANCIAL REPORTING THROUGH THE LENS OF A PROPERTY/CASUALTY ACTUARY
Part IV. Statutory Filings to Accompany the Annual Statement
249
TABLE 76
Aggregate for 2,465 Property/Casualty Companies
RBC by Category
USD in $million
2018 Risk Charges for R
1
through R
cat
Totals Distribution Squared Totals Distribution
R
1
— Asset Risk — Fixed Income 8,046 2% 64,738,615 0%
R
2
— Asset Risk — Equity 119,069 31% 14,177,508,681 39%
R
3
— Asset Risk — Credit 9,301 2% 86,512,359 0%
R
4
— Underwriting Risk — Reserves 114,979 30% 13,220,264,494 37%
R
5
— Underwriting Risk —Net Written Premium
75,532
20%
5,705,129,401
16%
R
cat
— Catastrophe Risk
52,510
14%
2,757,330,871
8%
Sum of R
1
–R
cat
379,438 100% 36,011,484,420 100%
Total RBC (excl R
0
) After Covariance Before
Basic Operational Risk
189,767 = square root of the sum of Squared Totals above
Covariance Adjustment - 189,672
Recall that the covariance adjustment increases the dependency of the larger risks and
decreases the significance of the smaller risk categories in the overall aggregate RBC
requirement. As displayed in the Table 76, squaring each of charges R
1
through R
cat
and
summing the results shows the increased significance of the two largest risk categories (R
2
and R
4
), which now contribute 76% to the total on a squared basis, up from 61% based on a
simple sum. The other risk categories have similarly seen their contribution shrink.
THE RBC CHARGE FOR SUBSIDIARY INSURANCE COMPANIES AND MISCELLANEOUS OTHER
AMOUNTS (R
0
)
The R
0
charge considers the risks associated with investments in subsidiary insurance
companies as well as miscellaneous off-balance sheet and other items.
Subsidiary and affiliated insurance companies are only considered within R
0
if they are U.S.
domiciled entities subject to RBC, or if they are alien insurers (i.e., foreign to the U.S.). Recall
that certain insurance companies are not subject to RBC, such as title insurers, monoline
mortgage guaranty insurers and monoline financial guaranty insurers. All other affiliated
entities, including U.S. insurance subsidiaries not subject to RBC, are considered within the
Asset Risk – Equity (R
2
) module.
Selected definitions
Term definitions will become important as we walk through the risk charges for affiliated
entities. Statutory Accounting Principles (SAP), specifically Statement of Statutory
Accounting Principles (SSAP) No. 97, Investments in Subsidiary, Controlled and Affiliated
Entities, define the following terms:

FINANCIAL REPORTING THROUGH THE LENS OF A PROPERTY/CASUALTY ACTUARY
Part IV. Statutory Filings to Accompany the Annual Statement
250
Parent
“An entity that directly or indirectly owns and controls the
reporting entity.”
136
S
ubsidiary
“An entity that is, directly or indirectly, owned and controlled by
the reporting entity.”
137
Affiliate
“An entity that is within the holding company system or a party
that, directly or indirectly, through one or more intermediaries,
controls, is controlled by, or is under common control with the
reporting entity. An affiliate includes a parent or subsidiary and
may also include partnerships, joint ventures, and limited liability
companies.”
138
Control
“The pos
session, directly or indirectly, of the power to direct or
cause the direction of the management and policies of the investee,
whether through the (a) ownership of voting securities, (b) by
contract other than a commercial contract for goods or non-
management services, (c) by common management, or (d)
otherwise. Control shall be presumed to exist if a reporting entity
and its affiliates directly or indirectly, own, control, hold with the
power to vote, or hold proxies representing 10% or more of the
voting interests of the entity.”
139
SSAP No. 97 further states that control is measured at the holding
company level. For example, the 10% benchmark would apply to a
group consisting of two affiliates where one affiliate owns 7% of a
company and the other affiliate owns 4% of that same company.
Each member of the group has control over the company as the
sum of their ownership percentages exceeds 10%.
Investments in SCA
entities
An insurance company’s investment in subsidiaries, controlled and
affiliated entities (SCAs), are admitted assets to the extent they
conform to the requirements of SSAP No. 97.
Insurance Affiliates Subject to RBC
For U.S. insurers subject to RBC, including those subject to the life or health RBC
requirements, the total R
0
charge for a particular subsidiary is limited to the RBC of the
subsidiary, across all common stocks and preferred stocks, adjusted by the reporting entity’s
136
SSAP No. 97, Investments in Subsidiary, Controlled and Affiliated Entities, “Definitions” section.
137
Ibid.
138
Ibid.
139
Ibid.

FINANCIAL REPORTING THROUGH THE LENS OF A PROPERTY/CASUALTY ACTUARY
Part IV. Statutory Filings to Accompany the Annual Statement
251
ownership (pro rata) share in the subsidiary. The theory is that, through ownership, the
reporting entity is subject to the same risks as its subsidiary.
According to the NAIC’s 2018 written instructions for RBC,
140
the relevant RBC measure from
the subsidiary or affiliate is defined as:
· For a P/C and Health subsidiary RBC filings:
o Total RBC After Covariance Before Basic Operational Risk
· For a Life subsidiary RBC filing, the sum of:
o Total RBC After Covariance Before Basic Operational Risk
o Primary Security shortfalls for all cessions covered by Actuarial Guideline
XLVIII, multiplied by two
Ownership of Common Stock
The RBC charge for investments of an insurance company subsidiary depends on the
accounting method used by the reporting entity to report the investment.
141
For investments in insurance affiliates recorded on the equity method, and for which
unamortized admitted goodwill is zero or non-existent (i.e., no adjustment to the
book/carrying value of the investment), the R
0
charge for ownership of common stock in the
insurance affiliate subject to RBC is equal to the minimum of the following:
• The total RBC of the affiliate multiplied by the percentage of ownership in the common
stock
• The book/adjusted carrying value of the common stock (greater than 0) as recorded
by the reporting entity
For all other insurance affiliates, the R
0
charge for ownership of common stock in these
affiliates is made up of two components:
1. An R
0
component, which is equal to the minimum of the following:
a. The total RBC of the affiliate multiplied by the percentage of ownership in the
common stock; or
140
NAIC RBC Property & Casualty 2018 Forecasting & Instructions, page 1.
141
According to SAP (SSAP No. 97), admitted investments in insurance company SCAs are recorded on the
reporting entity’s balance sheet using one of two methods: the market valuation approach or equity method.
Under the market valuation approach, investments in insurance company SCAs are based on the market value of
the SCA, adjusted for the reporting entity’s ownership percentage. Market value is equivalent to fair value. Under
the equity method, investments in insurance company SCAs are recorded based on the reporting entity’s
proportionate share of audited statutory equity of the SCA’s balance sheet, adjusted for any unamortized goodwill.
Under this method, the reporting entity records the initial investment at cost then essentially adjusts the value
over time based on the reporting entity’s share in the company’s income (loss). At any point in time, the recorded
amount is called the “carrying value.”

FINANCIAL REPORTING THROUGH THE LENS OF A PROPERTY/CASUALTY ACTUARY
Part IV. Statutory Filings to Accompany the Annual Statement
252
b. The statutory surplus of the affiliate multiplied by the percentage of ownership
of the total common stock.
2. An R
2
component, which is equal to one of the following (limited to a minimum of
zero):
a. The amount of the book/carrying value that exceeds the value from the R
0
component (above), when the total RBC of the affiliate multiplied by the
percentage of ownership in the common stock is greater than the
book/carrying value; otherwise
b. The maximum of the following:
i. The excess of the book/adjusted carrying value over the pro rata
statutory surplus value for the affiliate multiplied by 22.5%; or
ii. The amount that RBC of the affiliate multiplied by the percentage of
ownership in the common stock exceeds the value obtained in the R
0
component (above).
Recall that RBC calculations are not in the public domain. Attempts to recalculate an
insurance company’s RBC often make a simplifying assumption that the R
0
charge for
ownership in common stock of an SCA is equal to the SCA’s RBC (adjusted for ownership).
Ownership of Preferred Stock
The reporting entity’s R
0
charge for investments in preferred stock of insurance subsidiaries
depends on whether the subsidiary has excess RBC. Excess RBC is defined as the amount of
RBC of the affiliate that exceeds the total value of the outstanding common stock. If the
excess RBC is greater than zero, the RBC charge for ownership in preferred stock is the
minimum of the following:
• The pro rata share of the excess RBC
• The book/adjusted carrying value of the preferred stock (greater than zero) as
recorded by the reporting entity
The pro rata share is equal to the percentage of the affiliate’s total outstanding preferred
stock value that is owned by the company. To determine the value of total outstanding
common stock or total outstanding preferred stock, divide the book/adjusted carrying value
of the investment by the percentage of ownership.
If the excess RBC is less than or equal to zero, then the RBC charge for the company’s
ownership in the preferred stock of its affiliate is zero.
Occasionally, a company might own preferred stock in an affiliate subject to RBC but no
common stock. When this occurs, the company must determine if there is any excess by
calculating the notional value of the total outstanding value of the affiliate’s common stock

FINANCIAL REPORTING THROUGH THE LENS OF A PROPERTY/CASUALTY ACTUARY
Part IV. Statutory Filings to Accompany the Annual Statement
253
and/or preferred stock using one of the accepted methods from the Purposes and Procedures
Manual of the NAIC Investment Analysis Office.
Alien Insurance Affiliates
Alien insurance companies are entities that are incorporated under the laws of a country
outside the U.S., therefore these entities are not themselves subject to RBC. The reporting
entity’s RBC charge for investments in directly owned alien affiliates is equal to the Annual
Statement carrying value of the company’s interest in the affiliate multiplied by a factor of
0.500. For indirectly owned alien affiliates, this amount is further adjusted to reflect the
reporting entity’s ownership on the holding company.
Off-balance Sheet and Other Items
Off-balance sheet and other items include amounts that are either restricted or not recorded
by the insurance company in its statutory financial statements yet still represent assets
and/or potential liabilities of the insurance company and therefore expose the company to
risk. Off-balance sheet and other items are disclosed in the Notes to Financial Statements and
General Interrogatories of the Annual Statement. The following represents the categories of
such items included in the R
0
charge:
1. Non-controlled assets: This category of assets includes the following:
• Collateral loaned to others from securities lending programs
• Assets that are reported on the company’s balance sheet but for which the
company does not have exclusive control over, thereby exposing the company
to increased investment risk
• Assets sold or transferred that are subject to a put option, thereby enabling the
purchaser to sell the assets back to the insurance company
2. Guarantees for the benefit of affiliates: These are guarantees that may expose the
company’s assets to contingent liability exposure. An example would be a guarantee
made by a company to pay an outstanding loan held by an affiliate with a third party in
the event that the affiliate was unable to meet its obligation to that third party.
3. Contingent liabilities: This includes amounts for which the insurance company may be
held responsible but for which the amount cannot be determined and therefore is not
entered on the balance sheet. An example includes structured settlements for which
the insurance company purchases an annuity from a life insurance company to make
structured payments to claimants in order to close out a claim. The insurance carrier
would close the claim since it paid the life insurer to make the claim payments on its
behalf. However, if the life insurance company fails to pay, the insurance company
would still be ultimately responsible for settling the liability. This is a contingent
liability to the insurance company.

FINANCIAL REPORTING THROUGH THE LENS OF A PROPERTY/CASUALTY ACTUARY
Part IV. Statutory Filings to Accompany the Annual Statement
254
4. Deferred tax assets: This comprises admitted adjusted gross deferred tax assets
(DTAs) as described in SSAP No. 101, paragraphs 11a and 11b. The source for the
DTA amounts to use in the calculation is found in the Annual Statement, Notes to the
Financial Statements, Note 9, Part A, Section 2.
For almost all of the items listed above, a 1.0% factor is applied to all off-balance sheet
amounts for purposes of inclusion in the R
0
charge. The one exception is for conforming
securities lending programs, which are those programs that have specified elements that
lower the associated risk,
142
where a reduced charge of 0.2% is applied.
Additionally, the charge associated with deferred tax assets can be reduced to 0.5% when the
insurance company either filed its own separate Federal income tax return or was included in
a consolidated Federal income tax of which the common parent is an insurance company.
THE RBC CHARGE FOR ASSET RISK ASSOCIATED WITH FIXED INCOME INVESTMENTS (R
1
)
R
1
includes the charge for interest rate and default risk associated with fixed income
investments in the following categories:
1. Bonds
2. Off-balance sheet collateral and Schedule DL, Part 1, Assets
3. Other long term assets, including mortgage loans, low income housing tax credits and
working capital finance investments
4. Miscellaneous assets, including cash, cash equivalents, other short-term investments
and non-admitted collateral loans
5. Replication (synthetic asset) transactions and mandatorily convertible securities
Typically, the charge relating to bonds overwhelmingly dominates this risk category for
property/casualty insurers. In general, the charge for each of these investment types is based
on a factor determined by the NAIC multiplied by the book/adjusted carrying value of the
investment.
In addition to the charge for the aforementioned types of fixed income investment categories,
there are two charges reflecting the level of diversification in the entity’s fixed income
portfolio. The first is the bond size factor, and the second is the asset concentration factor.
142
According to the NAIC RBC Property & Casualty 2018 Forecasting & Instructions, page 16, conforming securities
lending programs are those comprising all of the following: (1) a written plan approved by the company’s board of
directors describing the company’s securities lending program and ways it can invest collateral; (2) written
procedures that the company must follow to monitor and control the risks of the program; (3) a binding
agreement between the insurance company and the borrowers of the insurer’s securities; and (4) collateral in the
form of investments that are allowable by the company’s domiciliary state (e.g., cash, cash equivalents, federally
guaranteed investments).

FINANCIAL REPORTING THROUGH THE LENS OF A PROPERTY/CASUALTY ACTUARY
Part IV. Statutory Filings to Accompany the Annual Statement
255
The fewer the bond holdings and greater the concentration in individual issuers or borrowers,
the greater the associated charge.
A brief discussion of each charge is provided below, with examples to illustrate their
calculation as deemed appropriate.
Bonds and the Bond Size Factor
The RBC charge for unaffiliated bond investments is equal to the book/adjusted carrying
value of the bond multiplied by a factor, where the factors vary based on the bond class. The
factors are as shown in Table 77.
TABLE 77
NAIC bond class
RBC factor
Class 01
—
Highest credit quality
-
U.S. government, guaranteed by U.S. government
0.000
-
U.S. government, n
ot backed by full faith and credit of U.S. government
0.003
-
All other
0.003
Class 02
—
High credit quality
0.010
Class 03
—
Medium
credit quality
0.020
Class 04
—
Low credit quality
0.045
Class 05
—
Lowest credit quality
0.100
Class 06
—
In or
near default
0.300
As displayed in Table 77, the RBC factors increase with the amount of perceived credit risk,
starting with 0.000 for U.S. government bonds that are backed by the full faith and credit of
the government and therefore have almost no default risk, all the way to a factor of 0.300 for
bonds issued by companies that are in or near default. According to the NAIC RBC
instructions, the bond factors are determined “based on cash flow modeling using historically
adjusted default rates for each bond category.” The instructions further explain: “For each of
2,000 trials, annual economic conditions were generated for the 10-year modeling period.
Each bond of a 400-bond portfolio was annually tested for default (based on a “roll of the
dice”) where the default probability varies by NAIC designation category and that year’s
economic environment.”
143
In addition to the charge for each class of bond, there is a separate charge to reflect the level
of diversification called the bond size factor. According to the NAIC RBC instructions, “The
size factor reflects additional modeling for different size portfolios that shows the risk
increases as the number of bond issuers decreases. Because most insurers’ bond portfolios
are considerably smaller than the portfolio used to develop the model bond risk, the basic
bond factors understate the true default risk of these assets. The bond size factor adjusts the
143
NAIC, RBC Property & Casualty 2018 Forecasting & Instructions, page 7.

FINANCIAL REPORTING THROUGH THE LENS OF A PROPERTY/CASUALTY ACTUARY
Part IV. Statutory Filings to Accompany the Annual Statement
256
computed RBC for those bonds that are subject to the size factor to more accurately reflect
the risk.”
144
The bond size factor, which measures the degree of diversification in the investment
portfolio, is computed as the weighted average number of issuers in a portfolio subject to the
adjustment, with the weights prescribed by the NAIC depending on the number of issuers.
Table 78 displays the formula, including the NAIC weights.
TABLE 78
Bond Size Factor
Weighted
# of bond issuers
Weights
# Issuers
(1)
(2)
(3)
= (1) * (2)
First 50 XXXX 2.5
Next 50
XXX
X
1.3
Next 300
XXXX
1.0
More than 400
XXXX
0.9
Total XXXX
The bond size factor is equal to the total in column 3 divided by the total in column 1 in Table
79, minus 1. For example, if a reporting entity invests in 500 bonds, the bond size factor
would be 0.2. The calculation of this factor is provided in Table 79 as the sum of the weighted
number of issuers in column 3 of 580 divided by the total number of issuers in column 1 of
500, minus 1.
TABLE 79
Example of Bond Size Factor
Weighted
#
of bond issuers
Weights
# Issuers
(1)
(2)
(3)
= (1) * (2)
First 50 50 2.5 125
Next 50
50
1.3
65
Next 300
300
1.0
300
More than 400
100
0.9
90
Total 500 1.2 580
The bond size factor is applied to the RBC calculated for bonds subject to adjustment. As
displayed in Table 79, the weights decrease with the number of issuers. Therefore, the more
144
Ibid.

FINANCIAL REPORTING THROUGH THE LENS OF A PROPERTY/CASUALTY ACTUARY
Part IV. Statutory Filings to Accompany the Annual Statement
257
issuers, the lower the factor applied in the RBC calculation and the lower the additional RBC
amount required. For a reporting entity investing in fewer than 50 bonds, the factor is 1.5
times the RBC required for the bonds (=2.5 – 1); for an entity investing in 1,000 bonds, the
factor is 0.03.
145
The bond size factor is calibrated such that the break-even point where the factor equals 1.0
is set at 1,300 bonds. Portfolios containing 1,300 or more bonds will receive a discount to
their RBC charge for bonds.
Bonds that are subject to the bond size factor include unaffiliated bonds in classes 02 through
06, plus non-U.S. government bonds in class 01.
Off-balance Sheet Collateral and Schedule DL, Part 1, Assets
The RBC charge for off-balance sheet collateral and Schedule DL assets considers the risk
associated with securities lending programs. Recall the discussion of securities lending
programs in Chapter 13. Overview of Schedules and Their Purpose. The risk associated with
these programs is that the reporting entity will lose money on the reinvestment of collateral
posted by the borrower. Collateral held by the reporting entity in conjunction with securities
lending programs is reported one of three ways in the Annual Statement:
1. In investment schedules that correspond to the invested collateral (e.g., Schedule A,
B, BA, D, DA and E), which roll up into the balance sheet
2. In Schedule DL, Part 1, of the Annual Statement, which rolls into line 10 of the asset
side of the balance sheet
3. Off-balance sheet, due to not being recorded in the financial statements
The R
1
charge considered herein includes a provision for these assets as included in items 2
and 3 above. The charge is equal to the book/adjusted carrying value multiplied by a factor,
where the factor is equal to that for the particular asset class. For example, the same factors
by class applicable to bonds are also used in this calculation.
Other long term assets – Mortgage loans
The RBC charge for mortgage loans for property/casualty insurers is computed as the
book/adjusted carrying value of the loans multiplied by a factor of 0.050. This is based upon
the factors developed by the Life RBC formula, which ranged from 3% to 20%.
Other long term assets – Working Capital Finance Investments
The booked/adjusted carrying value of working capital finance investments can be found in
the Notes to Financial Statements, lines 5M(01a) and 5M(01b) in column 3, of the Annual
145
0.03 = [[(50*2.5) + (50*1.3) + (300*1.0) + (600*0.9)] / (1,000)] – 1.0

FINANCIAL REPORTING THROUGH THE LENS OF A PROPERTY/CASUALTY ACTUARY
Part IV. Statutory Filings to Accompany the Annual Statement
258
Statement. Those in line 5M(01a) – NAIC Designation 1 – get a risk charge of 0.0038, while
those in 5M(01b) – NAIC Designation 2 – have a factor of 0.0125.
Low Income Housing Tax Credits (LIHTC)
There are five categories of LIHTC investments listed below, which must be reported in
accordance with Statement of Statutory Accounting Principles (SSAP) No. 93, Low Income
Housing Tax Credit Property Investments:
• Federal guaranteed
• Federal non-guaranteed
• State guaranteed
• State non-guaranteed
• All other
The associated NAIC factor used to calculate the RBC charge varies by category.
In order to be classified as a federal guaranteed LIHTC investment, it must have an all-
inclusive guarantee from an ARO
146
-rated entity which guarantees the yield on the
investment. The RBC charge for a federal guaranteed LIHTC investment is equal to the
book/adjusted carrying value times 0.0014.
To be classified as a federal non-guaranteed LIHTC investment, it must include the following
risk mitigation factors:
a) A level of leverage below 50%. For an LIHTC fund, the level of leverage is measured at
the fund level; and
b) A tax credit guarantee agreement from a general partner or managing member,
requiring the general partner or managing member to reimburse investors for any
shortfalls in tax credits due to errors of compliance. For an LIHTC fund, a tax credit
guarantee is required from the developers of the lower-tier LIHTC properties to the
upper-tier partnership.
The RBC charge for a federal non-guaranteed LIHTC investment is equal to the book/adjusted
carrying value times 0.0260.
To be classified as a state guaranteed LIHTC investment, it must minimally meet the federal
requirements for guaranteed LIHTC investments. The RBC charge for a state guaranteed
LIHTC investment is equal to the book/adjusted carrying value times 0.0014.
146
NAIC’s Acceptable Rating Organizations

FINANCIAL REPORTING THROUGH THE LENS OF A PROPERTY/CASUALTY ACTUARY
Part IV. Statutory Filings to Accompany the Annual Statement
259
To be classified as a state non-guaranteed LIHTC investment, it must minimally meet the
federal requirements for non-guaranteed LIHTC investments. The RBC charge for a state non-
guaranteed LIHTC investment is equal to the book/adjusted carrying value times 0.0260.
All other federal and state LIHTC investments that do not meet the requirements of the above
categories will be classified in the All Other LIHTC investments category. The RBC charge for
all other LIHTC investments is equal to the book/adjusted carrying value times 0.1500.
Miscellaneous Assets
The RBC charge for miscellaneous assets is computed as a factor times the book/adjusted
carrying value for those assets that are in excess of amounts considered elsewhere in the RBC
formula, if any. The RBC charges for each investment are as follows (not less than zero):
• 0.003 times the book value of cash, net cash equivalents and other short-term
investments
o The NAIC recognize that there is a small risk related to the possible insolvency
of the bank where cash deposits are held. The 0.3% factor, equivalent to an
unaffiliated NAIC 01 bond, reflects the short-term nature of this risk.
• 0.050 times admitted collateral loans and write-ins
o These are generally a small proportion of total portfolio value. A factor of 5.0%
is consistent with other RBC formulas studied by the NAIC working group.
Replication (Synthetic Asset) Transactions and Mandatory Convertible Securities
Assets included within this category are defined in the NAIC RBC instructions as follows:
“A replication (synthetic asset) transaction is a derivative transaction entered into in
conjunction with other investments in order to reproduce the investment characteristics of
otherwise permissible investments…
A mandatory convertible security is defined as a type of convertible bond that has a required
conversion or redemption feature. Either on or before a contractual conversion date, the
holder must convert the mandatory convertible security into the underlying common stock.
Mandatory convertible securities are subject to special reporting instructions and are
therefore not assigned NAIC designations or Unit Prices by the SVO. The balance sheet
amount for mandatory convertible securities shall be reported at the lower of amortized cost
or fair value during the period prior to conversion… Upon conversion, these securities will be
subject to the accounting guidance of the SSAP that reflects their revised characteristics.”
147
147
NAIC, RBC Property & Casualty 2018 Forecasting & Instructions, page 10.

FINANCIAL REPORTING THROUGH THE LENS OF A PROPERTY/CASUALTY ACTUARY
Part IV. Statutory Filings to Accompany the Annual Statement
260
To expand upon the discussion about derivatives in Chapter 8. The Statutory Income
Statement: Income and Changes to Surplus and Chapter 13. Overview of Schedules and their
Purpose, insurance companies use derivative transactions for one of three reasons:
1. Hedge or mitigate risk
2. Generate income
3. Replicate an asset that cannot be purchased in the cash market because it is either too
expensive or unavailable
148
As stated previously, derivative holdings by property/casualty insurers are small relative to
those held by life insurance companies. This somewhat explains the low-risk charge for this
category.
Replication (synthetic asset) transactions are commonly referred to as “RSATs” and are
reported in Schedule DB of the Annual Statement. An RSAT is a package of a derivative(s) and
a cash instrument(s). The cash instrument is generally a bond.
The RBC charge for RSATs is equal to the RBC factor applicable for the asset the RSAT is
replicating, multiplied by the statement value of the transaction from Schedule DB. Credit is
given for the RBC charge already applied to the cash instrument. For example, if the cash
instrument is a bond, then the cash component of the RSAT is recorded as a bond on the
company’s balance sheet and has already received a risk charge based on its bond
characterization. The RBC for RSATs is adjusted to remove the RBC previously calculated for
the subject bond.
A mandatory convertible security is reported in the Annual Statement schedule that
corresponds to the security pre-conversion. For example, assume an insurer holds a bond that
is mandatorily convertible into a fixed number of shares of common stock within three years.
The bond will be reported in the company’s balance sheet and will therefore receive an RBC
charge based on its NAIC bond class. However, the insurer is not only exposed to risks
associated with the bond, but also the risk associated with the common stock that it will
convert to sometime over the next three years, since the bond’s principal will be used to
purchase the shares. The RBC charge for mandatory convertible securities adjusts the RBC
charge upward if the security that results from conversion is more risky. Since unaffiliated
common stocks have a RBC charge of 0.15, and bonds have a charge between 0.00 and 0.30,
depending on class, the RBC charge will be adjusted upward by the maximum of the difference
between the RBC charge for the stock and bond, and zero. This is similar to the application of
the RBC charge for RSATs; the RBC charge for mandatory convertible securities is equal to
148
Memorandum to NAIC Investment Risk Based Capital (RBC) Working Group from Walter Givler – Northwestern
Mutual Life, Mark Anderson – Met Life and other members of the ACLI Derivative Risk Management Team, dated
March 29, 2013, Re: Life Insurer RBC for Derivatives.
http://www.naic.org/documents/committees_e_capad_investment_rbc_wg_exposures_derivatives.pdf.

FINANCIAL REPORTING THROUGH THE LENS OF A PROPERTY/CASUALTY ACTUARY
Part IV. Statutory Filings to Accompany the Annual Statement
261
the RBC charge for the converted security, reduced by the RBC charge for the original
security.
Half of the charge for RSATs and mandatory convertible securities is applied to R
1
, with the
remaining half applied to R
2
. This assumes that half of the securities in the calculation are
fixed income and half are equity.
Asset Concentration Factor
The asset concentration factor doubles the RBC charge for the 10 largest issuers that the
insurance company is exposed to. The purpose of this charge is to reflect the increased risk
associated with large concentrations in single issuers.
The 10 largest issuers are determined by first summing the insurer’s total investment
(book/adjusted carrying value) across all investments (fixed income plus equity) for each
issuer. The total amounts for each issuer are then sorted from largest to smallest to
determine the top 10. The RBC charge for each fixed income and equity asset is computed for
the 10 largest issuers. The resulting RBC charge for fixed income is included as the asset
concentration RBC charge within R
1
; the resulting RBC charge for equity is included as the
asset concentration RBC charge within R
2
.
149
The RBC charge is limited to a maximum of
0.300 for each fixed income and/or equity investment.
However, not all assets are subject to the asset concentration factor, as certain assets are
deemed to be of low risk or have already received the maximum charge of 0.300. The assets
excluded from the additional charge are also excluded in determining the 10 largest issuers.
Fixed income assets that are subject to the asset concentration factor include the following:
• Bonds in classes 02 through 05
150
• Collateral loans
• Mortgage loans
• Working Capital Finance Investments – NAIC 02
• Low Income Housing Tax Credits
R
2
assets that are subject to the asset concentration factor include the following:
• Unaffiliated preferred stocks and hybrid securities in classes 02 through 05
• Hybrid securities in classes 02 through 05
• Unaffiliated common stock
• Investment in real estate
149
The asset concentration factor can be computed as the weighted average of the total asset concentration RBC
charge with the total subject assets.
150
Unaffiliated bonds in class 01 are excluded because they are deemed to be of low risk; unaffiliated bonds in
class 06 are excluded because they already receive the maximum charge of 0.300.

FINANCIAL REPORTING THROUGH THE LENS OF A PROPERTY/CASUALTY ACTUARY
Part IV. Statutory Filings to Accompany the Annual Statement
262
• Encumbrances on invested real estate
• Schedule BA assets (excluding collateral loans)
• Receivable for securities
• Aggregate write-ins for invested assets
• Derivatives
The following provides a simplified example to illustrate the calculation of the asset
concentration factor.
Assume that the fixed income and equity investments made by an insurance company that
are subject to the asset concentration factor are limited to 15 issuers and investments in
these issuers are limited to the assets listed in the Table 80 below. The following provides the
total adjusted book/carrying value of these investments sorted from highest to lowest value
by issuer
151
.
TABLE 80
Example
Adjusted Book/Carrying Value
for Assets
Subject to Asset Concentration USD
in 000s
Fixed Income Assets
Equity Assets
Unaffiliated Total Assets
Unaffiliated Preferred Unaffiliated
Investment
Subject to
Bonds Collateral Stocks Common Real Asset
Issuer Name Class 2 - 5 Loans Class 2 - 5 Stock Estate Concentration
1 Asppill Drug 1,200 1,200
2 Deal Mart 1,000 1,000
3 U.S. Express 1,000 1,000
4 MacroHard Inc. 900 900
5 Dill Computing 900 900
6 Tropical Beverage Co. 820 820
7 Popsi Co. 800 800
8 Texas Oil Inc. 550 550
9 Westwood Resorts 200 35 235
10 Dakota Energy 220 220
11 Bear Pharmaceuticals 200 200
12 Mediapro 200 200
13 Pear Computer 100 100
14 Jane Moose 80 80
15 KO Media 25 50 75
Total 3,770 1,200 1,700 1,525 85 8,280
Only the first ten of these issuers (Asppill Drug through Dakota Energy) are considered in the
calculation of the asset concentration factor. The asset concentration charge is computed by
151
Note, for simplicity, only certain assets were included in the example.

FINANCIAL REPORTING THROUGH THE LENS OF A PROPERTY/CASUALTY ACTUARY
Part IV. Statutory Filings to Accompany the Annual Statement
263
multiplying the RBC charge for each asset class by the associated RBC factor for that class.
For simplicity, assume that each of the bond investments is class 02 and each of the
preferred stock investments is class 03. Table 81 provides the calculation of the asset
concentration RBC charge within R
1
and R
2
.
TABLE 81
Example
Calculation of Asset Concentration RBC
Book/Adjusted Additional
Fixed Income Assets Carrying Value Factor RBC
Class 2 Unaffiliated Bonds 3,490 0.010 35
Class 3 Unaffiliated Bonds - 0.020 -
Class 4 Unaffiliated Bonds - 0.045 -
Class 5 Unaffiliated Bonds - 0.100 -
Collateral Loans 1,200 0.050 60
Mortgage Loans - 0.050 -
Subtotal Fixed Income 4,690 0.020 95
Book/Adjusted Additional
Equity Assets Carrying Value Factor RBC
Class 2 Unaffiliated Preferred Stock - 0.010 -
Class 3 Unaffiliated Preferred Stock 1,700 0.020 34
Class 4 Unaffiliated Preferred Stock - 0.045 -
Class 5 Unaffiliated Preferred Stock - 0.100 -
Class 2 Unaffiliated Hybrid Securities - 0.010 -
Class 3 Unaffiliated Hybrid Securities - 0.020 -
Class 4 Unaffiliated Hybrid Securities - 0.045 -
Class 5 Unaffiliated Hybrid Securities - 0.100 -
Unaffiliated Common Stock 1,200 0.150 180
Investment Real Estate 35 0.100 4
Encumbrance on Investment Real Estate - 0.100 -
Schedule BA Assets - 0.050 -
Aggregate Write-Ins for Invested Assets - 0.050 -
Derivatives - 0.050 -
Receivable for Securities - 0.025 -
Subtotal Equity 2,935 0.074 218
Grand Total Asset Concentration 312
The asset concentration RBC charge for fixed income investments within R
1
is $94,900 and
the asset concentration RBC charge for equity within R
2
is $217,500, resulting in a total asset
concentration RBC charge of $312,400.

FINANCIAL REPORTING THROUGH THE LENS OF A PROPERTY/CASUALTY ACTUARY
Part IV. Statutory Filings to Accompany the Annual Statement
264
R
1
for Fictitious
To further illustrate the RBC charges, we used the Annual Statement for Fictitious Insurance
Company to build a full example of the NAIC RBC calculations.
152
Because Schedule D is not
included in the Annual Statement for Fictitious, we had to make assumptions in preparing the
calculation, such as the distribution of fixed assets by RBC class. Table 82 provides the R
1
portion of the RBC calculation for Fictitious.
TABLE 82
R
1
Charge for Fictitious Insurance Company
NAIC Risk-Based Capital 2018
R
1
Calculation — Fixed Income Assets
Amount
Held
Charge
Factor
RBC
Charge
Cash and Cash Equivalents
154,000
0.0030
462
Total Other Short
-
Term Investments
829,000
0.0030
2,487
Mortgage Bonds
245,000
0.0500
12,250
Net Admitted
Collateral Loans
0
0.0500
0
Bonds
U.S. Government
6,395,684
0.0000
0
Class 01 U.S. Government Agency B
onds
0
0.0030
0
Class 01 Unaffiliated Bonds
46,060,660
0.0030
138,182
Class 02 Unaffiliated Bonds
4,987,460
0.0100
49,875
Class 03
Unaffiliated Bonds
704,112
0.0200
14,082
Class 04 Unaffiliated Bonds
352,056
0.0450
15,843
Class 05 Unaffiliated Bonds
1
17,352
0.1000
11,735
Class 06 Unaffiliated Bonds
58,676
0.3000
17,603
Subtotal
—
Bonds subject to bond size factor
58,676,000
247,319
Estimated number of bonds
120
Count
Multiplier
Weighting
0 to 50
50
2.50
125
5
0 to 100
50
1.30
65
100 to 400
20
1.00
20
More than 400
0
0.900
0
Sum (weighted average)
120
1.750
210
Bond
size factor RBC
247,319
0.750
185,490
Asset concentration RBC
87,825,000
0.0012
105,390
Total R
1
Charge
—
Fixed Income Assets Risk
553,398
152
Note that Fictitious Insurance Company does not have any affiliated entities or miscellaneous off-balance sheet
amounts. Therefore, the R
0
charge is zero for Fictitious.

FINANCIAL REPORTING THROUGH THE LENS OF A PROPERTY/CASUALTY ACTUARY
Part IV. Statutory Filings to Accompany the Annual Statement
265
THE RBC CHARGE FOR ASSET RISK ASSOCIATED WITH EQUITY INVESTMENTS (R
2
)
R
2
includes the charge for risk associated with equity investments in the following:
1. Affiliated investments
2. Unaffiliated stocks
3. Real estate
4. Schedule BA assets
5. Miscellaneous assets, including receivables for securities, aggregate write-ins for
invested assets and derivatives
6. Replication (synthetic asset) transactions and mandatory convertible securities
Typically, investments in unaffiliated stocks and Schedule BA assets, as well as the asset
concentration RBC charge, represent most of the risk charge within R
2
for property/casualty
insurers.
As discussed for R
0
, there is an RBC charge for the ownership of common stock in insurance
affiliates which includes an R
2
component – this gets rolled up with the unaffiliated stocks
component of the RBC formula. Additionally, for R
1
, half of the RBC charge for replication
transactions and mandatorily convertible securities listed above as item 6 is applied to R
2
.
Similarly, there is the additional charge for asset concentration in the 10 largest issuers for
each type of equity investment. The calculation is performed as described within the previous
section of this chapter covering the Asset Risk – Fixed Income (R
1
) component.
We will continue by providing a brief discussion of the charges for the different types of
equity investments (items 1 through 6).
Affiliated investments
The following list includes the different categories of affiliated investments included in R
2
,
which can be described generally as affiliated entities not subject to RBC (other than alien
affiliates):
• Investment affiliates
• Holding companies
• Upstream affiliates (parent)
• Property & Casualty insurance affiliates not subject to RBC
• Life insurance affiliates not subject to RBC
• Health insurance affiliates not subject to RBC
• Other affiliates

FINANCIAL REPORTING THROUGH THE LENS OF A PROPERTY/CASUALTY ACTUARY
Part IV. Statutory Filings to Accompany the Annual Statement
266
The R
2
charge for investments in insurance affiliates not subject to RBC is calculated by
multiplying a factor by the book/adjusted carrying value of the common and preferred stock
of those affiliates.
Investment Affiliates
According to the NAIC RBC Instructions, “An investment affiliate is an affiliate that exists only
to invest the funds of the parent company. The term investment affiliate is strictly defined in
the annual statement instructions as any affiliate, other than a holding company, engaged or
organized primarily to engage in the ownership and management of investments for the
insurer, not including any broker-dealer or a money management fund managing funds other
than those of the parent company.”
153
In other words, the RBC charge for an investment affiliate is essentially the same as it would
be if the reporting entity held the assets directly. For example, if the reporting entity owned a
subsidiary that managed $1 billion of its investments in common stock, then the RBC charge
for that entity would be computed based on the $1 billion common stock portfolio. If the
charge for these investments would have been $10 million if the reporting entity owned the
stock directly, then the charge for the investment affiliate would also be $10 million. If the
entity only owned 60% of the investment affiliate, then the RBC charge would be $6 million (=
0.6 * $10 million).
The RBC charge for an investment in an investment affiliate is 0.225 times the carrying value
of the common and preferred stock.
Holding Companies
For investment in a holding company, the RBC charge is 0.225 times the holding company
value in excess of the carrying value (i.e., holding company value minus carrying value) for
indirectly owned insurance affiliates.
Let’s use an example to illustrate this calculation. In this example, we will use another fictional
company named Reporting Entity Insurance Company (REIC).
Assume REIC purchased 100% of the shares in a holding company called HC Company in
2018. Also assume that HC Company has the following assets on its December 31, 2018,
balance sheet, as illustrated in Table 83.
153
NAIC, RBC Property & Casualty 2018 Forecasting & Instructions, page 5.

FINANCIAL REPORTING THROUGH THE LENS OF A PROPERTY/CASUALTY ACTUARY
Part IV. Statutory Filings to Accompany the Annual Statement
267
TABLE 83
Total assets
held by HC Company as of December 31, 201
8
Assets
Distribution
Type of asset
12/31/201
8
by asset type
U.S. Sub Life Insurance Company
5,000,000
10%
U.S. Sub Property/Casualty Insurance Company
15,000,000
30%
UK Sub
Property/Casualty In
surance Company
10,000,000
20%
Common Stock
8,000,000
16%
Preferred Stock
12,000,000
24%
Total assets
50,000,000
100%
U.S. Sub Life Insurance Company, U.S. Sub Property/Casualty Insurance Company and UK
Sub Property/Casualty Insurance Company are directly owned by HC Company and indirectly
owned by REIC as a result of REIC’s ownership of HC.
Recall that book/adjusted carrying value is used in computing the R
0
charge. The carrying
value of an indirectly owned insurance subsidiary will depend on the carrying value of the
holding company and percentage of the holding company carrying value that the subsidiary
represents. Let’s continue our example to illustrate.
Assume that REIC carried HC Company on its Annual Statement at year-end 2018 at a value
of $55 million, which is equal to the market value of the shares. Of this amount, 10%, or $5.5
million, would represent the carrying value of U.S. Sub Life Insurance Company for purposes
of determining the R
0
charge in REIC’s RBC calculation. Similarly, $16.5 million (= 0.3 * $55
million) would be the carrying value for U.S. Sub Property/Casualty Insurance Company, and
$11 million is the value for the alien insurer, UK Sub Property/Casualty Insurance Company.
If REIC had only purchased, for example, 66% of the shares of HC Company, each carrying
value would be adjusted by REIC’s ownership interest of 66%. The corresponding values would
be $3.63 million, $10.89 million and $7.26 million for the three subsidiaries of HC Company,
respectively.
Now back to our discussion of the R
2
charge for investments in holding companies. The RBC
charge is 0.225 times the holding company value in excess of the carrying value of indirectly
owned insurance affiliates calculated in R
0
. In our example, this would be 0.225 times $22
million, where $22 million is derived as in Table 84.

FINANCIAL REPORTING THROUGH THE LENS OF A PROPERTY/CASUALTY ACTUARY
Part IV. Statutory Filings to Accompany the Annual Statement
268
TABLE 84
Reporting Entity Insurance Company (REIC)
Carrying value
HC Company
55,000,000
U.S. Su
b Life Insurance Company
5,500,000
U.S. Sub
Property/Casualty Insurance Company
16,500,000
UK Sub Property/Casualty Insurance Company
11,000,000
Subtotal, indirectly owned insurance subsidiaries
33,000,000
Holding company minus indirectly owned su
bs
22,000,000
Upstream Affiliates (i.e., Parent Company)
For bond investments in a parent company, the RBC charge is 0.225 times the carrying value
of the common and preferred stock of the parent, regardless of whether the parent is subject
to RBC.
Property & Casualty Insurance Affiliates
For P/C insurance affiliates that are not subject to RBC, including title insurers, monoline
financial guaranty insurers, and monoline mortgage guaranty insurers, the RBC charge is
0.225 times the book/adjusted carrying value of the common and preferred stock.
Life Insurance Affiliates
For Life insurance affiliates that are not subject to RBC, the RBC charge is 0.225 times the
book/adjusted carrying value of the common stock and preferred stock.
Health Insurance Affiliates
For Health insurance affiliates that are not subject to RBC, the RBC charge is 0.225 times the
book/adjusted carrying value of the common stock and preferred stock.
Other Affiliates
Non-insurance and insurance affiliates not included elsewhere in this chapter are classified as
Other Affiliates. The RBC charge for investments in Other Affiliate is 0.225 times the carrying
value of the common and preferred stock.
Unaffiliated Stocks
The RBC charge for unaffiliated preferred stocks and hybrid investments is equal to the
book/adjusted carrying value of the asset multiplied by a factor, where the factors vary based
on the NAIC class. The classes for preferred stocks and hybrid securities are the same as
those for bonds, as are the RBC factors, with the exception that there are no federal
government guaranteed preferred stocks:

FINANCIAL REPORTING THROUGH THE LENS OF A PROPERTY/CASUALTY ACTUARY
Part IV. Statutory Filings to Accompany the Annual Statement
269
TABLE 85
NAIC class for preferred stocks and hybrid securities
RBC
factor
Class 01
—
Highest credit quality
0.003
Class 02
—
High credit quality
0.010
Class 03
—
Medium credit quality
0.020
Class 04
—
Low credit quality
0.045
Class 05
—
Lowest credit quality
0.100
Class 06
—
In or near default
0.300
The RBC charge for unaffiliated common stocks is computed separately for non-government
money market funds and other admitted unaffiliated common stocks. The computation
applies a specific factor to the book/adjusted carrying value. The RBC factor for non-
government money market funds of 0.003 is equal to that for cash because these
investments are considered to be of the same risk level. The factor applied to other common
stocks is 0.150.
Real Estate, Schedule BA and Miscellaneous Assets
In general, the RBC charge for real estate investments, other long-term invested assets (as
per Schedule BA) and miscellaneous assets are computed as a factor times the book/adjusted
carrying value for those assets. The RBC charges for each investment are as follows:
• 0.100 times the book value of real estate (Annual Statement Schedule A assets)
o According to the NAIC RBC Instructions, encumbrances have been included in
the real estate base since the value of the property subject to loss would
include encumbrances
154
• 0.200 times the book value for other long-term invested assets (Annual Statement
Schedule BA assets) other than collateral loans
• 0.050 times the book value for aggregate write-ins for invested assets and derivatives
• 0.025 times the book value for receivables for securities
R
2
for Fictitious
Table 86 shows the calculation of R
2
for Fictitious Insurance Company. As with the calculation
of R
1
for Fictitious, we had to make several assumptions because only excerpts of Fictitious’
Annual Statement are included with this publication. One such assumption that is relevant to
the calculation of R
2
is the distribution of stock by RBC class.
154
NAIC, RBC Property & Casualty 2018 Forecasting & Instructions, page 8.

FINANCIAL REPORTING THROUGH THE LENS OF A PROPERTY/CASUALTY ACTUARY
Part IV. Statutory Filings to Accompany the Annual Statement
270
TABLE 86
155
R
2
Charge for Fictitious Insurance Company
NAIC Risk-Based Capital 2018
Total R
O
Charge
—
Subsidiary Insurance Companies and Misc.
Other Amounts
0
__
Total R
1
Charge
—
Fixed Income Asset Risk
553,398
R
2
Calculation — Equity Asset Risk
Amount
Held
Charge
Factor
RBC
Charge
A
ffiliated
Investments
Non
-
Insurance Affiliated Common Stock
0
0.2250
0
__
Unaffiliated Preferred Stock
Class 01 Unaffiliated Preferred Stock
10,880
0.0030
33
Cl
ass 02 Unaffiliated Preferred Stock
0
0.0100
0
Class 03 Unaffiliated Preferred Stock
0
0.0200
0
Class 04 Unaffiliated Preferred Stock
23,120
0.0450
1,040
Class 05 Unaffiliated Preferred Stock
0
0.1000
0
Class 06 Unaffiliated Preferred Stock
0
0.3000
0
Unaffiliated Common Stock
Non
-
government money market funds
0
0.0030
0
Other admitted unaffiliated common stock
19,340,000
0.1500
2,901,000
Other
L
ong
-
T
erm
A
ssets
Real Estate
3,845,000
0.1000
384,500
Schedule BA
Assets Excluding Collateral Loans
4,628,000
0.2000
925,600
Miscellaneous A
ssets
Aggregate W/I for Invest
ed
Assets
(5,000)
0.0500
0
All Other Invested Assets
79,000
0.0500
3,950
Receivables for Securities
0
0.0
25
0
0
As
set concentration RBC
87,825,000
0.0010
87,825
Total R
2
Charge
—
Equity Assets Risk
4,303,948
THE RBC CHARGE FOR CREDIT RISK (R
3
)
Credit risk reflects counterparty (the entity owing the insurance company money) credit
exposure for receivables, including those relating to reinsurance. It contemplates the risk that
the counterparty will default (or not pay in whole or in part) and the risk associated with
estimating the amounts recorded for counterparty receivables.
R
3
is the charge for credit risk associated with the following:
1. Reinsurance recoverable (reinsurance RBC)
2. Non-invested assets
155
Note the RBC charge is greater than or equal to 0 as in the case of Aggregate Write-ins (W/I) for Invested Assets
in Table 86.

FINANCIAL REPORTING THROUGH THE LENS OF A PROPERTY/CASUALTY ACTUARY
Part IV. Statutory Filings to Accompany the Annual Statement
271
3. Health credit risk
The largest component of R
3
in the industry is the risk associated with uncollectible
reinsurance (due both to reinsurers being unable and unwilling to pay). While there is a charge
for health credit risk, it is historically zero for most property/casualty companies across the
industry.
Reinsurance recoverables
The R
3
charge for reinsurance recoverables reflects the risk that reinsurers cannot or will not
pay amounts the reporting entity expects to receive under the terms of its reinsurance
contracts.
Over the years there has been considerable focus in the property/casualty industry on
reinsurance. For one, uncollectible reinsurance was deemed partly to blame for the failure of
Mission Insurance Company and Transit Casualty Company,
156
which helped set RBC in motion
for the property/casualty industry. Furthermore, throughout the years, reinsurance has been
used in certain situations inappropriately to enhance a company’s financial position or hide
poor financial results.
157
From its inception, the RBC formula applied a simple 10% loading to all eligible reinsurance
recoverables. Despite the relatively low impact that R
3
has on the industry as a whole, the
charge has been subject to criticism from insurance carriers, who have argued that the
charge does not differentiate between high and low rated reinsurers, or give credit for those
recoverables that are backed by collateral.
From 2018,
158
a new formula was introduced to address these concerns. This new formula is
performed at the transaction level and those results are then summed to determine the
charge. It applies differentiated risk charges to each reinsurer counterparty based on their
credit quality, as indicated by a rating from an approved rating agency, as well as whether or
not the recoverables are collateralized.
The charge is calculated within columns 28 through 36 of Schedule F, Part 3, of the Annual
Statement. Details of this part of the calculation are described in Chapter 14 covering
Schedule F (section titled “Credit Risk on Ceded Reinsurance (columns 21 through 36)”). The
156
U.S. House of Representatives Subcommittee on Oversight and Investigations of the Committee on Energy and
Commerce, Failed Promises-Insurance Company Insolvencies, 101 Cong., 2rid sess., February 1990. Washington,
D.C.: GPO, 1993.
157
Feldblum, S., “NAIC Property/Casualty Insurance Company Risk-Based Capital Requirements,” PCAS LXXXIII,
1996, pages 317-319.
158
Earlier versions of the new formula for the reinsurance recoverables component of R
3
were included for
informational purposes only in the RBC filings in 2016 and 2017 while it was under development.

FINANCIAL REPORTING THROUGH THE LENS OF A PROPERTY/CASUALTY ACTUARY
Part IV. Statutory Filings to Accompany the Annual Statement
272
RBC formula uses the total row of the results shown in columns 35 and 36 as inputs to the R
3
risk charge.
Overall, the implementation of this new formula has reduced the level of RBC for reinsurance
recoverables by almost a half across the industry.
159
The RBC charge for reinsurance recoverable is split 50%/50% between R
3
and R
4
in
circumstances where the reserve RBC charge (see discussion below) exceeds the sum of the
credit risk RBC charge for non-invested assets plus one-half of the RBC charge for
reinsurance recoverables. Otherwise, the full amount of the reinsurance recoverable RBC
charge is included in R
3
. The concept of moving half of the reinsurance recoverable RBC
amount to R
4
is to recognize there is some dependency between deterioration in reserves and
an increase in exposure to reinsurance credit risk. The limitation on splitting the charge based
on the size of the reserve RBC charge is put in place so the insurance company cannot
diversify away a portion of its credit risk in situations where the company has limited net
reserves.
Non-invested assets
R
3
includes the charge for risk associated with credit exposure resulting from the following
non-invested assets listed on the balance sheet:
1. Investment income due and accrued
2. Guaranty funds receivable or on deposit
3. Recoverable from parent, subsidiaries and affiliates
4. Amounts receivable relating to uninsured Accident and Health plans
5. Aggregate write-in for other than invested assets
The RBC charge for these assets is the net admitted value included in column 3 of the asset
side of the balance sheet (page 2 of the Annual Statement), each multiplied by a factor of
0.050, with the exception of investment income due and accrued, which receives a factor of
0.010. The factor for investment income due and accrued is equal to the RBC factor applied
to unaffiliated class 02 bonds because most of the investment income due and accrued comes
from bonds, which are typically the largest holding for a property/casualty insurance
company. The receivable assets are generally short-term balances generated in the normal
course of doing business. The capital charges for these assets are lower than other long-term
recoverables.
Health credit risk
Finally, R
3
also includes a charge for health credit risk for those reporting entities writing 5%
or more in accident and health premiums in any of the last three years. This charge considers
159
NAIC, Summary: Aggregate P/C RBC Results By Year, 2018,
http://www.naic.org/documents/research_stats_rbc_results_pc.pdf

FINANCIAL REPORTING THROUGH THE LENS OF A PROPERTY/CASUALTY ACTUARY
Part IV. Statutory Filings to Accompany the Annual Statement
273
the risk associated with transferring health risks (morbidity and mortality) to health care
organizations through fixed prepaid amounts (i.e., capitated payments).
160
There is a risk of
non-payment in these situations (similar to traditional reinsurance recoverables). Therefore, a
charge is applied to reflect the credit risk associated with the portion of capitated payments
over and above the security held by the reporting entity for these organizations.
Given that this charge is generally zero for most companies in the property/casualty industry,
we will not go into details of the calculation of this charge.
R
3
for Fictitious
Table 87 illustrates the calculation of R
3
for Fictitious.
TABLE 87
R
3
Charge for Fictitious Insurance Company
NAIC Risk-Based Capital 2018
Total R
O
Charge
—
Subsidiary Insurance Companies and Misc. Other Amounts
0
Total R
1
Charge
—
Fixed Income Asset Risk
553,398
To
tal R
2
Charge
—
Equity Asset Risk
4,303,948
R
3
Calculation — Credit-Related Assets
Amount
Held
Charge
Factor
RBC
Charge
Total RBC Requirement for Collateralized RI Recoverables
(Sch F, Part 3, Col 35)
132,000
Total RBC Requirement for Uncollateralized RI Recoverables
(Sch F, Part 3, Col 36)
415,000
Investment Income Due & Accrued
726,000
0.0
1
0
7,260
Guaranty Funds Receivable or on Deposit
0
0.050
0
Recoverable from Parent, Subs and Affils
0
0.050
0
Amts Re
ceivable relating to Uninsured A&H Plans
0
0.050
0
Agg. Write
-
ins for other than Inv. Assets
586
,000
0.050
29
,
300
Health Credit Risk
0
Total 583,560
Half of Reinsurance Recoverables Moved to R
4
273,500
Total R
3
Charge
—
Cred
it
-
Related Asset Risk
31
0,
060
160
Health care organizations include health maintenance organizations or managed care organizations.

FINANCIAL REPORTING THROUGH THE LENS OF A PROPERTY/CASUALTY ACTUARY
Part IV. Statutory Filings to Accompany the Annual Statement
274
THE RBC CHARGE FOR RESERVE RISK (R
4
)
R
4
is very often the largest of the RBC charges for property/casualty insurers. Reserve risk
contemplates the risk that a reporting entity’s loss and LAE reserves will develop adversely.
This charge is calculated separately by line of business using Schedule P data for the last 10
years.
R
4
is the charge for reserve risk associated with the following:
1. Unpaid loss and LAE (reserve RBC)
2. Excessive premium growth
3. Reinsurance recoverable (reinsurance RBC)
4. Accident and Health (A&H) claim reserves (health RBC)
Within the following sections we provide a discussion of each of these categories, with
considerable focus on the reserve RBC since this represents the dominant component of the
R
4
charge.
Reserve RBC
Reserve RBC is determined by applying a set of factors (called company RBC percent) to the
company’s net loss and LAE reserves before non-tabular discount. Nominal (undiscounted)
reserves are used because consideration for investment income is made by applying the same
set of discount factors to all property/casualty insurance companies (called the adjustment
for investment income). The use of a common method for considering investment income
puts all property/casualty companies on an equivalent basis rather than having differences
due to discount rates and payout patterns.
The calculation is performed separately by line of business using the same lines of business as
used in Schedule P of the Annual Statement, with the exception that certain lines of business
are combined. The occurrence and claims-made categories are combined for other liability
and product liability, and reinsurance property and financial lines are combined.
Once the calculation of the base loss and LAE reserve RBC is performed for each line of
business, two adjustments are made: one for loss sensitive (e.g., retrospectively rated)
contracts and the other for loss concentration. Similar to the asset concentration factor in R
1
and R
2
, the loss concentration factor considers diversification in the RBC calculation. Both
adjustments result in reductions to the reserve RBC.
We will discuss each component of the calculation, providing examples where applicable.
Base loss and LAE reserve RBC by line of business
The base loss and LAE reserve RBC by line of business is computed as follows:

FINANCIAL REPORTING THROUGH THE LENS OF A PROPERTY/CASUALTY ACTUARY
Part IV. Statutory Filings to Accompany the Annual Statement
275
Equation 1: Base Loss and LAE Reserve RBC
= [[[Company RBC % + 1] * Adjustment for investment income] – 1]
* [Net loss and LAE reserve + Other discounts not in the reserves]
The net loss and LAE reserves used in this calculation are provided in Schedule P, Part 1,
column 24, for each line of business. As previously noted, these are gross of non-tabular
discount, but net of tabular discount.
Company RBC percentage
The company RBC percentage is the crux of the reserve risk charge. According to the NAIC
RBC instructions, “These factors are designed to provide a surplus cushion against adverse
reserve development.”
161
For each line of business, the company RBC percentage is determined based on a 50%
weighting applied to the straight industry reserve RBC percent and 50% applied to the
industry reserve RBC percent adjusted for the company’s own experience.
• Industry reserve RBC percent
The industry reserve RBC percent is a set of factors provided by the NAIC and is the
same for all property/casualty insurance companies. There is one factor for each
Schedule P line of business. According to the NAIC RBC instructions, these
percentages “are based on detailed analysis of historical reserve development
patterns found in Parts 2 and 3 of Schedule P for each major line of business.”
162
They
have been determined in the past by computing the ratio of net incurred loss and
defense and cost containment (DCC) development during a particular period from
Schedule P, Part 2, to the net loss and DCC reserves as of the earlier period
(calculated by subtracting the figures in Schedule P, Part 3 from those in Part 2). The
industry percent factor is selected based on the average for all companies within the
property/casualty insurance industry, by line of business.
The industry RBC percent factors are not always updated annually, but rather on an
as-needed basis. In fact, the factors in the original RBC model remained for well over
10 years. The only interim change was made to reflect the change in the format of
Schedule P, such as when medical malpractice was split into its claims made and
occurrence components.
161
NAIC, RBC Property & Casualty 2018 Forecasting & Instructions, page 21.
162
Ibid.

FINANCIAL REPORTING THROUGH THE LENS OF A PROPERTY/CASUALTY ACTUARY
Part IV. Statutory Filings to Accompany the Annual Statement
276
The NAIC developed the original factors in 1993 based on an actuarial analysis using
data evaluated as of 1991 and prior.
163
This analysis computed the aforementioned
ratios of incurred loss and DCC to prior period reserves over each evaluation period
provided in Schedule P, Parts 2 and 3 of the 1991 Annual Statement. Nine ratios were
computed, the first of which provided development on accident years 1982 and prior
over the period December 31, 1982 through December 31, 1991, as a ratio to loss
and DCC reserves as of December 31, 1982. The remaining eight ratios were
computed measuring development to December 31, 1991, for periods beginning
December 31, 1983 through December 31, 1990. The nine ratios were calculated for
each line of business by company. An average was computed over all companies for
each evaluation period. The industry RBC percent factor for each line of business was
set equal to the largest ratio over all of the evaluation dates. This is commonly
referred to as the “worst-case year” ratio. The belief is that development of this
magnitude could occur in the future because it occurred in the past.
164
The original factors remained until 2008, when the NAIC adopted changes
recommended by the American Academy of Actuaries P/C Risk-Based Capital
Committee (Committee) in a report titled An Update to P/C Risk-Based Capital
Underwriting Factors: September 2007 Report to the National Association of Insurance
Commissioners P/C Risk-Based Capital Working Group. In this study, the Committee
recognized that the insurance industry had been through many changes since the
original factors were developed, namely changes in the underwriting cycle resulting in
shifts in reserve redundancies/deficiencies. Furthermore, despite the formulaic
approach of the worst-case year, the Committee found that the original factors could
not be easily replicated and varied considerably relative to expectations as to the level
of adverse development inherent in a particular line of business. The Committee
therefore recommended developing a revised approach that would meet the following
criteria:
1. Simple to apply and understand;
2. Responsive to actual history and underlying risk;
3. Easily reproducible by future practitioners;
4. Statistically relevant;
163
American Academy of Actuaries, “An Update to P/C Risk-Based Capital Underwriting Factors: September 2007
Report to the National Association of Insurance Commissioners P/C Risk-Based Capital Working Group,” page 3.
164
Feldblum, S., “NAIC Property/Casualty Insurance Company Risk-Based Capital Requirements,” PCAS LXXXIII,
1996, pages 327-329.

FINANCIAL REPORTING THROUGH THE LENS OF A PROPERTY/CASUALTY ACTUARY
Part IV. Statutory Filings to Accompany the Annual Statement
277
5. Resulting in indications that could be adopted without disruptive swings in
required capital for regulated companies.”
165
The revised approach differed from the original approach in four significant ways:
1. The historical data was filtered and screened to remove companies with
insufficient or unusual data points. Examples include companies with less than
10 years of experience and/or companies with negative paid, reserve and/or
incurred loss and DCC in any one accident year.
2. Rather than selecting the ratio from the worst-case year over the average of all
companies, the 87.5 percentile of all data points was used. “The 87.5
percentile was selected because it represents a conservative view of the risk in
each line but is also broadly consistent with the existing factors.”
166
3. A floor was set such that the indicated industry reserve RBC percent factor
resulted in a minimum charge of 5% after adjustment for investment income.
4. The indicated industry reserve RBC percent factors were capped to limit the
change in the base loss and LAE reserve RBC. The Committee recommended a
cap of 35%.
167
For example, the indicated industry reserve RBC factor for private passenger
automobile liability that was produced using the revised methodology before capping
was 0.128, and the change in the investment income adjustment factor was 0.927.
Using Equation 1 (assuming a net loss and LAE reserve balance of $1.00), the implied
base loss and LAE reserve RBC is 0.046. As displayed below, this represented a
change of -70.5% from the original industry reserve RBC factor of 0.254 with
adjustment for investment income of 0.921:
Indicated base loss and LAE reserve RBC based on 2007 methodology before capping:
= [[[0.128 + 1] * 0.927] – 1] *$1.00
= 0.046
Original base loss and LAE reserve RBC:
= [[[0.254 + 1] * 0.921] – 1] *$1.00
= 0.155
Change in base loss and LAE reserve RBC from original to revised (2007)
methodology:
165
American Academy of Actuaries, An Update to P/C Risk-Based Capital Underwriting Factors: September 2007
Report to the National Association of Insurance Commissioners P/C Risk-Based Capital Working Group, pages 2 and
3.
166
Ibid, page 6.
167
Ibid, pages 6 and 7.

FINANCIAL REPORTING THROUGH THE LENS OF A PROPERTY/CASUALTY ACTUARY
Part IV. Statutory Filings to Accompany the Annual Statement
278
= 0.046 / 0.155 - 1
= -70.5%
Capped at 35%, the revised methodology produced an industry reserve RBC percent
factor of 0.187, which was calculated as follows:
= [[[(-0.350 +1) * 0.155] +1] / 0.927] - 1
= 0.187
To summarize, the industry RBC reserve factor indicated from the revised 2007
methodology was 0.128 before capping and 0.187 after the 35% cap. The 35% cap
reduced the impact of the change in methodology from the original factor of 0.254.
168
The NAIC adopted the factors in 2008 using the revised methodology and indications
of the September 2007 report, however with a cap at 15% instead of 35%. The revised
factors were applied to RBC calculations for the 2008 reporting year. To continue with
the previous example, capping at 15% resulted in an industry RBC reserve percent
factor of 0.221, which was calculated as follows:
= [[[(-0.150 +1) * 0.155] +1] / 0.927] - 1
= 0.221
169
Subsequent changes to the industry reserve RBC percent factors were also made and
adopted in 2009 and 2010. The 2009 update applied a 15% cap to the factors adopted
in 2008. That is, 2008 factors were substituted in for the “original” factors in the
previous calculations, for purposes of capping the impact from the effects of the 2007
revised methodology. This revision was adopted in 2009 and applied to the 2009
reporting year.
170
Two changes were made in 2010. First, in March 2010, the American Academy of
Actuaries P/C Risk-Based Capital Working Group updated the 2007 methodology but
with 2008 data. As with the 2007 study, the factors were capped to cause no more
than a 15% change to the current factors (2009 updated factors), and the minimum
charge was set at 5%.
171
Second, in June 2010, the March 2010 study was updated
168
Ibid, Appendix II, Exhibit I – III.
169
American Academy of Actuaries, Update to P/C Risk-Based Capital Underwriting Factors Presented to National
Association of Insurance Commissioners P/C Risk-Based Capital Working Group, March 2008.
170
American Academy of Actuaries, 2009 Update to P/C Risk-Based Capital Underwriting Factors Presented to
National Association of Insurance Commissioners’ P/C Risk-Based Capital Working Group, December 2008.
171
American Academy of Actuaries, 2010 Update to P/C Risk-Based Capital Underwriting Factors Presented to the
National Association of Insurance Commissioners’ Property Risk-Based Capital Working Group, March 2010.

FINANCIAL REPORTING THROUGH THE LENS OF A PROPERTY/CASUALTY ACTUARY
Part IV. Statutory Filings to Accompany the Annual Statement
279
using a 5% cap instead of 15%.
172
The 2010 study capped at 5% was adopted and
applied to the 2010 reporting year.
The 2017 RBC formula had a further update to the industry RBC reserve factors, the
first since 2010. This update was based on changes recommended by the American
Academy of Actuaries P/C Risk-Based Capital Committee in a report titled 2016
Update to Property and Casualty Risk-Based Capital Underwriting Factors.
173
This
report proposed a new calibration based on data from Annual Statements 1997-2014
and calculates the 87.5 percentile subject to the following filtering:
o Survivorship – Include data points where, for a particular company and line of
business there is no net earned premium in the latest accident year(s).
o Line of business size – Exclude data points where, for a particular line of
business, net earned premiums are less than the 15
th
percentile for that
accident year or reserve year.
o Pooling – Combine data points from intercompany pool participants into a
single pool-wide data point.
o Minor Lines – Exclude data points where the net earned premium for the line
of business represents a small portion of the company’s total net earned
premium.
o Years of line of business with net earned premium >0 – Exclude data points
where, for a particular company and line of business, there is less than five
years of net earned premium
o Maturity – Remove the least mature data points.
o Anomalous values – Exclude data points with anomalous values, i.e., negative
loss ratios, negative initial reserves and reserve runoff ratios over/under
500%/-500%.
In 2017, the NAIC’s Property and Casualty Risk-Based Capital (E) Working Group
updated the industry RBC reserve factors in the 2017 RBC formula to the 10% capped
level, representing scenario #1 in the report. The factors were due to be re-evaluated
again and expected to reach the fully proposed values in the following four years.
In 2018, the NAIC’s Property and Casualty Risk-Based Capital (E) Working Group
further revised the factors to be included in the 2019 RBC formula by adopting the
35% capped factors (scenario #3) for commercial insurance, medical professional
liability and all other lines, while adopting the uncapped factors (scenario #4) for
personal and reinsurance lines.
172
Letter from the American Academy of Actuaries P/C Risk-Based Capital Working Group to the National
Association of Insurance Commissioners Capital Adequacy (E) Task Force Re: Risk-Based Capital Underwriting
Factors – 2010 Update – Addendum Using 5 Percent Cap, dated June 22, 2010.
173
https://www.actuary.org/sites/default/files/files/publications/PC_RBC_UWFactors_10282016.pdf

FINANCIAL REPORTING THROUGH THE LENS OF A PROPERTY/CASUALTY ACTUARY
Part IV. Statutory Filings to Accompany the Annual Statement
280
• Company “development factor”
The reporting entity’s own loss experience is considered by adjusting the industry
reserve RBC percent by the company “development factor” by line of business. This
development factor is calculated as the ratio of the sum of incurred loss and DCC from
nine prior accident years evaluated as of the current year to the sum of the initial
evaluations of those incurred amounts. The current incurred loss and DCC values
come from Schedule P, Part 2, column 10, with the initial values coming from the first
incurred value shown for each accident year. The initial values lie along the diagonal.
This development factor measures how the initial estimates of ultimate loss and DCC
have developed based on what the company currently knows. The factor is capped at
400% to limit the impact of anomalous, one-time results.
The reporting entity may not rely on its own experience in determining the company
RBC percentage if:
1. Either the initial or current values shown in Schedule P, Part 2, are negative for
any year.
2. The current value is zero for any year.
3. The sum of the initial values is zero across all years.
Adjustment for investment income
With the exception of workers’ compensation tabular reserves, and instances where a
company has explicitly requested and received permission from state regulatory authorities
to discount non-tabular reserves, insurance companies are required to record loss and LAE
reserves on an undiscounted basis under statutory accounting. This creates an inherent
margin in surplus. For purposes of determining required capital under the RBC calculation,
the reserves are adjusted to remove this margin.
174
Similar to the industry reserve RBC percent, the investment income factors are provided by
the NAIC. According to the NAIC RBC instructions, “This discount factor assumes a 5 percent
interest rate. For lines of business other than workers’ compensation and the excess
reinsurance lines, the payment pattern is determined using an IRS type methodology applied
to industry-wide Schedule P data by line of business; otherwise, a curve has been fit to the
data to estimate the average payout over time. The discount factor for workers’
compensation is adjusted to reflect the tabular portion of the reserves that is already
discounted.“
175
Tabular discounting is typically permitted only on the indemnity portion of
174
Feldblum, S., “NAIC Property/Casualty Insurance Company Risk-Based Capital Requirements,” PCAS LXXXIII,
1996, page 354.
175
NAIC, RBC Property & Casualty 2018 Forecasting & Instructions, page 21.

FINANCIAL REPORTING THROUGH THE LENS OF A PROPERTY/CASUALTY ACTUARY
Part IV. Statutory Filings to Accompany the Annual Statement
281
workers’ compensation reserves and not to the medical component due to the relatively fast
payment of medical expenses.
Similar to the industry reserve RBC percent, the investment income adjustment factors were
updated in September 2007 from their original values. An approach similar to the original
methodology was followed but applied to updated data through 2005.
176
Other discounts not included in the reserves
The adjustment for investment income is applied to reflect non-tabular discount. It is applied
to loss and LAE reserves on a net of reinsurance basis, net of tabular discount, but before any
non-tabular discount, as provided in column 24 of Schedule P, Part 1. If for some reason the
amounts included in column 24 are net of non-tabular discount, the amount of the non-
tabular discount would need to be added back to the reserves before applying the adjustment
for investment income.
These amounts are generally equal to zero; the amount of non-tabular discount is included in
columns 32 and 33 of Schedule P, Part 1.
Adjustment for loss-sensitive business
Prior to summing the reserve risk charge over all lines of business written by the reporting
company, an adjustment is made to reflect loss-sensitive business.
The loss sensitive adjustment provides a discount for business that is written by the insurance
company on contracts for which the premium is determined based on the insured’s loss
experience (i.e., retrospectively rated contracts). The loss experience is shared in whole or in
part with the insured. Therefore, the risk of adverse loss development is also shared with the
insured. The insurer needs less surplus to survive this risk of adverse loss development than it
does if none of the policies were written on a loss sensitive basis, thereby resulting in a
discount to the company’s RBC reserve charge to reflect this reduction in risk. This discount is
computed separately by line of business.
The following provides the application of the loss-sensitive adjustment:
Equation 2: Loss and LAE RBC after discount
= Equation1 — Loss-sensitive discount
= Base Loss and LAE Reserve RBC — Loss-sensitive discount
Where the loss-sensitive discount
= Loss-sensitive discount factor
* Base loss and LAE RBC (from Equation 1).
176
American Academy of Actuaries, An Update to P/C Risk-Based Capital Underwriting Factors: September 2007
Report to the National Association of Insurance Commissioners P/C Risk-Based Capital Working Group, page 5.

FINANCIAL REPORTING THROUGH THE LENS OF A PROPERTY/CASUALTY ACTUARY
Part IV. Statutory Filings to Accompany the Annual Statement
282
The loss-sensitive discount factor is 30% for net loss and expense reserves associated with
direct loss-sensitive contracts and 15% for net loss and expense reserves associated with
assumed loss-sensitive contracts. The difference stems from the potential offset associated
with reinsurance contracts for commissions that are loss sensitive as well. Oftentimes such
business is written with sliding scale commissions whereby the commission the ceding
company receives from the reinsurer is dependent upon the loss ratio on the business; the
lower the loss ratio, the higher the commission paid by the reinsurer to the ceding company,
subject of course to specified limits. For example, the reinsurer may receive additional
premium from the reinsured as losses emerge but in turn have to pay additional commission
due to a reduction in loss ratio. As with direct loss-sensitive contracts, the risk of adverse loss
development on assumed contracts is reduced; however, it is not reduced by as much due to
the potential offset from ceding commissions.
The portion of net loss and expense reserves attributed to direct and assumed loss-sensitive
contracts is found in column 3 of Schedule P, Parts 7A and 7B, respectively.
Adjustment for loss concentration
The loss concentration adjustment is applied to the sum of the RBC reserve charges for all
lines of business and reflects diversification across the lines. The theory underlying this
discount is that the reserves for each line of business written by an insurance company would
not be expected to develop adversely or favorably at the same time, assuming such
development is random.
The final net loss and LAE RBC charge is computed as follows:
Equation 3: Net loss and LAE RBC
= Total loss and LAE RBC after discount for all RBC lines * 1,000
* Loss concentration factor
Where the loss concentration factor
= Net loss and LAE for the largest line * 0.300 + 0.700
Net loss and LAE for all lines combined
The loss concentration factor is determined by taking the percentage of total net loss and LAE
reserves for the largest line of business to the total net loss and LAE for all RBC lines
combined, multiplying this percentage by 0.300 and then adding the result to 0.700.
177
Because all adverse loss development may not always be a random fluctuation in losses, such
as when the company increases loss reserves to improve its earnings position, adverse
177
For clarity, largest line is determined based on the Schedule P line of business having the highest amount of net
loss and LAE reserves as of the filing date. Note, despite being separate lines of business within Schedule P, claims-
made and occurrence business are combined for purposes of this calculation for other liability and product liability.

FINANCIAL REPORTING THROUGH THE LENS OF A PROPERTY/CASUALTY ACTUARY
Part IV. Statutory Filings to Accompany the Annual Statement
283
development across lines may not be totally independent. This formula recognizes that there
may be some interdependence between lines of business.
A monoline writer would not receive any discount, as the calculation would be 1.000 * 0.300
+ 0.700, which produces a loss concentration factor of 1.000. However, a company writing
60% of its business in its largest line would receive a discount to its reserve risk charge of
12%, or a loss concentration factor of 0.880 (= 0.600 * 0.300 + 0.700).
Illustration of reserve RBC calculation
The following provides an illustration of the reserve RBC calculation for REIC. Assume REIC
writes only four lines of business: homeowners/farmowners (HO/FO), private passenger
automobile liability (PPAL), workers’ compensation (WC) and other liability (OL). The source
of the company’s own data is Schedule P, which is provided in thousands of U.S. dollars.

FINANCIAL REPORTING THROUGH THE LENS OF A PROPERTY/CASUALTY ACTUARY
Part IV. Statutory Filings to Accompany the Annual Statement
284
TABLE 88
Reporting Entity Insurance Company (REIC)
Given the following data: HO/FO PPAL WC OL
Total All
Lines Source
(1)
Industry Average Loss & LAE
Development Ratio
0.9
89
1.022
0.9
52
0.9
66
Provided by
NAIC
(2)
Company Average Loss & LAE
Dvpt Ratio for prior 9 years
1.070
1.100
1.125
1.150
Company Schedule
P, Part 2
(3)
Industry Loss & LAE RBC %
0.2
13
0.1
81
0.3
36
0.5
31
Provided by NAIC
(4)
Adjustment for
Investment
Income
0.938
0.928
0.830
0.852
Provided by NAIC
(5)
Company Net Loss & LAE
Unpaid, gross of non-tabular
discount
10,000
8,000
17,000
12,000
47,000
Company Schedule
P, Part 1
(6)
Other Discount Amount Not
Included in Unpaid Loss & LAE
–
–
–
–
–
Company data
(7)
Portion of Reserves
on Retro
-
Rated Plans:
(a) % Direct Loss Sensitive
0.0%
0.0%
20.0%
0.0%
Company Schedule
P, Part 7A, Col 3
(b) % Assumed Loss Sensitive
0.0%
0.0%
0.0%
0.0%
Company Schedule
P, Part 7B, Col 3
Calculation of Reserve RBC HO/FO PPAL WC OL
Total All
Lines
Step 1: Base Loss &
LAE Reserve RBC
(8)
Ratio of Company Average
Development Ratio to Industry
1.
082
1.
076
1.1
82
1.
190
= (2) / (1)
(9)
Company Loss & LAE RBC %
0.2
22
0.
188
0.3
67
0.5
82
= 50% of
(3) + 50%
of (8)*(3)
(10)
Base Loss & LAE Reserve RBC
Charge
1,
460
819
2,282
4,170
={ [ ( (9)+1 ) * (4) ]
- 1 } * { (5) + (6) }
Step 2: Loss & LAE RBC After
Discount
(11)
Loss
-
sensitive Factor
–
–
0.060
–
= 30% of (7a) +
15% of (7b)
(1
2)
Loss
-
sensitive Discount
–
–
1
37
–
= (11) * (10)
(13)
Loss & LAE RBC After
Discount
1,
460
819
2,145
4,170
8,
594
= (10)
-
(12)
Step 3: Net Loss & LAE RBC *
1,000
(14)
Distribution of Loss & LAE
Reserves by Line
21%
17%
36%
26%
= (5) by
line / (5)
total
(15)
Loss Concentration Factor
0.809
= 0.300 * Max of
(14) + 0.700
(16)
Net Loss & LAE RBC * 1,000
6,
948
,
010
= (13) * (15) *
1,000
As displayed in Table 88, the reserve RBC included in the R
4
charge for REIC is $6,948,010.
The main driver of the reserve RBC is the company RBC percentage for loss and LAE reserve
risk. This percentage is higher than the industry RBC percent in line 3 because REIC’s ultimate
estimates tend to develop adversely, as evidenced by the ratios of company development to
industry development in excess of 1.000 in line 8 above.
Table 89 provides another example of the detailed R
4
calculation for the commercial
automobile liability (CAL) line of business for Fictitious Insurance Company. This calculation

FINANCIAL REPORTING THROUGH THE LENS OF A PROPERTY/CASUALTY ACTUARY
Part IV. Statutory Filings to Accompany the Annual Statement
285
uses the financial statements and Schedule P line detail found in other examples within this
publication.
TABLE 89
R
4
Charge for Commercial Automobile Liability (CAL)
Fictitious Insurance Company
NAIC Risk-Based Capital 2018
R
4
—
Reserve Risk
CAL
Industry Average Development
1.060
Company Average Development
0.901
Company Average Development / Industry Average Development
0.
850
Industry Loss & LAE RBC %
0.2
43
Company RBC %
0.2
25
Loss & LAE Unpaid
3
,450,000
Adjustment for Investment Income
0.911
Loss & LAE Reserve RBC Before Discounts
3
99
,
565
Percent Loss
-
sensitive Direct Loss and Expense Reserves
0.011
Loss
-
sensitive Direct Loss and Expense Reserve Discount Factor
0
.300
Loss
-
sensitive Discount for Loss and Expense Reserves
1,
319
Loss and LAE Reserve RBC
3
98
,
247
Excessive premium growth
The estimation of unpaid loss and LAE reserves is subject to greater uncertainty for
companies that are growing rapidly. The reasons are twofold. First, an insurance company
does not have as much insight into new business as it does into risks that are currently on the
books. Second, the estimation of unpaid claims is more difficult for a growing company rather
than a company in a steady state. Consider a company that decides to grow its writings by
20% over the course of a year. As a company grows throughout the year, the average writings
are more heavily skewed toward the second half of the policy year. Without explicit
consideration for this shift, traditional actuarial projection techniques will not adequately
capture the lag in loss emergence and therefore will understate the reserve need. However,
the difficulty is in determining how exactly to consider this shift.
In the RBC calculation, excessive growth is defined as a three-year average growth rate in
gross written premiums that is in excess of 10%. A growth rate of 10% is deemed to be a
normal annual increase in premium volume. The growth rate for any single year is capped at
40%. The excess percentage (excess of 10%) is called the RBC average growth rate factor.
Average growth rate factor
= Maximum (average gross premium growth over three years, 0.10) – 0.10
For purposes of this calculation, gross written premiums are equal to direct written premiums
from line 35 of column 1 of the Underwriting and Investment Exhibit (U&IE), plus assumed
premiums from non-affiliates in column 3. To perform this calculation, Part 1 of the U&IE is

FINANCIAL REPORTING THROUGH THE LENS OF A PROPERTY/CASUALTY ACTUARY
Part IV. Statutory Filings to Accompany the Annual Statement
286
required for each of the past four years. The calculation is performed using as many years as
possible, but no more than four; if the company only has one year of experience, only one
year is used. However, if the company is a start-up, a growth rate of 40% is used. If a
company has no gross written premium in the current year, it is assumed not to be growing,
and a growth rate of zero is used.
This calculation is performed on a group basis, for those companies that are part of a group.
Therefore, each member of the group will have the same RBC average growth rate factor. The
group basis is used to neither punish nor reward individual legal entities that might be
growing due to a realignment of business from one company within the group to another. In
this case, the growth is not attributed to new business but rather a transfer or risks from one
company to the other.
In addition, business acquired or divested as a “shell” is included in the calculation of the
growth rate only to the extent that the liabilities are retained by the reporting entity.
Servicing carriers for assigned risk pools can also exclude the written premiums associated
with the involuntary pool, as the insurer has little or no control over the assignment of such
risk.
The RBC average growth rate factor is multiplied by 0.450 of the net loss and LAE reserves as
per the total line in Schedule P, Part 1, Summary, column 24.
Excessive premium growth charge for loss and LAE reserves =
RBC average growth rate factor * 0.450 * net loss and LAE reserves
The 0.450 has remained unchanged since the original RBC formula for property/casualty
insurers was implemented. It was determined by a member of the American Academy of
Actuaries RBC Task Force (Mr. Allan Kaufman) after studying the average development in net
loss and LAE reserves experienced by companies that experienced growth in excess of 10%,
relative to development observed by the remainder of the industry.
178
The 0.450 is already
adjusted for discount using a factor of 0.900, which was what Kaufman approximated to be
the average discount factor for all lines of business.
179
Reinsurance RBC
Recall from our discussion of the R
3
charge that reinsurance RBC represents the minimum
amount of capital included in the RBC formula that would be needed to survive the risk of
reinsurer default.
178
Feldblum, S., “NAIC Property/Casualty Insurance Company Risk-Based Capital Requirements,” PCAS LXXXIII,
1996, page 354.
179
Ibid.

FINANCIAL REPORTING THROUGH THE LENS OF A PROPERTY/CASUALTY ACTUARY
Part IV. Statutory Filings to Accompany the Annual Statement
287
The reinsurance RBC within R
4
is equal to the other half of the reinsurance recoverable
amount computed in R
3
unless the reserve RBC is less than the RBC for non-invested assets
plus one-half of the RBC for reinsurance recoverables. If this is the case, the entire
reinsurance RBC charge is included in R
3
and the reinsurance RBC within R
4
is zero. The
reserve RBC limitation was put in place so the insurance company cannot diversify away a
portion of its credit risk in situations where the company has limited net reserves.
Health RBC
In addition to the charge for property/casualty lines of business, a separate health RBC
calculation is required for those property/casualty insurers that have written 5% or more in
accident and health premiums in any of the past three years. We will not go into the details of
this formula but note that the health RBC calculation is based on the RBC formula for life
insurance.
R
4
for Fictitious
Table 90 provides the R
4
calculation for Fictitious.

FINANCIAL REPORTING THROUGH THE LENS OF A PROPERTY/CASUALTY ACTUARY
Part IV. Statutory Filings to Accompany the Annual Statement
288
TABLE 90
R
4
Charge for Fictitious Insurance Company
NAIC Risk-Based Capital 2018
Total R
O
Charge
—
Subsidiary Insurance Compa
nies and Misc. Other Amounts
0
Total R
1
Charge
—
Fixed Income Asset Risk
553,398
Total R
2
Charge
—
Equity Asset Risk
4,303,948
Total R
3
Charge
—
Credit
-
Related Asset Risk
310
,
060
R
4
Calculation — Underwriting Risk — Reserves
Amount
Held
Charge
Factor
Initial RBC
Charge
Loss
-
sensitive
Discount
180
Final RBC
Charge
Property/Casualty business
Loss and LAE reserves
—
HO/FO
1,455,000
0.1237
179,984
0
179,984
Loss and LAE reserves
—
PPAL
2,482,000
0.1136
281,955
0
281,955
Loss and LAE reserves
—
CAL
3,450,000
0.11
58
3
99
,
565
1,
319
3
98
,
247
Loss and LAE reserves
—
WC
15,946,000
0.1122
1,789,141
66,019
1,723,122
Loss and LAE reserves
—
CMP
4,782,000
0.3087
1,476,
203
0
1,476,
203
Loss and LAE reserves
—
Med Mal Occur
rence
0
0.0000
0
0
0
Loss and LAE reserves
—
Med Mal CM
0
0.0000
0
0
0
Loss and LAE reserves
—
Spec Liab
0
0.0000
0
0
0
Loss and LAE reserves
—
OL
20,691,000
0.3095
6,40
3
,
865
9,607
6,394,
258
Loss and LAE reserves
—
Spec Prop
1,624,000
0.1740
282,5
76
0
282,5
76
Loss and LAE reserves
—
APD
310,000
0.0873
27,0
63
0
27,0
63
Loss and LAE reserves
—
F&S
817,000
0.2530
206,7
01
0
206,7
01
Loss and LAE reserves
—
Other
0
0.0000
0
0
0
Loss and LAE reserves
—
Products Liability
0
0.0000
0
0
0
Loss and LAE reserve
s
—
All Other
Total
51,557,000
11,0
47
,
053
76,
945
10,9
70
,
109
Company loss concentration factor
0.820
4
Loss reserve RBC after loss concentration
8,9
99
,
842
Current year growth
0.0195
1st prior year growth
-
0.0486
2nd prior year growth
-
0.0550
Selected Average Growth
0.0000
RBC average growth rate
0.0000
Excessive growth charge on loss and LAE reserves
51,557,000
0.0000
0
Half of Reinsurance RBC
273
,
500
Total R
4
Charge
—
Underwriting Risk
—
Reserves
9
,273
,
342
180
We have assumed that the percentage of Fictitious’ net loss and expense reserves that emanates from loss-
sensitive contracts written on a direct basis is: 1.10% for commercial automobile liability, 12.3% for workers’
compensation, 0.5% for other liability, and 0% for all other lines and for loss-sensitive contracts written on an
assumed basis.

FINANCIAL REPORTING THROUGH THE LENS OF A PROPERTY/CASUALTY ACTUARY
Part IV. Statutory Filings to Accompany the Annual Statement
289
THE RBC CHARGE FOR WRITTEN PREMIUM RISK (R
5
)
The R
5
charge considers underwriting risk associated with the following:
1. Net written premium (written premium RBC)
2. Excessive premium growth
3. Health premium (health premium RBC)
4. Health stabilization
For a typical company, almost all of the R
5
charge will come from the written premium RBC
component.
The following provides a brief discussion of each of the first two categories of the R
5
risk
charge. As previously noted in the discussion on R
4
, we will not go into details for health
insurance categories because the charges for health premium RBC and health stabilization
are generally immaterial to the property/casualty industry.
Written premium RBC
Written premium risk contemplates the risk that future business written by the company will
be unprofitable. Ideally, the charge for this risk should be based on business written in the
following year, but since that is an unknown quantity, business written during the current
year is used as a proxy. Similar to the reserve RBC, the written premium RBC is computed by
applying a set of factors, varying by line of business, to the net of reinsurance premiums
written by the company during the current year. The calculation is done on the same lines of
business as the reserve RBC with a different set of factors used in the calculation.
As with the reserve RBC, once the calculation of the base net written premium RBC is
calculated for each line of business, two reductions are made: one for loss-sensitive business
and the other for premium concentration (as opposed to loss concentration in R
4
). Premium
concentration reflects diversification in writing business across different lines of business.
Because the mechanics generally follow those used in the reserve RBC charge, we will only
discuss differences in the calculation for written premium RBC.
Base net written premium RBC by line of business
The base net written premium RBC by line of business is computed as follows:
Equation 4: Base net written premium RBC
= Net written premium for the current calendar year
* [ [Company RBC loss and LAE ratio * Adjustment for investment income] +
Underwriting expense ratio - 1.000 ]

FINANCIAL REPORTING THROUGH THE LENS OF A PROPERTY/CASUALTY ACTUARY
Part IV. Statutory Filings to Accompany the Annual Statement
290
The net written premiums for each line of business are provided in column 6 of Part 1B of the
U&IE within the Annual Statement. Aggregate write-ins for other lines of business are
included within the other liability line of business.
Company RBC loss and LAE ratio
Similar to how the company RBC percentage is the key driver in the reserve RBC calculation,
the company RBC loss and LAE ratio forms the crux of the written premium risk charge. For
each line of business, the company RBC loss and LAE ratio is determined based on a 50%
weighting applied to the straight industry RBC loss and LAE ratio and 50% applied to the
industry RBC loss and LAE ratio adjusted for the company’s own experience. The industry
RBC loss and LAE ratio is given by the NAIC and is the same for all property/casualty
insurance companies.
As with the industry reserve RBC percent, the industry RBC loss and LAE ratios did not
change from their original value until 2008, when the NAIC adopted changes that were
recommended by the American Academy of Actuaries P/C Risk-Based Capital Committee.
181
The original industry RBC loss and LAE ratios were based on the “worst-case” accident year
ratio by line of business that resulted from taking a simple average over all companies.
Company loss and LAE ratios by accident year were taken from what is currently column 31
of Schedule P, Part 1. The revised methodology recommended by the Committee instead uses
the 87.5 percentile of all data points. Consistent with the industry reserve RBC percent
factor, a floor was set such that the indicated industry RBC loss and LAE ratio resulted in a
minimum charge of 5% after adjustment for investment income. In addition, the indicated
industry RBC loss and LAE ratios were capped to limit the change in the base loss and LAE
reserve RBC. The data was also filtered and screened to remove anomalous values (e.g.,
companies having less than an average of $500,000 in earned premium or a loss ratio of 0%
for any one year). Further, loss ratios were capped at 300%.
182
As discussed in the reserve RBC section above, the 2017 RBC formula saw another update to
the industry RBC loss and LAE ratio factors, the first since 2010. This update was based on
changes recommended by the American Academy of Actuaries P/C Risk-Based Capital
Committee in a report titled 2016 update to Property and Casualty Risk-Based Capital
Underwriting Factors.
183
The recommendations from this study are the same for written
premium RBC as those discussed above for reserve RBC. As with the industry RBC reserve
factors, the NAIC adopted the industry RBC loss and LAE ratio factors capped at 10% in the
181
Note, however, changes were made to reflect structural changes to Schedule P over the time period, such as
the separation of medical malpractice into its occurrence and claims-made components.
182
American Academy of Actuaries, An Update to P/C Risk-Based Capital Underwriting Factors: September 2007
Report to the National Association of Insurance Commissioners P/C Risk-Based Capital Working Group, pages 2 and
5.
183
https://www.actuary.org/sites/default/files/files/publications/PC_RBC_UWFactors_10282016.pdf

FINANCIAL REPORTING THROUGH THE LENS OF A PROPERTY/CASUALTY ACTUARY
Part IV. Statutory Filings to Accompany the Annual Statement
291
2017 formula, with further revisions to the 2019 formula to use the factors capped at 35%
for all lines of business other than personal and reinsurance lines which are uncapped.
The reporting entity’s own experience is considered by adjusting the industry loss and LAE
ratios by the ratio of the company average loss and LAE ratio to the industry average loss and
LAE ratio. The company average loss and LAE ratio is a straight average over the past 10
accident years of the net loss and LAE ratios provided in Schedule P, Part 1, column 31. Loss
and LAE ratios for any accident year in excess of 300% are capped at that value in
consideration of anomalous, one-time results.
Note that the reporting entity may not rely on its own experience in determining the company
RBC loss and LAE ratio if:
1. The loss and LAE ratio for any accident year is zero or negative.
2. The net earned premium for any accident year is zero or negative.
3. More than two years’ net earned premiums are less than 20% of the average over all
years for each line (otherwise the company must exclude the one or two specific years
that fail and take a straight average from the remaining years).
Adjustment for investment income
The investment income factors are provided by the NAIC and calculated using the same
assumptions as in the reserve RBC, with the exception that discounted years differ because
written premium is discounted as opposed to reserves.
Underwriting expense ratio
This is the company’s own underwriting expense ratio for the current year capped at 400%,
with a floor of zero. It is equal to the ratio of other underwriting expenses incurred in the
current year per line 4 of the income statement, divided by total net written premium for the
current year from Part 1B, column 6 of the U&IE.
Underwriting expense ratio =
Other underwriting expenses /
Net written premium
Adjustment for loss-sensitive business
Prior to summing the written premium RBC over all lines of business written by the reporting
company, an adjustment is made to reflect loss-sensitive business. The following provides the
application of the loss-sensitive adjustment:
Equation 5: Net written premium RBC after discount
= Equation 4
- Loss-sensitive discount

FINANCIAL REPORTING THROUGH THE LENS OF A PROPERTY/CASUALTY ACTUARY
Part IV. Statutory Filings to Accompany the Annual Statement
292
= Base net written premium RBC
- Loss-sensitive discount.
Similar to the reserve RBC, a 30% discount is applied to the portion of the net written
premium RBC charge that is attributed to direct loss-sensitive contracts, and a 15% discount
is applied to the base net written premium RBC charge for assumed contracts. The portion of
net written premium attributed to direct and assumed loss sensitive contracts is found in
column 6 of Schedule P, Parts 7A and 7B, respectively.
Adjustment for premium concentration
The final written premium RBC charge is computed as follows:
Equation 6: Net written premium RBC charge
= Equation 5
* Premium concentration factor
= Total net written premium RBC after discount
* Premium concentration factor
The premium concentration factor is determined by taking the percentage of total net written
premiums that the largest line of business represents, multiplying this percentage by 0.300
and then adding the result to 0.700. As with the loss concentration factor, a monoline writer
would not receive any discount, as the calculation would be 1.000 * 0.300 + 0.700, which
produces a premium concentration factor of 1.000. However, a company writing 60% of its
business in its largest line would receive a discount to its net written premium RBC charge of
12%, or a premium concentration factor of 0.880 (= 0.600 * 0.300 + 0.700).
Illustration of written premium RBC calculation
Table 91 shows the written premium RBC calculation for REIC used in our illustration of
Reserve RBC. The source of the company’s net written premium data is Part 1B of the U&IE,
which is provided in U.S. dollars.

FINANCIAL REPORTING THROUGH THE LENS OF A PROPERTY/CASUALTY ACTUARY
Part IV. Statutory Filings to Accompany the Annual Statement
293
TABLE 91
Reporting Entity Insurance Company (REIC)
Given the
following
data: HO/FO PPAL WC OL
Total A
ll
Lines Source
(1)
Industry Average Loss &
LAE Ratio
0.
687
0.80
6
0.7
44
0.6
33
Provided by NAIC
(2)
Company Average Loss &
LAE Ratio for past 10
years
0.634
0.724
0.811
0.975
Company Schedule
P, Part 1
(3)
Industry Loss & LAE Ratio
0.9
27
0.969
1.0
44
1.0
27
Provided by NAIC
(4)
Adjustment for
Investment Income
0.954
0.925
0.839
0.816
Provided by NAIC
(5)
Company Current Year
Net Written Premium
8,500,000
7,000,000
6,200,000
5,300,000
27,000,000
Company U/W & Inv
Ex, Part 1B, Col 6
(6)
Company Un
derwriting
Expense Ratio
0.271
0.271
0.271
0.271
Company Inc Stmt
Line 4 divided by
(7)
Portion of WP on Retro
-
Rated Plans:
U/W & Inv Ex, Part
1B, Col 6
(a) % Direct Loss
Sensitive
0.0%
0.0%
13.0%
0.0%
Company Schedule
P, Part 7A, Col 6
(b) % Assumed Loss
Sensitive
0.0%
0.0%
0.0%
0.0%
Company Schedule
P, Part 7B, Col 6
Calculation of Written Premium RBC: HO/FO PPAL WC OL
Total All
Lines
Step 1: Base Written Premium RBC
(8)
Ratio of
Company
Average Loss
& LAE Ratio
to Industry
0.
923
0.
898
1.0
90
1.
540
= (2) / (1)
(9)
Company
Loss & LAE
Ratio
0.8
91
0.92
0
1.0
91
1.
304
= 50% of (3) + 50%
of (8)*(3)
(10)
Base Loss &
LAE WP RBC
Charge
1,030
,
584
85
2
,
112
1,
155
,
406
1,7
77
,
725
= (5) * { [ (9) * (4) ]
+ (6) - 1 }
Step 2: Net Written Premium RBC After Discount
(11)
Loss
-
sensitive
Factor
–
–
0.039
–
= 30% of (7a) + 15%
of (7b)
(12)
Loss
-
sensitive
Discount
–
–
45
,
061
–
= (11) * (10)
(13)
Net
Written
Premium RBC
After
Discount
1,030
,
584
85
2
,
112
1,110,345
1,7
77
,
725
4,
77
0
,
766
= (10)
-
(12)
Step 3: Net Written Premium RBC
(14)
Distribution
of WP by Line
31%
26%
23%
20%
= (5) by line / (5)
total
(15)
Premium
Concentration
Factor
0.794
= 0.300 * Max of
(14) +0.700
(16)
Net Written Premium RBC
3,
790
,
109
= (13)
* (15)
As displayed in Table 91, the written premium RBC that is included in the R
5
charge for REIC
is $3,790,109. The company average loss and LAE ratio for the past 10 years (line 2) is
better than the industry average loss and LAE ratio (line 1) for the personal lines (HO/FO and

FINANCIAL REPORTING THROUGH THE LENS OF A PROPERTY/CASUALTY ACTUARY
Part IV. Statutory Filings to Accompany the Annual Statement
294
PPAL) and worse for the commercial lines (WC and OL). Thus, the company loss and LAE ratio
in line 9 is lower than the industry ratio in line 3 for the personal lines and higher for the
commercial lines. In fact, the ratio is substantially higher for OL given the poor average loss
ratio over the past 10 years, which is causing a higher overall written premium RBC for OL
than the other three lines of business, despite the fact that the premium writings are the
lowest for OL.
Table 92 provides another example of the R
5
calculation for CAL for Fictitious.
TABLE 92
R
5
Charge for Commercial Automobile Liability (CAL)
Fictitious Insurance Company
NAIC Risk-Based Capital 2018
R
5
— Written Premium Risk
Industry Average Loss and Loss
Expense Ratio
0.
724
Company Average Loss and Loss Expense Ratio
0.618
Company
Average Loss Ratio/Industry Loss Ratio
0.
854
Industry Loss & LAE Ratio
1.005
Company RBC Loss & LAE Ratio
0.9
31
Company Underwriting Expense Ratio
0.317
Net Written Premiu
m
2,250,000
Adjustment for Investment Income
0.890
Net Written Premium RBC Before Discounts
3
28
,
438
Percent Loss
-
sensitive Direct NPW
0.008
Loss
-
sensitive Direct NPW Discount Factor
0.300
Loss
-
sensitive Discount for Direc
t NPW
788
Total NPW RBC
3
27
,
649
Excessive premium growth
The RBC average growth rate factor is calculated the same as that for reserve risk. However,
the factor differs in its application. In the case of R
5
, the excessive premium growth charge is
applied to net written premium rather than reserves and multiplied by 0.225, rather than
0.450. The net written premium is obtained from the total line in Part 1B, column 6, of the
U&IE. The factor of 0.225 was determined by Kaufman based on a study of the loss ratio for
companies experiencing growth in excess of 10% versus all companies in the industry. As with
the 0.450 factor, the factor applied to net written premium of 0.225 has been adjusted for
discounting by 0.900.
R
5
for Fictitious
Table 93 provides the R
5
portion of the calculation for Fictitious.

FINANCIAL REPORTING THROUGH THE LENS OF A PROPERTY/CASUALTY ACTUARY
Part IV. Statutory Filings to Accompany the Annual Statement
295
TABLE 93
R
5
Charge for Fictitious Insurance Company
NAIC Risk-Based Capital 2018
Fictitious Insurance Company
Total R
O
Charge
—
Subsidiary Insurance Companies and Misc. Oth
er Amounts
0
_
Total R
1
Charge
—
Fixed Income Asset Risk
553,398
Total R
2
Charge
—
Equity Asset Risk
4,303,948
Total R
3
Charge
—
Credit
-
Related Asset Risk
310
,
060
Total R
4
Charge
—
Underwriting Risk
--
Reserves
9,
273
,
342
R
5
Calculation — Underwriting Risk — Net Written Premium
Amount
Written
Charge
Factor
Initial RBC
Charge
Loss
-
sensitive
Discount
184
Final RBC
Charge
Property/Casualty business
Net Written Premium
—
HO / FO
4,555,000
0.1441
656,
376
0
656,
376
Net
Written Premium
—
PP
AL
2,804,000
0.2115
59
3,046
0
59
3
,
046
Net Written Premium
—
CAL
2,250,000
0.1
460
3
28
,
438
788
327
,
649
Net Written Premium
—
WC
4,022,000
0.2030
816,
466
13,471
802,9
95
Net Written Premium
—
CMP
4,677,000
0.1709
799,2
99
0
799,2
99
Net Written Premium
—
Med
Mal Occurrence
0
0.0000
0
0
0
Net Written Premium
—
Med Mal CM
0
0.0000
0
0
0
Net Written Premium
—
Spec Liab
0
0.0000
0
0
0
Net Written Premium
—
OL
3,502,000
0.1999
700,0
50
630
699,4
20
Net Written Premium
—
Spec Prop
2,484,000
0.1805
448,
362
0
448,
3
62
Net Written Premium
—
APD
2,312,000
0.1715
396,
508
0
396,
508
Net Written Premium
—
F&S
146,000
0.1830
26,7
18
0
26,7
18
Net Written Premium
—
Other
0
0.0000
0
0
0
Net Written Premium
—
Products Liability
0
0.0000
0
0
0
Net Written Premium
—
All Other
0
0.0000
0
0
0
Total
26,752,000
4,7
65
,
262
14,
889
4,7
50
,
373
Company premium concentration factor
0.752
4
Written Premium RBC after premium concentration
3,5
74
,
411
Excessive growth
charge on net written premium
26,752,000
0.
0000
0
Total R
5
Charge — Underwriting Risk — Net Written Premium 3,574,411
THE RBC CHARGE FOR CATASTROPHE RISK (R
cat
)
The R
cat
risk charge considers catastrophe risk associated with earthquakes and hurricanes.
This risk applies on a net of reinsurance basis with a corresponding contingent credit risk
charge for certain categories of reinsurers.
The insurance company may use the modeled losses from any one of the NAIC-approved
commercially available third party vendor catastrophe models, or any combination of losses
184
We have assumed that the percentage of Fictitious’ net written premium that emanates from loss-sensitive
contracts written on a direct basis is: 0.8% for commercial automobile liability, 5.5% for workers’ compensation,
0.3% for other liability, and 0% for all other lines and for loss-sensitive contracts written on an assumed basis.

FINANCIAL REPORTING THROUGH THE LENS OF A PROPERTY/CASUALTY ACTUARY
Part IV. Statutory Filings to Accompany the Annual Statement
296
from two or more of the models, using the insurer’s own insured property exposure
information as inputs to the model. For the 2018 RBC formula, approved vendor models are
available from AIR, EQECAT, RMS, ARA HurLoss Model (hurricane only) and the Florida Public
Model (hurricane only). For the 2019 RBC formula, companies will also be able to use their
own internally developed catastrophe model or those that are the result of adjustments made
by the insurer to vendor models to represent their own view of catastrophe risk, upon
applying for and obtaining written permission by their domestic (where model output is used
for a single entity) or lead state (where model output is used for the whole group) insurance
regulator.
The company must provide modeled loss scenarios for the worst year in 50, 100, 250 and
500; however, only the worst year in 100 will be used in calculating the catastrophe risk
charge. Insurers are expected to use the same exposure data, modeling, and assumptions
that they use in their own internal catastrophe risk management process, rather than a
prescribed set of modeling assumptions. While it is preferred that the projected modeled
losses are reported on an Aggregate Exceedance Probability (AEP) basis, companies are
permitted to report on an Occurrence Exceedance Probability (OEP) basis if that is consistent
with the company’s internal risk management process.
For both earthquakes and hurricanes, a risk charge factor of 1.000 is applied to the net of
reinsurance losses (excluding any loss adjustment expenses) at the worst year in 100 level.
Additionally, a factor of 0.048 is applied to the modeled losses ceded under any reinsurance
contract associated with this level of net loss to capture the contingent credit risk associated
with the potential default of reinsurers in this scenario. Recoveries from certain categories of
reinsurers are exempt from this charge, namely U.S. affiliates and mandatory pools (whether
authorized, unauthorized or certified).
The total R
cat
catastrophe risk charge is calculated using the “sum of squares” approach,
which assumes the two risks are independent, using the following formula:
=
(ℎ)
+ ( ℎ)
Exemption Interrogatory
Insurers may qualify for an exemption from filing either or both of the components of the
catastrophe risk charge if they meet certain criteria, upon completion of an interrogatory.
For both earthquake and hurricane exemptions, the company must indicate under which
criteria below it is claiming an exemption:
1. The company has not entered into a reinsurance agreement covering earthquake /
hurricane exposure with a non-affiliate or a non-U.S. affiliate, and either

FINANCIAL REPORTING THROUGH THE LENS OF A PROPERTY/CASUALTY ACTUARY
Part IV. Statutory Filings to Accompany the Annual Statement
297
a. The company participates in an inter-company pooling arrangement with 0%
participation, leaving no net exposure for earthquake / hurricane risks; or
b. The company cedes 100% of its earthquake / hurricane exposures to its U.S.
affiliate(s), leaving no net exposure for earthquake / hurricane risks
2. The company’s ratio of Insured Value – Property to surplus as regards policyholders
is less than 50%
3. The company has written Insured Value – Property that includes earthquake /
hurricane coverage in the Catastrophe-Prone Areas representing less than 10% of its
surplus as regards policyholders
The NAIC RBC Instructions include the following definitions related to the catastrophe risk
exemptions
185
:
Insured
-
Value Property
Includes aggregate policy limits for structures and contents for policies
written and assumed in the following annual statements lines – Fire,
Allied Lines, Earthquake, Farmowners, Homeowners, and Commercial
Multi-Peril.
Catastrophe
-
Prone Areas
in the U.S.:
-
Earthquake risks
Includes any of the following states or commonwealths: A
laska, Hawaii,
Washington, Oregon, California, Idaho, Nevada, Utah, Arizona, Montana,
Wyoming, Colorado, New Mexico, Puerto Rico, and geographic areas in
the following states that are in the New Madrid Seismic Zone – Missouri,
Arkansas, Mississippi, Tennessee, Illinois, and Kentucky.
-
Hurricane risks
Includes Hawaii, District of Columbia, and states and commonwealths
bordering on the Atlantic Ocean, and/or Gulf of Mexico including Puerto
Rico.
For the earthquake exemption, if a company qualifies for exemption under criteria 3, the
company must provide details about how the “geographic areas in the New Madrid Seismic
Zone” were determined, with the following additional questions:
a. What resource was used to define the New Madrid Seismic Zone?
b. Was exposure determined based on zip codes or countries in the zone, was it
based on all of the earthquake exposure in the identified states, or was
another methodology used? Describe any other methodology used.
185
NAIC, RBC Property & Casualty 2018 Forecasting & Instructions, page 43.

FINANCIAL REPORTING THROUGH THE LENS OF A PROPERTY/CASUALTY ACTUARY
Part IV. Statutory Filings to Accompany the Annual Statement
298
R
cat
for Fictitious
Table 94 provides the R
cat
– Earthquake Catastrophe Risk portion of the calculation for
Fictitious.
TABLE 94
R
cat
Earthquake Charge for Fictitious Insurance Company
NAIC Risk
-
Based Capital 2018
R
cat
-
Earthquake Catastrophe Risk
Modeled Losses (USD in 000s)
Ceded Amounts
Recoverable with
Ceded Amounts
zero
Credit Risk
Earthquake
Direct & Assumed
Net
Recoverable
Charge
Worst Year in 50
70,000
50,000
20,000
-
Worst Year in 100
105,000
75
,000
30,000
-
Worst Year in 250
120,000
80,000
40,000
-
Worst Year in 500
135,000
80,000
55,000
-
Has the compan
y
reported above, its modeled earthquake losses using an
O
ccurrence
Exceedance Probability (OEP) basis?
Yes
Amount
Factor
RBC Requirement
Net Earthquake Risk
75,000
1.000
75,00
0
Contingent Credit Risk for Earthquake Risk
30,00
0
0.048
1,44
0
Total Earthquake Catastrophe Risk (AEP basis)
0
1.000
0
Total Earthquake
Catastrophe Risk (OEP basis)
76,44
0
1.000
76,44
0
Total Earthquake Catastrophe Risk
76,44
0
Table 95 provides the R
cat
– Hurricane Catastrophe Risk portion of the calculation for
Fictitious.

FINANCIAL REPORTING THROUGH THE LENS OF A PROPERTY/CASUALTY ACTUARY
Part IV. Statutory Filings to Accompany the Annual Statement
299
TABLE 95
R
cat
Hurricane Charge for Fictitious
Insurance Company
NAIC Risk
-
Based Capital 2018
R
cat
- Hurricane Catastrophe Risk
Modeled Losses (USD in 000s)
Ceded Amounts
Recoverable with
Ceded Amounts
zero
Credit Risk
Hurricane
Direct & Assu
med
Net
Recoverable
Charge
Worst Year in 50
105
,000
90,000
15,000
-
Worst Year in 100
1
25
,000
105,000
20,000
-
Worst Year in 250
1
6
0,000
115,000
45,000
-
Worst Year in 500
210
,000
135,000
75,000
-
Has the compan
y
reported above, its modeled Hurricane losses using an occurrence
exceedance probability (OEP) basis?
Yes
Amount Factor RBC Requirement
Net Hurricane Risk
105,00
0
1.000
105,00
0
Contingent Credit Risk for Hurricane Risk
20,00
0
0.048
960
Total Hurricane Catastrophe Risk (AEP basis)
0
1.000
0
Total Hurricane Catastrophe Risk (OEP basis)
105,96
0
1.000
105,96
0
Total Hurricane Catastrophe Risk
105,96
0
Table 96 illustrates the calculation of the total R
cat
risk charge for Fictitious.
TABLE 96
R
cat
Charge for Fictitious Insurance Company
NAIC Risk
-
Based Capital 2018
Fictitious Insurance Company
Total R
O
Charge
—
Subsidiary Insurance Companies and Misc.
Other Amounts
-
Total R
1
Charge
—
Fixed Income Asset Risk
553,398
Total R
2
Charge
—
Equity Asset Risk
4,303,948
Total R
3
Charge
—
Credit
-
Related Asset Risk
310
,
060
Total R
4
Charge
—
Underwriting Risk
--
Reserves
9,
273
,
342
Total R
5
Charge
—
Underwriting Risk
--
Net Written Premium
3,5
74
,
411
R
cat
Calculation
–
Catastrophe Risk
Total Ear
thquake Catastrophe Risk
76,44
0
Total Hurricane Catastrophe Risk
105,96
0
Total R
cat
Charge
–
Catastrophe Risk
130,654
THE RBC CHARGE FOR BASIC OPERATIONAL RISK
The basic operational risk charge considers the risk of financial loss resulting from operational
events that have not already been reflected in existing risk charges. This includes the
inadequacy or failure of internal systems, personnel, procedures, or controls, and external
events. Additionally, this accounts for legal risk, excluding reputational risk from strategic
decisions.

FINANCIAL REPORTING THROUGH THE LENS OF A PROPERTY/CASUALTY ACTUARY
Part IV. Statutory Filings to Accompany the Annual Statement
300
The operational risk charge uses a percentage or “add-on” charge of 3.00%, applied to the
Total RBC After Covariance Before Basic Operational Risk. The operational risk charge is
further reduced by the sum of offset amounts reported by directly owned life insurance
company subsidiaries that prepare and file the Life RBC calculation, adjusted for the
percentage of ownership in the directly owned life insurance company subsidiaries (but not to
produce a charge that is less than zero).
Table 97 illustrates the final calculation of NAIC RBC, including basic operational risk, for
Fictitious.
TABLE 97
NAIC Risk-Based Capital 2018
Fictitious Insurance Company
Total R
0
Charge — Subsidiary Insurance Companies and Misc. Other Amounts 0
Total R
1
Charge
—
Asset Risk
-
Fixed Income
553,398
Total R
2
Charge
—
Asset Risk
-
Equity
4,303,948
Total R
3
Charge
—
Asset Risk
-
Credit
310,060
Total R
4
Charge
—
Underwriting Risk
-
-
Reserves
9,5
61
,
305
Total R
5
Ch
arge
—
Underwriting Risk
-
-
Net Written Premiums
3,574,411
Total R
cat
Charge
–
Catastrophe Risk
1
30
,
654
Total
RBC
A
fter
C
ovariance
Before Basic Operational Risk
1
0
,
849
,
641
Basic Operational Risk
325,489
Total RBC After Covariance including Basic Operati
onal Risk
11,175,131
RBC MODEL ACT
Each state’s statutes define a minimum amount of capital that a company must have to obtain
a license in that state. These amounts vary by state and by lines of business but are usually
relatively low, from $1 million to $5 million. These minimum capital amounts do not account
for the characteristics and risk level of individual insurance companies.
The purpose of RBC is to help regulators identify insurers that are in financial trouble and that
need regulatory attention. Therefore, the RBC requirements attempt to individualize the
minimum capital requirement for each insurer. RBC is not a target-level of capital that
insurers should hold; rather, it computes a minimum level of capital adequacy that a company
must have to operate.
The RBC requirement is a dollar amount calculated from the NAIC RBC formula. The RBC that
results from the formula (Total RBC After Covariance including Basic Operational Risk) is
compared to a company’s Total Adjusted Capital. Total Adjusted Capital is equal to the
company’s policyholders’ surplus from page 3 of the Annual Statement that is reduced by:

FINANCIAL REPORTING THROUGH THE LENS OF A PROPERTY/CASUALTY ACTUARY
Part IV. Statutory Filings to Accompany the Annual Statement
301
1. The amount of non-tabular discount from Schedule P, Part 1, Summary, columns 32
and 33.
2. Tabular discount on medical reserves included in Schedule P, Part 1, Summary,
column 24.
Additionally, a property/casualty insurer that owns a life insurance company subsidiary
adjusts its surplus for the same amounts as the life subsidiary does for RBC purposes, namely
by adding back the asset valuation reserve and 50% of the dividend liability to surplus. All
such affiliate amounts are adjusted by the company’s percentage of ownership.
The “RBC ratio” is the name used in the insurance industry to describe the ratio of Total
Adjusted Capital to Authorized Control Level (ACL). While discretionary, ACL is the point at
which the insurance commissioner is authorized to take control over the company under the
RBC Model Act. ACL is equal to 50% of the Total RBC After Covariance including Basic
Operational Risk.
RBC ratio
= Total Adjusted Capital / ACL
= Total Adjusted Capital / (Total RBC After Covariance including Basic
Operational Risk * 0.500)
Regulatory action is permitted when total adjusted capital is within 50 percentage points of
the ACL (i.e., when the RBC ratio is 150% or less). This is called the regulatory action level.
Table 98 summarizes the level of regulatory control relative to the percentage of total
adjusted capital to both the RBC and ACL benchmarks:

FINANCIAL REPORTING THROUGH THE LENS OF A PROPERTY/CASUALTY ACTUARY
Part IV. Statutory Filings to Accompany the Annual Statement
302
TABLE 98
Action Required if Inside Range
Action Level
Total
Adjusted capital
as a
% of ACL Benchmark
By State Insurance
Department By Company
1. Company
Action
Level
150% to 200% None initially Must submit a plan of action
within 45 days to the insurance
commissioner of the domiciliary
state explaining how the
Company intends to obtain the
needed capital or to reduce its
operations or risks to meet the
RBC standards.
2. Regulatory
Action
Level
100% to 150% Commissioner has the right to
issue an order specifying
corrective actions (Corrective
Order) to be taken by the
insurance company, such as
by restricting new business.
However, all action by the
state insurance department is
discretionary; nothing is
mandated.
Must submit a plan of action
within 45 days to the insurance
commissioner of the domiciliary
state explaining how the
Company intends to obtain the
needed capital or to reduce its
operations or risks to meet the
RBC standards.
3. Authorized
Control
Level
70% to 100% Regulatory action still
discretionary, but the
insurance commissioner is
authorized to take control of
the company.
None initially
4. Mandatory
Control
Level
Below 70%
Insurance commissioner of
the domiciliary state must
rehabilitate or liquidate the
company.
None initially
As noted earlier, the detailed calculations of a company’s risk charges are not available to the
public. However, two metrics of RBC are disclosed in the Five-Year Historical Data exhibit of
the Annual Statement: Total Adjusted Capital and the ACL. A company’s RBC ratio can be
calculated by dividing the Total Adjusted Capital by the ACL from the company’s Five-Year
Historical Data. Table 99 provides the RBC ratios for Fictitious from its 2018 Five-Year
Historical Data exhibit.

FINANCIAL REPORTING THROUGH THE LENS OF A PROPERTY/CASUALTY ACTUARY
Part IV. Statutory Filings to Accompany the Annual Statement
303
TABLE 99
Data from Fictitious Insurance Company 2018 Five-Year Historical Data (USD)
RBC Analysis 2018 2017 2016 2015 2014
28.
Total adjusted capital
31,024,000
31,608,000
35,793,000
32,572,000
34,567,000
29.
Authorized control level risk
-
based
capital
5,
588
,000
6,097,300
5,854,000
5,685,000
6,517,000
Total
adjusted capital as a percent of
ACL (= line 28 / line 29)
5
55
%
518%
611%
573%
530%
As displayed in Table 99, the company’s RBC ratios have been well over 300 points above the
Company Action Level, the first action level within the RBC framework, which ranges from
150% to 200% of ACL. Note how the 2018 ACL amount of $5,588,000 is 50% of the Total
RBC After Covariance including Basic Operational Risk shown in Table 97.
186
As shown in the Actuarial Opinion Summary in the Appendix of this publication, Fictitious
Insurance Company’s range of reasonable reserve estimates is $43 million to $57 million with
an actuarial central estimate of $50 million and carried reserves of $51.557 million. If the
high end of the range was to materialize, total adjusted capital would decrease by $5.443
million ($57 million - $51.557 million). At $25.581 million, the total adjusted capital would
still be well above the company action level of $11.450 million (by $14.131 million). Some
Appointed Actuaries look to the impact on capital resulting from a movement in reserves
relative to the high end of the actuarial range for purposes of selecting a materiality standard
(see Chapter 16. Statement of Actuarial Opinion) in their Statement of Actuarial Opinion.
According to the NAIC 2018 RBC instructions, 98.5% of property/casualty insurance
companies usually fall within RBC levels that require no regulatory action (i.e., having Total
Adjusted Capital in excess of 200% of ACL).
187
However, just because a company’s RBC
results do not require regulatory attention, it does not necessarily mean that the company is
strong financially. RBC is intended to be one of a number of tools used by regulators to
evaluate financial solvency and therefore should not be used in isolation.
TREND TEST
Companies with RBC ratios exceeding 200% are not necessarily free from regulatory
attention. Companies with an RBC ratio of between 200% and 300% are subject to the trend
test. The trend test serves as an early warning to state insurance regulators of companies
that may be on a path to reporting an RBC ratio below 200%, thereby triggering the company
action level. The trend test looks to see whether companies with an RBC ratio of between
200% and 300% also have a current year combined ratio that exceeds 120%. Companies
186
Note that the Authorized Control Level RBC of $5,587,565 is rounded to $5,588,000 in Table 12 and Table 99 for
simplicity.
187
NAIC, RBC Property & Casualty 2018 Forecasting & Instructions, page 48.

FINANCIAL REPORTING THROUGH THE LENS OF A PROPERTY/CASUALTY ACTUARY
Part IV. Statutory Filings to Accompany the Annual Statement
304
meeting the trend test criteria are required to comply with the company action level
requirements despite having an RBC ratio in excess of 200%.
The combined ratio is calculated as the sum of:
(1) Loss and LAE ratio
(2) Dividend ratio
(3) Expense ratio
The loss and LAE ratio is calculated as calendar year net incurred loss and LAE divided by net
earned premium from the Statement of Income. The dividend ratio is equal to policyholders’
dividends divided by net earned premium from the Statement of Income. The expense ratio is
equal to other underwriting expenses incurred plus aggregate write-ins for underwriting
deductions from the Statement of Income divided by net written premiums from the
Underwriting & Investment Exhibit.
THE FUTURE OF RBC
Since its inception, the RBC model has continued to evolve and this chapter has captured the
details of the calculation at a point in time. In particular, over the past decade the RBC
formula has had substantial development as a consequence of the comprehensive review of
the solvency framework in the U.S. performed as part of the NAIC’s Solvency Modernization
Initiative. Such changes included the addition of new catastrophe risk and operational risk
charges as well as enhancements made to various existing risk categories, such as
investments in affiliates and reinsurance credit risk.
In the future the principles behind the RBC calculation are unlikely to change substantially,
although we are likely to see continued enhancements to the calculation to reflect evolving
practices in the measurement and management of risk.
One initiative currently undertaken by the NAIC is the development of a Group Capital
Calculation that will provide regulators with another regulatory tool to understand the level of
risk across an entire insurance group, i.e., aggregating across all of its operations, to
complement the RBC requirements that are applicable at the legal entity level.
The RBC calculation is likely to also remain a key component of an insurance company’s
annual Own Risk and Solvency Assessment (“ORSA”). First introduced in 2015, the ORSA is
an internal process undertaken by an insurer to assess the adequacy of its risk management
and current and prospective solvency positions under normal and severe stress scenarios.

FINANCIAL REPORTING THROUGH THE LENS OF A PROPERTY/CASUALTY ACTUARY
Part IV. Statutory Filings to Accompany the Annual Statement
305
CHAPTER 20. IRIS RATIOS
OVERVIEW
National Association of Insurance Commissioners (NAIC) Insurance Regulatory Information
System (IRIS) has been used since 1972 to help insurance regulators evaluate the financial
condition of insurance companies. More than 5,000 companies file their financial statements
with the NAIC each year.
188
IRIS is applied to property/casualty, life/accident and health, and
fraternal insurance organizations.
IRIS is known by practicing property/casualty actuaries as being a series of 13 tests of
financial ratios relative to benchmarks (i.e., ranges of “unusual values”). These are called IRIS
ratios. However, the IRIS ratios are only one component of IRIS. IRIS includes other tools and
databases of financial information that are used by state insurance regulators to monitor the
financial health of insurance companies.
The instructions for computing IRIS ratios are currently included as part of the CAS Exam 6
U.S. Syllabus of Basic Education. As a result, we will not go into details of the calculations
here but rather will provide a brief overview of the IRIS ratios. In Appendix I of this
publication, we walk through the calculation and purpose of each of the 13 IRIS ratios,
provide possible explanations for unusual values, and show the results of the IRIS ratio
calculations for Fictitious Insurance Company using data from the 2018 Annual Statement.
IRIS RATIOS
The IRIS ratios are grouped into four categories:
• Overall ratios
• Profitability ratios
• Liquidity ratios
• Reserve ratios
Many of the ratios are computed in terms of policyholder surplus, with the intent of providing
an early warning of companies in financial distress. The results of each of these ratios are not
reviewed in isolation. When reviewing the results of ratios and investigating unusual values,
mitigating or augmenting circumstances brought to light through other ratios and information
are considered.
188
Per the description of the publication Ratio Results for the IRIS on the NAIC and The Center for Insurance Policy
and Research, NAIC Store, Financial Regulation Publication on IRIS,
http://www.naic.org/store_pub_fin_receivership.htm#iris_results.

FINANCIAL REPORTING THROUGH THE LENS OF A PROPERTY/CASUALTY ACTUARY
Part IV. Statutory Filings to Accompany the Annual Statement
306
The reserve ratios are probably the most important ratios to the property/casualty actuary
and where the actuary places most attention, as these ratios are specifically commented on
by the appointed actuary in the Statement of Actuarial Opinion (SAO).
There are three reserve ratios:
IRIS ratio 11: One-year reserve development to policyholders’ surplus
IRIS ratio 12: Two-year reserve development to policyholders’ surplus
IRIS ratio 13: Estimated current reserve deficiency to policyholders’ surplus
These three ratios focus on the development of an insurance company’s net loss and LAE
reserves for purposes of understanding reserve adequacy. IRIS ratio 11 is the same one-year
development test as provided in the Five-Year Historical Data exhibit within the Annual
Statement. It measures development in the company’s net loss and LAE reserves over the
past year, whether adverse or favorable, relative to prior year surplus. Essentially, this test
looks to see how much surplus would have been absorbed or enhanced in the prior year as a
result of adverse or favorable development in the corresponding net loss and LAE reserves.
Adverse development is shown as an increase to reserves and therefore a positive number.
Results of IRIS ratio 11 equal to or greater than 20% are considered unusual.
IRIS ratio 12 is the same two-year development test as provided in the Five-Year Historical
Data exhibit within the Annual Statement. It measures development in the company’s net loss
and LAE reserves over the past two years, relative to surplus at the end of the second prior
year. Like ratio 11, results of IRIS ratio 12 equal to or greater than 20% are considered
unusual.
IRIS ratio 13 is a hindsight test. It looks at a company's net outstanding loss and LAE reserves
at the immediate prior two years relative to calendar year earned premium for those years
and adds to the reserves development that has emerged over that period (one-year
development for the immediate prior year; two-year development for the year prior to that).
The test then applies the average of the resulting two “adjusted” loss ratios to earned
premium for the recent year to determine what the outstanding loss reserve should be. A
calculated deficiency in recorded loss and LAE reserves of 25% or more is deemed to be
unusual.
The purpose of this test is to identify companies that may not have gotten their reserves
“right” in the past. The expectation inherent in this test is if companies have had adverse
development in the past, they will probably have adverse development in the future.
Regulators want to see if companies who have had such adverse development have corrected
for it in their current estimates.

FINANCIAL REPORTING THROUGH THE LENS OF A PROPERTY/CASUALTY ACTUARY
Part IV. Statutory Filings to Accompany the Annual Statement
307
INTERPRETING THE RESULTS OF THE SYSTEM
The IRIS results are used to prioritize insurers requiring further analysis through examination
by the state insurance regulatory system. An unusual value does not necessarily mean that
the insurer is financially impaired. The NAIC IRIS Ratios Manual states, “No state can rely on
the tools’ results as the state’s only form of surveillance.”
189
189
Ibid., page 2.

FINANCIAL REPORTING THROUGH THE LENS OF A PROPERTY/CASUALTY ACTUARY
Part VIII. The Future of SAP
308
PART V. FINANCIAL HEALTH OF PROPERTY/CASUALTY INSURANCE
COMPANIES IN THE U.S.
INTRODUCTION TO PART V
In Part IV. Statutory Filings to Accompany the Annual Statement we presented details
underlying several filings either included within or supplemental to the statutory Annual
Statement. These and other tools, including on-site financial examinations and Financial
Analysis Solvency Tools (FAST, of which the IRIS System is a part), provide a means for the
regulator to monitor the financial health of an insurance company. Many of these tools are
confidential. However, certain results can be derived from publicly available information, such
as the result of RBC, which is included within the Five-Year Historical Data exhibit in the
Annual Statement.
The monitoring performed by regulators is risk-focused and intended to identify financially
troubled companies well before they are impaired. Regulators use the tools collectively to
evaluate financial health and prioritize those insurers requiring additional scrutiny and
analysis.
While policyholders and investors place heavy reliance on state insurance regulators in
monitoring the health of property/casualty insurance companies, they themselves have
access to the publicly available tools, such as quarterly and Annual Statement filings, the
Statement of Actuarial Opinion, and Securities and Exchange Commission filings (for publicly
traded companies). Also, to assess financial health, they rely on ratings and analyses
performed by credit rating agencies, such as A.M. Best, Moody’s, Standard & Poor’s and Fitch.
Each of these rating agencies uses internally developed capital adequacy models to perform
qualitative and quantitative financial strength assessments and establish a company’s rating.
In this section we provide a summary of the tools used by regulators and stakeholders in
monitoring an insurance company’s financial health and briefly explain how these tools are
used in practice.

FINANCIAL REPORTING THROUGH THE LENS OF A PROPERTY/CASUALTY ACTUARY
Part VIII. The Future of SAP
309
CHAPTER 21. MEASUREMENT TOOLS
Before we discuss what the tools mentioned in the introduction do, it is important to disclose
what they don’t do.
First, each measurement tool provides one piece of evidence and should not be taken as the
only evidence of a healthy or troubled insurance company. For example, an insurance
company may have “usual” values for each of its Insurance Regulatory Information System
(IRIS) ratios, but something about the company’s exposures or a pending regulatory decision
may result in a risk of material adverse deviation in the company’s reserves, and such risk
could be material to the company surplus. The risk of material adverse deviation would be
discussed in the Statement of Actuarial Opinion (SAO) by the appointed actuary, and in
reading that disclosure, the regulator would determine the necessary steps for further
investigation. In this example, neither the results of the IRIS ratios nor the SAO should be
considered alone; other information should be incorporated into an evaluation of an insurance
company’s health.
Second, these tools don’t supplant the audit of an insurance company. In fact, the audited
financial statements are themselves a tool used by the stakeholders and regulators of an
insurance company. Further, these tools will not ensure that the data used as input into the
tools is accurate and complete, nor will they provide any insight as to whether the company’s
management has good internal management, systems and controls in place. However,
weaknesses in company management, systems and/or controls eventually leach into the
output from the tools.
Finally, these tools will not identify fraud, which can be difficult to uncover.
WAYS IN WHICH THESE TOOLS ARE USED TO MEASURE FINANCIAL HEALTH
When viewed together, these tools can provide valuable insight into the financial health of a
property/casualty insurance company. The information gathered from one tool may not in
itself be an indicator but may prompt additional investigation, either through the evaluation
of other tools or inquiry of company management.
Further, the results from a single year may not immediately suggest financial impairment;
however, a review of these results over several years may identify a trend in that direction.
When reviewed together and across multiple years, these tools can be used to provide an
early warning of companies that are of higher risk for financial impairment.

FINANCIAL REPORTING THROUGH THE LENS OF A PROPERTY/CASUALTY ACTUARY
Part VIII. The Future of SAP
310
Annual and quarterly financial statements and schedules
Insurance companies are required to file financial statements every quarter. To summarize
what we learned in preceding chapters, substantial detail is contained in the annual filing (i.e.,
as of December 31), including qualitative information in the form of detailed notes to financial
statements and interrogatories. These statements are filed under Statutory Accounting
Principles. As discussed, statutory accounting focuses on protecting the policyholder and
therefore is known as maintaining more of a conservative stance relative to Generally
Accepted Accounting Principles. Assets and liabilities tend to be measured on a basis that
includes some cushion in the event of financial impairment.
There are two perspectives of financial health measured by the statutory financial statement:
balance sheet strength and earnings potential. In terms of balance sheet strength, regulators
are concerned with an insurance company’s claim-paying ability and therefore focus on areas
that could impair solvency. Two such areas are loss and loss adjustment expense (LAE)
reserve and unearned premium reserve adequacy. Loss and LAE reserves make up the largest
item on the liability side of an insurance company’s balance sheet, representing one-third of
total Liabilities, Surplus and Other Funds at year-end 2018 for the U.S. property/casualty
insurance industry. Coupled with unearned premium reserves, these liabilities represent
nearly half of the total 2018 Liabilities, Surplus and Other Funds for all U.S.
property/casualty insurers in aggregate.
The Five-Year Historical Data exhibit provides a historical view of how an insurance
company’s losses have developed over time. Additionally, the Notes to Financial Statements
provide management discussion of changes in incurred loss and LAE. Data from Schedule P,
Parts 2 through 4 can also be used to perform independent tests of a company’s reserve
adequacy.
Because loss reserves are stated on a net of reinsurance basis on the balance sheet,
reinsurance collectability is also an area of risk relative to the statutory financial statements.
The provision for reinsurance is established on the liability side of the balance sheet to offset
some of this risk by excluding a portion of reinsurance recoverables from unauthorized and
overdue authorized reinsurers. Despite the establishment of the provision for reinsurance,
reserve credit risk still exists. The Notes to Financial Statements are a means to identify
reinsurance that is unsecured, uncollectible or in dispute. And Schedule F, Part 3 can be used
to identify the company’s reinsurers so that additional review of the reinsurers’ financial
strength can be performed. For example, the credit rating of each reinsurer can be
determined from recognized rating agencies, such as those mentioned later in this chapter.
Accident-year loss and LAE ratios from Schedule P, Part 1 provide insight into the adequacy
of claim reserves and unearned premium reserves. For example, property/casualty actuaries
look at current accident year incurred loss and LAE ratios by line of business relative to prior
year ratios adjusted for rate change and trend. Deviations from anticipated trends are

FINANCIAL REPORTING THROUGH THE LENS OF A PROPERTY/CASUALTY ACTUARY
Part VIII. The Future of SAP
311
typically investigated to assess adequacy of loss and LAE ratios on the current accident years.
To illustrate, for a line of business experiencing loss trend of +5% and rate change of -3% on
premiums earned in 2019 over 2018, one might initially expect the accident year 2019 loss
and LAE ratio to be approximately 8% higher (= 1.05 / 0.97 - 1) than that for 2018. That is, if
the accident year 2018 loss and LAE ratio was 60%, one would expect the accident year 2019
ratio to be 65% (60% * 1.08). If the loss and LAE recorded in Schedule P, Part 1, for accident
year 2019 was 55%, one might question the rationale behind an improvement in loss ratio,
when deterioration was expected.
Additionally, deficiencies in loss and LAE reserves or current accident-year loss and LAE
ratios in excess of 100% lead to further investigation of whether the unearned premium is
adequate to cover losses that will emerge as premium is earned. In performing such an
investigation, consideration is often made for investment income.
In terms of the asset side of the balance sheet, property/casualty insurance companies tend
to invest in short-duration, relatively liquid fixed-income investments. Nearly 50% of the
assets held by U.S. property/casualty insurers at year-end 2018 were in bonds. However, the
financial crisis in 2008 taught us that even conservative investment strategies can pose a risk
to insurance companies. Changes in asset values and yields on invested assets are monitored
to assess this risk.
Further, investment in asset classes where the level of risk exceeds industry norms stimulates
investigation of the hedging strategies a company has in place to mitigate risk.
While a company’s balance sheet may appear financially solid, future earnings can be
impaired by a company’s underwriting, pricing and investment strategy. Although the Annual
Statement schedules and exhibits may not be able to uncover a weakening in earning strength
on their surface, trends in financial ratios and other analysis of year-over-year changes in
income statement line items can provide an early warning. Examples of such trends include:
• Rapid and substantial growth in written premium and the timing of such growth
relative to the underwriting cycle: In soft markets it is difficult to achieve significant
growth without concessions on price or commission levels. The Five-Year Historical
Data provides historical premium volume on a gross and net basis to assist in
measurement of a company’s growth.
• Increases in underwriting (or other) expense ratios: This may also be a sign that an
insurer is conceding commission to grow or maintain business. Increases in
commissions or other expenses mean that there is less premium available to pay
losses. The income statement and Part 3 of the Underwriting and Investment Exhibit
(U&IE) and the Insurance Expense Exhibit (IEE) are sources of this data.

FINANCIAL REPORTING THROUGH THE LENS OF A PROPERTY/CASUALTY ACTUARY
Part VIII. The Future of SAP
312
• Deteriorating loss ratios: Historical loss ratios can be observed on a calendar-year
basis in the Five-Year Historical Data or by accident year and line of business in
Schedule P. Deterioration in loss ratios implies that pricing is not keeping pace with
the underlying risk being underwritten. Further investigation into a company’s price
monitoring practices relative to peer benchmarks and ability to increase rates would
be warranted.
• Increased exposure to catastrophic or large events: A review of writings by state in
Schedule T and writings by line of business per the U&IE can help to identify
catastrophe exposure. A company with premium concentration in Florida homeowners
business suggests that the company may have increased exposure to hurricane risk.
Further, a review of Part 2 of the general interrogatories provides information
regarding a company’s probable maximum loss and provisions in place to protect the
company against such loss, such as a catastrophic reinsurance program.
• Losses on investments, change in mix of invested assets by class and/or declining
yields on investment assets: Such trends may suggest a change in a company’s
investment strategy or lack of control in the strategy.
• Increases in the provision for reinsurance: Changes in the provision for reinsurance, as
displayed in the capital and surplus account of the income statement, can be a sign of
increased credit risk.
Quarterly statements provide more limited information than what is included in the annual
filing. However, the primary financial statements remain in the same general format (i.e.,
Assets page; Liabilities, Surplus and Other Funds; Statement of Income; Cash Flow; and Notes
to Financial Statements), as do many of the schedules. The evaluation date is the quarter-end
and comparisons are made to the prior year-end. From the perspective of a property/casualty
actuary, the biggest difference is that quarterly statement does not include Schedule P.
Schedule P is replaced with a schedule titled “Part 3,” which shows loss and LAE reserve
development during the quarter for the latest three accident years and all years prior, for all
lines of business in the aggregate. While this schedule provides a gauge of retrospective
reserve strength during the current year, it does not provide all of the line of business detail
that is provided annually in Schedule P.
There is a wealth of information contained in the annual and quarterly statements. But
because more than 5,000 companies file their statements, state regulators of insurance
companies may not have the resources available to analyze these filings in detail for every
company domiciled or licensed to write business in their state. Rather, regulators rely on the
other tools coupled with the financial statements and schedules to prioritize those companies
of greatest risk of financial impairment.

FINANCIAL REPORTING THROUGH THE LENS OF A PROPERTY/CASUALTY ACTUARY
Part VIII. The Future of SAP
313
IRIS
As discussed in Chapter 20. IRIS Ratios, IRIS is one tool used by regulators. The IRIS ratios
focus on balance sheet strength and the earnings quality through measures that assess
growth, profitability, liquidity, and reserve development/adequacy.
Although the IRIS ratio results are not widely available to the public, they can be calculated
directly from an insurance company’s Annual Statement. We have done so for Fictitious in
Appendix I of this publication.
While there is no direct link to regulatory intervention based on the results of these ratios, the
results of the IRIS values are considered by regulators in conjunction with other solvency
monitoring tools, such as Risk-Based Capital (RBC), to prioritize those insurance companies
requiring immediate regulatory attention.
RBC
RBC is another tool that considers balance sheet strength and future earnings. Balance sheet
risk is considered in the asset risk charges (R
0
through R
3
), while profitability of future
writings is contemplated through the underwriting risk charges (R
4
and R
5
) and the
catastrophe risk charge (R
CAT
).
The calculations underlying an insurance company’s RBC are confidential and cumbersome to
perform without using the spreadsheet provided with the NAIC instructions. However, the
results of the RBC formula are provided in the Five-Year Historical Data exhibit within the
Annual Statement. Stakeholders are able to review overall results and monitor changes over
time.
RBC considers the risks and relative size of an insurance company in computing a required
level of capital, whereas under IRIS, no adjustments are made to reflect what would be
“usual” for an individual insurance company. Unlike IRIS, there is a direct link to regulatory
intervention based on a comparison of the RBC level of required capital to the company’s total
adjusted capital. The NAIC RBC Model Act provides regulators with the authority to take
control of a property/casualty insurance company if the company’s RBC ratio falls below
100% of the ACL.
RBC isn’t a fail-safe test for financial impairment. While certain of the RBC factors consider a
company’s own experience, the majority of the factors used to determine the level of required
capital are based on industry-wide factors developed by the NAIC. As a result, while a
company’s RBC ratios may not require any specific action by the company management or
regulatory authorities, this doesn’t mean that the company is safe from future impairment.
The trend test is one way that the RBC results are used to identify companies that may
become financially impaired. The purpose of the trend test is to identify companies likely to

FINANCIAL REPORTING THROUGH THE LENS OF A PROPERTY/CASUALTY ACTUARY
Part VIII. The Future of SAP
314
fall in the company action level RBC in the coming year and require those companies to take
action before that happens. The trigger for application of company action within the trend
test is having an RBC ratio within 100 points of the company action level RBC, coupled with a
current-year combined ratio of more than 120%.
SAO
The SAO provides assurance of a qualified actuary that the company’s loss and LAE reserves
are reasonable on a gross and net of reinsurance basis. It is not an opinion on the solvency of
an insurance company but an opinion on the adequacy of what is typically the largest item on
an insurance company’s balance sheet. Significant deviations in this balance may have a
material impact on a company’s solvency. Therefore, the actuary will provide commentary of
any significant uncertainties or risks that could result in a material adverse deviation in the
company’s recorded reserves.
A determination by the appointed actuary that the reserves are anything other than
“reasonable” and relevant comments that indicate there is are significant risks and/or
uncertainties that could result in material adverse deviation are two triggers of additional
scrutiny by regulatory authorities.
One thing the SAO does not tell the reader is the company’s reserve position within the
appointed actuary’s range, if the appointed actuary calculates a range. A company that is
exposed to significant risks and uncertainties, with reserves lying at the lower bound of the
actuary’s range, would be subject to greater concern than a company exposed to the same
level of risk with reserves in the high end of the appointed actuary’s range. There is no
document available for public review, which includes rating agencies, that contains the
appointed actuary’s range. The appointed actuary’s range is contained in the Actuarial
Opinion Summary (AOS), SAO documentation report, and usually found in the work papers of
the company’s external auditors.
As noted previously, the AOS is a confidential document, for regulators only. The actuarial
report contains the range; however, these reports contain restrictions on distribution and
use, due to their confidential nature, and therefore are not widely distributed. Similarly, while
audit work papers may be subpoenaed for cause, they are not publicly available.
AOS
The AOS is valuable in providing the regulator with context as to the company’s reserve
adequacy by providing the company’s position relative to the appointed actuary’s point
estimate or range, if calculated, on a net and gross of reinsurance basis. It also provides
details that explain to the regulator the cause for adverse development in the company’s
reserves over the past five years, where such development has exceeded 5% of surplus in

FINANCIAL REPORTING THROUGH THE LENS OF A PROPERTY/CASUALTY ACTUARY
Part VIII. The Future of SAP
315
three of those years. The AOS is also a confidential document that is only shared with the
insurance company’s state regulator.
Credit Rating Agencies
Stakeholders also rely on financial strength ratings (FSRs) issued by credit rating agencies
(CRAs) in the evaluation of financial health. FSRs represent a CRA’s evaluation of an
insurance company’s ability to meet ongoing obligations to its policyholders. This is in
contrast to debt/issuer credit ratings, which are also provided by CRAs. Debt/issuer ratings
represent the CRA’s evaluation of a company’s ability to meet debt obligations. Debt/issuer
credit ratings are provided on the creditworthiness of the entity as a whole or on individual
debt instruments.
Of the CRAs that rate insurance companies, A.M. Best is the only one that focuses exclusively
on the insurance industry, providing FSRs and debt/issuer ratings. A.M. Best rates thousands
of insurance entities across the globe. Other CRAs, such as Standard & Poor’s (S&P), Moody’s
and Fitch serve a wide range of industries (ranging from aerospace to utilities, financial
institutions and the public sector) and are prevalent in the area of debt/issuer ratings.
Ratings are based on qualitative and quantitative analysis of a company’s financial statements
and organization. Each CRA uses its own criteria. Qualitative factors can include corporate
governance, product development, composition of capital structure, asset quality, investment
strategy, reserve adequacy, claims management, contingent assets and liabilities, and the
level of reinsurance dependency. Quantitative analysis includes running a company’s financial
data through capital adequacy models. Each CRA has its own internally developed model that
computes required capital levels. Similar to RBC, the required capital levels are computed and
compared to an insurer’s capital to produce a ratio that translates to letter ratings. Examples
of CRA models include Best’s Capital Adequacy Ratio and S&P’s Capital Adequacy Ratio.
The higher the rating, the greater the ability the company is deemed to have to meet its
ongoing insurance obligations. The ability to meet ongoing insurance obligations generally
diminishes as ratings decrease. For example, A.M. Best’s FSR scale includes 7 rating symbols
from A+ (superior) to D (poor), with rating notches applicable to symbols A+ through C (weak)
to reflect a gradation of financial strength denoted by an additional “+” or “-“. With the rating
notches there are a total of 13 FSR designations. There are also 4 non-rating designations of
E (in conservation or rehabilitation), F (in liquidation), S (rating suspended) and NR (not
rated).
190
Regardless, the CRAs provide no guarantee that the insurance company will be able
to meet its obligations.
190
A.M. Best, Ratings & Criteria Center, Best’s Financial Strength Rating,
http://www.ambest.com/ratings/guide.pdf, 2019.

FINANCIAL REPORTING THROUGH THE LENS OF A PROPERTY/CASUALTY ACTUARY
Part VIII. The Future of SAP
316
FSR ratings are generally established annually, with ongoing monitoring performed by the
CRA analyst throughout the year to evaluate the impact of developments on a company’s
rating. Ongoing monitoring includes review of the following:
• Statutory financial statement filings
• Interim management reports and other information provided by the insurer to the
rating agency
• Significant public announcements, including earnings releases/calls, made by the
entity
A rating action or review can be considered at any time that A.M. Best becomes aware of
significant development in the insurer’s operations.
The following provides examples of the uses of FSRs by stakeholders of insurance companies:
• Individual and corporate policyholders want to make sure the insurance company will
be there when needed to pay claims. They therefore look to the FSR as an indicator in
their insurance buying decisions, weighing the company’s rating against the cost of
insurance.
• Many boards of directors of corporate policyholders require that their organization’s
insurance purchases are made with highly rated insurance companies. After the
financial crisis, many large corporations required insurance companies to include
cancellation endorsements to allow the insured to cancel without penalty if the carrier
was downgraded below a certain level(s) by recognized CRAs.
• Insurance companies will also look at FSRs of reinsurers in making reinsurance buying
decisions.
• Investors look at FSRs in their decision to invest in an insurance company, weighing
risk relative to the company’s rating with expected return.
HOW THESE TOOLS HAVE FARED — INDICATORS OF INSURANCE COMPANY INSOLVENCIES
OVER THE PAST 40 YEARS
The measurement tools discussed in this publication are designed to assist in predicting or
preventing all insurance company failures, but it is impossible for a tool to work in all
circumstances. The intent, however, is that they identify the vast majority before it’s too late.
Over the years, studies have been performed to detect the cause of insurance company
failure and therefore sharpen the tools that are available to monitor solvency. The American
Academy of Actuaries (AAA) has issued three such studies that, collectively, have examined
property/casualty insurance company insolvencies over a 40-year period, from 1969 through
2009. The following contains the results of these studies and common themes observed in
insolvent companies prior to their demise.

FINANCIAL REPORTING THROUGH THE LENS OF A PROPERTY/CASUALTY ACTUARY
Part VIII. The Future of SAP
317
The AAA Property/Casualty Financial Soundness/Risk Management Committee (the FSRM)
published a report in September 2010 titled Property/Casualty Insurance Company
Insolvencies. This report revisited the issue of insurance company solvencies, which was
examined in two previous studies in the 1990s by AAA, one based on property/casualty
insurance company insolvencies over the period 1969 to 1987 and the other from 1988 to
1990. The AAA’s research included submitting a questionnaire to insurance regulators on the
causes of the insurance company failures over that time period. In each period, “under-
reserving” and “mismanagement” were the first and second most frequently cited cause of
insurance company insolvencies.
Given that the adequacy of loss reserves was historically cited as the primary cause of
insolvency in the prior two studies, the 2010 report focused on the performance and
characteristics of companies having the largest reserve deficiencies. Additionally, the FSRM
studied five years’ worth of historical financial data for 36 property/casualty insurance
companies that became insolvent over the period 2005 to 2009 for commonalities. The 2010
report concluded the following:
• Insolvency is caused by a combination of factors. “Under-reserving” is a factor in the
insolvency of property/casualty insurance companies but “is not the leading cause of
insolvency.”
191
• Size, experience and diversification matters. “The majority of the companies was
small, relatively new, and/or was concentrated in one line of business and/or state.”
192
• Good management and governance is essential. “The review of financial data for many
of the companies showed evidence of poor management and decision-making,
including little or no reinsurance, inadequate reinsurance for the amount of risk, very
rapid premium growth, significant adverse development, inadequate pricing, and
potentially serious data problems.”
193
The report also studied the SAO as an indicator of financial impairment over the immediate
five years prior to insolvency. The FSRM concluded that the SAO alone is not a backstop for
insurance company insolvencies, but it “can help identify those companies and/or categories
of companies that could be in trouble.”
194
Where opinions were available, the FSRM observed
the following:
• Only one SAO was qualified, and the remaining were “reasonable” reserve opinions.
191
American Academy of Actuaries Property/Casualty Financial Soundness/Risk Management Committee.
Property/Casualty Insurance Company Insolvencies, September 2010, page 5.
192
Ibid., page 16.
193
Ibid.
194
Ibid., page 18.

FINANCIAL REPORTING THROUGH THE LENS OF A PROPERTY/CASUALTY ACTUARY
Part VIII. The Future of SAP
318
• Nearly 50% of the SAOs concluded that a risk of material adverse deviation existed in
the company’s loss and LAE reserves, 37% concluded that such a risk did not exist, and
the remainder of the SAOs either did not comment on the risk of material adverse
deviation or it wasn’t clear if the appointed actuary deemed a risk of material adverse
deviation existed.
• When stated, materiality standards were generally based on a percentage of surplus
(between 5% and 20%).
We note that the NAIC Actuarial Opinion Instructions and Actuarial Standards of Practice
issued by the Actuarial Standards Board have continued to include enhancements on
disclosure requirements within the SAO since the period studied.
The commonalities identified in the above studies provide us with areas of focus when
evaluating the tools used to measure financial health. The key message is that financial
impairment is caused by a variety of factors, and the measurement tools discussed in this
publication, when considered in unison, can help detect companies at risk for financial
impairment.

FINANCIAL REPORTING THROUGH THE LENS OF A PROPERTY/CASUALTY ACTUARY
Part VI. Differences from Statutory to other Financial/Regulatory Reporting Frameworks in
the U.S.
319
PART VI. DIFFERENCES FROM STATUTORY TO OTHER
FINANCIAL/REGULATORY REPORTING FRAMEWORKS IN THE U.S.
INTRODUCTION TO PART VI
As discussed in Part III. SAP in the U.S.: Fundamental Aspects of the Annual Statement, U.S.
Statutory Accounting Principles (SAP) focuses on the solvency of insurance companies.
However, other frameworks exist for solvency, general purpose financial reporting, and
taxation. In this section we will examine these other frameworks, beginning with general
purpose financial reporting.
The framework in the U.S. for general purpose financial reporting is U.S. Generally Accepted
Accounting Principles (GAAP). We will focus on the key differences between U.S. SAP and
U.S. GAAP. We will also study the importance of accounting for business combinations and
consider calculations that involve actuaries in fair valuing the balance sheet in accordance
with the requirements of U.S. GAAP. We will provide an overview of the emergence of
International Financial Reporting Standards as a general purpose financial reporting
framework. We will also provide a brief overview of the European regulatory framework
known as Solvency II. Finally, we will discuss financial reporting for tax purposes.

FINANCIAL REPORTING THROUGH THE LENS OF A PROPERTY/CASUALTY ACTUARY
Part VI. Differences from Statutory to other Financial/Regulatory Reporting Frameworks in
the U.S.
320
CHAPTER 22. U.S. GAAP
195
, INCLUDING ADDITIONAL SEC REPORTING
196
OVERVIEW
U.S. Generally Accepted Accounting Principles (GAAP)for public companies is, by statute,
determined by the Securities and Exchange Commission (SEC). The SEC has effectively
delegated this responsibility since its inception to the private sector. Currently, the SEC looks
to the Financial Accounting Standards Board (FASB) as the organization for establishing
standards of financial accounting. In 2009, the FASB codified U.S. GAAP by publishing its
Accounting Standards Codification (ASC). The ASC replaced several sources of authoritative
U.S. GAAP literature from various standard setters. These sources included:
1. FASB
a. Statements (FAS)
b. Interpretations (FIN)
c. Technical Bulletins (FTB)
d. Staff Positions (FSP)
e. Staff Implementation Guides (Q&A)
f. Statement No. 138 Examples.
2. Emerging Issues Task Force (EITF)
a. Abstracts
b. Topic D.
3. Derivative Implementation Group (DIG) Issues
4. Accounting Principles Board (APB) Opinions
5. Accounting Research Bulletins (ARB)
6. Accounting Interpretations (AIN)
7. American Institute of Certified Public Accountants (AICPA)
a. Statements of Position (SOP)
b. Audit and Accounting Guides (AAG) — only for incremental accounting
guidance
c. Practice Bulletins (PB)
d. Technical Inquiry Service (TIS) — only for Software Revenue Recognition
References to the newly codified standards usually start with the letters ASC followed by a
series of numbers. Insurance specific guidance can be found in Section 944. For example, the
definition of the measurement approach to unpaid claims estimates under U.S. GAAP can be
found at ASC-944-40-30-1. It states: “The liability for unpaid claims shall be based on the
estimated ultimate cost of settling the claims (including the effects of inflation and other
195
Aligns with IASA Chapter 14.
196
Aligns with IASA Chapter 15.

FINANCIAL REPORTING THROUGH THE LENS OF A PROPERTY/CASUALTY ACTUARY
Part VI. Differences from Statutory to other Financial/Regulatory Reporting Frameworks in
the U.S.
321
societal and economic factors), using past experience adjusted for current trends, and any
other factors that would modify past experience.” A free basic version of the ASC is available,
after registering, at https://asc.fasb.org/.
197
Historically, U.S. GAAP formed the foundation of U.S. Statutory Accounting Principles (SAP).
From this foundation, U.S. SAP evolved over time (on a state by state basis), incorporating
many modifications and exceptions to U.S. GAAP in the interest of establishing a more
conservative accounting framework with a focus on solvency. In the 1990s, the National
Association of Insurance Commissioners (NAIC) undertook a project (Codification) to
consolidate the myriad state-based rules and exceptions to U.S. GAAP into a cohesive set of
accounting principles. included in the NAIC Accounting Practices and Procedures Manual. SAP
still remains the prerogative of each individual state; however, Codification provides a
consistent and comprehensive framework of accounting and reporting guidance for each
state insurance department to consider. As new pronouncements are made under U.S. GAAP,
they are reviewed by the NAIC’s Statutory Accounting Principles Working Group, which
decides whether to adopt, reject or modify it for NAIC SAP. In turn, each state may accept
what the NAIC has produced or adopt deviations or develop exceptions to the guidance that
would apply to insurance entities domiciled in that state.
The fundamental difference between U.S. SAP and U.S. GAAP is driven by the intended user.
U.S. SAP is intended for use by state insurance regulators and is thus focused on an insurance
company’s ability to pay claims, emphasizing the adequacy of surplus in the balance sheet.
This is generally viewed as conservative-leaning philosophy to provide an element of margin if
the regulator would need one day to step in to settle all current liabilities while not writing any
new business. U.S. GAAP is primarily intended for use by investors and creditors and has
historically been focused on the measurement of earnings emergence, through the income
statement, over a specified reporting period. Given the objective of U.S. SAP, it is not
surprising that it is viewed as a conservative basis of accounting in comparison to U.S. GAAP.
There are many differences between U.S. GAAP and U.S. SAP, but we will focus on those that
actuaries need to be familiar with:
• Deferred acquisition costs (DAC)
• Premium deficiency reserves (PDR)
• Nonadmitted assets
• Deferred tax assets (DTAs)
• Invested assets
• Balance sheet presentation of reinsurance
• Ceded reinsurance — prospective and retroactive
• Structured settlements
197
FASB, Accounting Standards Codification, https://asc.fasb.org/, 2012.

FINANCIAL REPORTING THROUGH THE LENS OF A PROPERTY/CASUALTY ACTUARY
Part VI. Differences from Statutory to other Financial/Regulatory Reporting Frameworks in
the U.S.
322
• Anticipated subrogation and salvage
• Discounting of loss reserves
• Goodwill under purchase accounting
DEFERRED ACQUISITION COSTS
DAC is an asset that is established under GAAP to defer the recognition of acquisition
expenses to match the recognition of earned premium. Beginning in 2012, the deferral of
acquisition costs is limited to those direct costs (i.e., those which would not have been
incurred if the contract had not been entered into) related to the successful acquisition or
renewal of a contract. In addition, certain direct marketing advertising costs can be deferred
under very limited circumstances. All other expenses, either direct or indirect, must be
expensed as incurred.
Certain companies are permitted to limit the capitalization (deferred expenditure) of DAC to
those expenses they had been capitalizing prior to 2012 if they previously had not been
capitalizing all expenses that met the definition of direct expenses related to the successful
acquisition or renewal of insurance contracts. Capitalization of acquisition costs, through the
establishment of a DAC asset, is not permitted under SAP. Therefore, all acquisition costs are
expensed to current operations as incurred. This is keeping with the conservative philosophy
of SAP.
Under SAP, if the ceding commission under a reinsurance agreement exceeds the anticipated
acquisition cost of the business ceded, the ceding entity shall establish a liability, equal to the
difference between the anticipated acquisition cost and the reinsurance commissions
received, to be amortized over the effective period of the reinsurance agreement in
proportion to the amount of coverage provided under the reinsurance contract. For example,
when the commission rate of a company’s direct business is 10% and the ceding commission
rate charged for the business ceded is 20%, it is likely that after considering all other
anticipated direct acquisition costs, the ceded commission is still higher than the direct
acquisition cost of the business being ceded. While the recognition of a DAC asset is not
permitted, and the corresponding direct acquisition costs should be expensed to current
operations, in this example, a net liability must be recognized by the ceding entity, reported
as a write-in liability item on the balance sheet rather than a gain to the current operations.
This effectively defers the gain until such time as the premium is earned.

FINANCIAL REPORTING THROUGH THE LENS OF A PROPERTY/CASUALTY ACTUARY
Part VI. Differences from Statutory to other Financial/Regulatory Reporting Frameworks in
the U.S.
323
PREMIUM DEFICIENCY RESERVES
Under both GAAP and SAP, a PDR must be recognized with a charge to current operations
when the unearned premium reserve (UPR) is insufficient to cover the anticipated losses, loss
adjustment expenses, commissions and other acquisition costs, and maintenance costs
associated with the unexpired exposure. When a company performs the premium deficiency
analysis, insurance contracts should be grouped in a manner consistent with how policies are
marketed, serviced and measured. A liability should be recognized for each policy grouping
where a premium deficiency is indicated. Premium deficiency from one policy grouping cannot
be offset by expected profits from any other grouping.
Under both GAAP and SAP, a company is allowed to include anticipated investment income in
the premium deficiency analysis.
The major difference in the calculation of premium deficiency liability between GAAP and SAP is
that under SAP, commissions and other acquisition costs should not be included to the extent
that the related amounts have previously been expensed rather than established as an asset.
The table below, using three numerical examples, illustrates the difference in the calculation
of premium deficiency liability between GAAP and SAP:
TABLE 100
Policy
Grouping
UPR
Present Value
of Total
Expected Loss
Anticipated
Investment
Income
DAC
GAAP
-
basis
Expected
Profit
GAAP
-
basis
Premium
Deficiency
Calculated
SAP
-
basis
Expected
Profit
SAP
-
basis
Premium
Deficiency
Calculated
(1)
(2)
(3)
(4)
(5) = (1)
–
(2)
+ (3)
–
(4)
(6)
(7) = (1)
–
(2)
+ (3)
(8)
A
$10,000
$8,000
$500
$2,000
$
500
$0
$2,500
$
-
B
$10,000
$9,000
$500
$2,000
$(500)
$500
$1,500
$
-
C
$10,000
$12,000
$500
$2,000
$(3,500)
$3,500
$(1,500)
$ 1,500
Balance Sheet Presentation of Deferred Acquisition Costs and Premium Deficiency Reserves
Under GAAP, DAC is established as an asset and is presented net of ceded DAC. If a PDR is
calculated, it first lowers the recorded DAC asset; once the DAC asset is exhausted, a
separate PDR liability should be established.
Under SAP, any premium deficiency is either included in the UPR balance or reported as a
write-in liability item.
The table below illustrates the difference in the presentation of DAC and PDR between GAAP
and SAP.

FINANCIAL REPORTING THROUGH THE LENS OF A PROPERTY/CASUALTY ACTUARY
Part VI. Differences from Statutory to other Financial/Regulatory Reporting Frameworks in
the U.S.
324
TABLE 101
Policy Grouping
Original DAC
GAAP
-
basis
Premium
Deficiency
Calculated
GAAP
-
basis DAC
Asset
G
AAP
-
basis PDR
Liability
SAP
-
basis
Premium
Deficiency
Calculated
SAP
-
basis DAC
Asset
SAP
-
basis PDR
Liability
(1)
(2)
(3)
(4)
(5)
(6)
(7)
1
$2,000
$
-
$2,000
$
-
$
-
$
-
$
-
2
$2,000
$500
$1,500
$
-
$
-
$
-
$
-
3
$2,000
$3,500
$
-
$1,500
$1,500
$
-
$1
,500
NONADMITTED ASSETS
As discussed in Part III. SAP in the U.S.: Fundamental Aspects of the Annual Statement, SAP is
focused on the ability of an insurance company to pay claims. To reflect that certain assets
are not readily liquid, they are considered nonadmitted for purposes of determining the
company’s statutory surplus. One such example is furniture, fixtures and equipment.
For other asset categories, matters are more complicated as they may be partly admitted and
partly nonadmitted. One such asset category is DTAs.
DEFERRED TAX ASSETS
Under GAAP and SAP, deferred taxes are established for temporary differences in the
accounting and tax treatment of all assets and liabilities. For example, discounting of loss
reserves for tax purposes but not for accounting purposes leads to a deferred tax asset. This
is because you pay tax based on income (revenue minus expenses) under the tax accounting
basis. If liabilities incurred are discounted for tax purposes, this leads to higher income, which
produces more tax for the taxing authorities. But the discount on incurred losses will unwind
over time and create an expense that will reduce future taxable income. Some or all of this
reduction to future taxable income is what is recorded as a DTA.
The primary difference between GAAP and SAP is in the treatment of DTAs. For GAAP, DTAs
are fully recognized, and a valuation allowance is established if, based on the weight of
evidence, it is more likely than not that the DTAs will not be realized. GAAP establishes a
hierarchy of evidence to be considered. This is a subjective determination requiring
management to use significant judgment. Under SAP, there is a strict admissibility test for all
DTAs in addition to the establishment of a valuation allowance. This can lead to recognition of
less DTAs in SAP basis financial statements. Since January 1, 2012, the admitted portion is
calculated as the sum of the following three components:
198
198
This recent change is not reflected in the 2007 Feldblum taxation CAS Study Note.

FINANCIAL REPORTING THROUGH THE LENS OF A PROPERTY/CASUALTY ACTUARY
Part VI. Differences from Statutory to other Financial/Regulatory Reporting Frameworks in
the U.S.
325
1. Federal income taxes paid in prior years that can be recovered through loss
carrybacks for existing temporary differences that reverse during a timeframe
corresponding with IRS tax loss carryback provisions
199
(not to exceed three years),
including the amount established for tax loss contingencies related to those periods.
2. The amount of DTA expected to reverse during the forthcoming period (up to a
maximum of three years), limited to a percentage of surplus. The period and
percentage of surplus is determined based on the company’s ratio of total authorized
capital (with some adjustments) to authorized control level (ACL) Risk-Based Capital
(RBC). For example, the December 31 ratio is calculated based on the Authorized
Control Level RBC for the current reporting period, which is in process of being filed
with the company’s state of domicile. Different rules apply for non-RBC reporting
entities such as mortgage guarantee insurers.
3. The amount of DTA after application of the first and second components that can be
offset against existing DTLs. The character (i.e., ordinary vs capital) of the DTAs and
DTLs must be taken into consideration. Ordinary DTAs can be admitted by offset with
ordinary DTLs and/or capital DTLs; however, capital DTAs can only be admitted by
offset with capital DTLs.
INVESTED ASSETS
Under SAP, investment-grade bonds and higher quality redeemable preferred stocks are held
at cost or amortized cost while below-investment-grade bonds and lower quality redeemable
preferred stocks are held at the lower of cost, amortized cost or fair value. All common stock
and higher quality perpetual (i.e., non-redeemable) preferred stock are recorded at fair value.
Lower quality non-redeemable preferred stock are held at the lower of cost or fair value.
Changes in the carrying value of investments attributed to changes in fair value are recorded
directly to surplus.
The accounting treatment of investment-grade bonds appears to be inconsistent with the
conservative philosophy of SAP. In the case of increasing interest rates, the market value of
older investment-grade bonds issued at a lower interest rate will decrease. Yet SAP allows for
the asset to be carried at the higher amortized cost value. One possible explanation for this is
that the difference is only temporary if the bond is held until maturity, as is typically done by
most property/casualty insurers.
Effective December 31, 2017, SAP adopted a revised definition of bonds that identifies
certain non-bond types of non-bond investments as SVO-identified investments that receive
special statutory accounting treatment under the new guidance. These specifically identified
investments shall be treated in the same way as those included in the revised definition of
199
Under the Federal Internal Revenue Code, for nonlife insurance entities, ordinary losses can be carried back two
years, while capital losses can be carried back three years.

FINANCIAL REPORTING THROUGH THE LENS OF A PROPERTY/CASUALTY ACTUARY
Part VI. Differences from Statutory to other Financial/Regulatory Reporting Frameworks in
the U.S.
326
bonds. The new guidance also introduces the concept of systematic value for SVO-identified
investments and allows a company to elect the use of a documented systematic approach to
value its higher quality SVO-identified investments if certain conditions are met. SVO-
identified investments for which the company has not made this election, or do not qualify for
the use of systematic value, should be measured and reported at fair value. Net asset value
(NAV) is allowed to be used as a practical expedient to fair value for these investments.
The table below summarizes the accounting treatment under SAP for investments in bonds,
common stocks, preferred stocks and SVO-identified investments
200
:
TABLE 102
Investment Type
NAIC Designation
Book Value
Bonds (both long
-
term and short
-
term)
1
-
2
Amortized cost
Bonds (both
long
-
term and short
-
term)
3
-
6
Lower of amortized cost or fair value
Common Stocks
N/A
Fair value
Redeemable Preferred Stocks
1
-
2
Cost or a
mortized cost
Nonredeemable Preferred Stocks
1
-
2
Fair value
Redeemable Preferred Stocks
3
-
6
Lower of
cost,
amortiz
ed cost or fair value
Nonredeemable Preferred Stocks
3
-
6
Lower of cost or fair va
lue
SVO
-
Identified Investments
1
-
2
Fair value unless
systematic value
is
elected
SVO
-
Identified Investments
3
-
6
Fair value
Under U.S. GAAP, financial instruments such as bonds and stocks are classified as Available-
For-Sale (AFS), Held-To-Maturity (HTM) or trading securities. The acquiring entity classifies
the financial instrument at the time of acquisition, and the appropriateness of the
classification is reassessed at each reporting date. If a security is acquired with the intent of
selling it within hours or days, the security is classified as trading. However, at acquisition an
entity is not precluded from classifying a security as trading if it plans to hold it for a longer
period. Trading securities include both debt and marketable equity securities. Trading
securities are recorded at fair value with changes in fair value recorded in the income
statement. Investments in debt securities are classified as HTM only if the reporting entity has
the positive intent and ability to hold those securities to maturity. Equity securities cannot be
classified as HTM because they do not have a stated maturity date. HTM debt securities are
recorded at amortized cost. Investments in debt securities and equity securities that have
readily determinable fair values not classified as either trading securities or HTM securities
200
Per SSAP No. 26R, SVO-identified investments refer to certain Exchange Traded Funds and Bond Mutual Funds
that shall be treated as if they were bonds under the new guidance. For these investments, net asset value (NAV) is
allowed as a practical expedient to fair value. The use of a systematic value is an irrevocable election. SSAP No.26R
is effective December 31, 2017, but these investments shall be reported at their systematic value, if elected,
starting on January 1, 2018.

FINANCIAL REPORTING THROUGH THE LENS OF A PROPERTY/CASUALTY ACTUARY
Part VI. Differences from Statutory to other Financial/Regulatory Reporting Frameworks in
the U.S.
327
are classified as AFS securities. The AFS category is the default or residual security
classification. AFS securities are recorded at fair value with changes in fair value reported in
other comprehensive income (OCI), resulting in a direct change to the value of U.S. GAAP
equity, rather than changes in their fair value flowing through the income statement. Most
property/casualty companies’ financial instruments are classified and measured as AFS.
BALANCE SHEET PRESENTATION OF CEDED REINSURANCE
U.S. GAAP requires, due to limited rights to offset assets and liabilities, that liabilities be
presented gross on the balance sheet with a separate asset for anticipated ceded reinsurance
recoveries. SAP requires the balance sheet presentation of liabilities on page 3 of the Annual
Statement to be presented net of ceded reinsurance. Schedule P provides additional detail on
the gross liabilities.
Using the Fictitious Insurance Company as our example, we have created the table below
illustrating how the balance sheet presentation differs between GAAP and SAP for the line
items associated with ceded reinsurance. The table shows how the SAP-basis balances
illustrated correspond to the specific line items on the annual statement of the Fictitious
Insurance Company (see Appendix I).

FINANCIAL REPORTING THROUGH THE LENS OF A PROPERTY/CASUALTY ACTUARY
Part VI. Differences from Statutory to other Financial/Regulatory Reporting Frameworks in
the U.S.
328
TABLE 103
CEDED REINSURANCE — PROSPECTIVE AND RETROACTIVE
The accounting for reinsurance depends on whether the reinsurance contract covers future
or past insured events. The latter is called retroactive reinsurance and the former prospective
reinsurance. The difference between SAP and U.S. GAAP for prospective reinsurance is
limited to balance sheet presentation. illustrated in Table 103 above.
Retroactive reinsurance, however, has a different measurement approach for SAP compared
to U.S. GAAP. SAP requires that undiscounted ceded reserves be recorded as a negative
write-in liability. This leaves Schedule P unchanged, i.e., gross of the retroactive reinsurance.
Any gain to the ceding company (excess of the negative write-in liability over the
consideration paid for the reinsurance) is treated as write-in gain in other income and
restricted as special surplus until the actual paid reinsurance recovery is in excess of the
consideration paid.
GAAP basis
Assets:
Reinsurance Recoverables
On Paid Losses 426,000$
On Unpaid Losses 10,142,000$
Prepaid Reinsurance Premiums 920,000$
Liabilities:
Reserve for Losses and Loss Adjustment Expenses 61,699,000$
Ceded Reinsurance Premium Payable (Net of Ceded Commission) 440,000$
Unearned Premium Reserve 12,815,000$
SAP basis
AS Line
Assets: Page 2
Reinsurance Recoverables
On Paid Losses 426,000$ 16.1
Liabilities: Page 3
Reserve for Losses and Loss Adjustment Expenses 51,557,000$ 1+3
Ceded Reinsurance Premium Payable (Net of Ceded Commission) 440,000$ 12
Unearned Premium Reserve 11,895,000$ 9
Provision for Reinsurance 283,000$ 16

FINANCIAL REPORTING THROUGH THE LENS OF A PROPERTY/CASUALTY ACTUARY
Part VI. Differences from Statutory to other Financial/Regulatory Reporting Frameworks in
the U.S.
329
U.S. GAAP requires ceded reserves to be recorded as a reinsurance asset. Any gain is
deferred, thereby resulting in no immediate income or surplus benefit. The deferred gain is
amortized using the interest method if the timing of the payments under the reinsurance
treaty are reasonably estimable. Otherwise the proportion of actual recoveries to total
estimated recoveries (the recovery method) determines the amount of amortization.
STRUCTURED SETTLEMENTS
To settle certain liability claims, an insurance company may purchase an annuity from a life
insurance company with the beneficiary being the original claimant. For the case where a full
release is signed by the claimant upon agreement to settle for the future annuity payments,
the GAAP and SAP treatments are the same. The purchase price of the annuity is recorded as
a paid loss and the claim is closed.
In the situation where a full release is not provided to the insurance company by the claimant,
the insurance company is still contingently liable. In this situation, U.S. GAAP treats the
structured settlement like a reinsurance contract, thus retaining the loss reserve and
establishing an equivalent reinsurance recoverable. The accounting under SAP is the same as
for structured settlements where a release is obtained, but it requires that the insurance
company disclose the amount of these contingent liabilities in the Notes to Financial
Statements.
ANTICIPATED SALVAGE AND SUBROGATION
In Schedule P reserves can be stated either gross or net of anticipated salvage and
subrogation. If the reserves are stated net, column 23 in Schedule P discloses the amount of
anticipated salvage and subrogation. This election appears to be a residual effect of pre-
codification standards where certain states required reserves to be stated gross of
anticipated salvage and subrogation.
Under U.S. GAAP, estimated realizable salvage and subrogation is subtracted from the unpaid
loss estimates.
DISCOUNTING OF LOSS RESERVES
Statement of Statutory Accounting Principles (SSAP) 65 indicates that except for certain
workers compensation and long-term disability claims with fixed and reasonably determinable
payments, property/casualty loss reserves cannot be discounted. For those reserves that are
tabular based, SSAP 65 is silent on the permitted discount rate. Most state regulations are
also silent, but typically 3.5% per annum is used. For non-tabular reserves SSAP 65
recommends that the discount rate should be determined in accordance with Actuarial
Standard of Practice 20, but capped at the lesser of:

FINANCIAL REPORTING THROUGH THE LENS OF A PROPERTY/CASUALTY ACTUARY
Part VI. Differences from Statutory to other Financial/Regulatory Reporting Frameworks in
the U.S.
330
1. If the company’s statutory invested assets are at least equal to the total of all
policyholder reserves, the company’s net rate of return on statutory invested assets
minus 1.5%; otherwise, the company’s average net portfolio yield rate minus 1.5%
2. The current yield to maturity on a U.S. Treasury debt instrument with a duration that
is consistent to the payment of the claims
For U.S. GAAP, ASC 944-40-S30-1 refers to an SEC staff bulletin that indicates it is
permissible to apply the same discount calculated under SAP for U.S. GAAP purposes. It also
indicates that an alternative discount rate could be used as long as the alternative rate “is
reasonable on the facts and circumstances applicable to the registrant at the time the claims
are settled.” This SEC staff bulletin was prepared in response to an inquiry from a registrant
asking if it was permissible to discount for U.S. GAAP purposes based on the company’s
historical investment yield.
GOODWILL UNDER PURCHASE ACCOUNTING
Under SAP, a business combination is accounted for as either a statutory purchase or a
statutory merger. Business combinations that create parent-subsidiary relationships are
accounted for as a statutory purchase. Alternatively, transactions are accounted for as a
statutory merger if equity of one entity is issued in exchange for equity of the second entity,
with the equity in the second entity then canceled. Prospectively, only one entity exists.
Under statutory purchase accounting, the assets and liabilities of the acquired entity are
recorded at their historical carrying (i.e., book) values. Goodwill is calculated as the difference
between the purchase price and the net book value of the acquired entity. Goodwill is limited
in the aggregate to 10% of the acquiring entity’s capital and surplus (adjusted to exclude any
net positive goodwill, electronic data processing equipment and operating system software,
and net DTAs) for its most recently filed Annual Statement. Goodwill is amortized to
unrealized capital gains and losses over the period in which the acquiring entity benefits
economically, not to exceed 10 years.
Under U.S. GAAP, all business combinations are accounted for using purchase accounting,
which requires all assets and liabilities of the acquired entity to be recorded at fair value
(including all identifiable intangible assets). Goodwill represents the difference between the
purchase price and the fair value of the net assets of the acquired entity. Goodwill is not
amortized but is evaluated for possible impairment on a regular basis.
For example, Company XYZ acquired Company ABC (an insurance entity) on January 1,
2018. We assumed that the purchase price of Company ABC was $3 million, the fair value of
Company ABC’s net assets was $2 million, and the statutory surplus amount of Company ABC
was $1.5 million. On January 1, 2018, we calculated that under SAP the goodwill recorded
should be $1.5 million, the difference between the purchase price and the statutory surplus of
Company ABC, and that under GAAP the goodwill recorded should be $1 million, the

FINANCIAL REPORTING THROUGH THE LENS OF A PROPERTY/CASUALTY ACTUARY
Part VI. Differences from Statutory to other Financial/Regulatory Reporting Frameworks in
the U.S.
331
difference between the purchase price and the fair value of the net assets. On December 31,
2018, we calculated that under SAP the goodwill recorded should be reduced to $1.35 million
after amortization (assuming the goodwill should be amortized over 10 years) and that under
GAAP the goodwill recorded should remain at $1 million as no impairment was identified.
In the case of a negative goodwill, under SAP, it should be recorded as a contra-asset and be
amortized to unrealized capital gains and losses over a period not to exceed 10 years; under
GAAP, the negative goodwill should first offset the book value of the acquired non-current
assets (plant, property, equipment, intangibles, and other non-current and non-monetary
assets) and the residual negative goodwill recorded as a bargain purchase gain through the
income statement.
Due to these different approaches in calculating goodwill, the initial amounts of goodwill
under SAP and GAAP can be significantly different. Chapter 23. Fair Value Under Purchase
GAAP will discuss further the concept of fair value in business combinations.
SEC REPORTING
Companies with publicly traded securities are required to file quarterly (Form 10-Q) and
annual (Form 10-K) financial reports with the SEC. In addition, companies are required to file
a Form 8-K on an ad hoc basis for material events as they occur. The triggering events
requiring the filing of an 8-K include a change in the principal officers or directors of the
company, a change in the company’s certified accountant, and entering or terminating a
material definitive agreement.
These filings provide investors with quantitative and qualitative information about a
company’s business and operations, allowing investors to make informed and timely
decisions. The key contents by section of a 10-K include:
• Part I — Business description, risks factors, unresolved comments from SEC staff,
properties, and legal proceedings
• Part II — Financial statements and supplementary data, selected financial data,
management’s discussion and analysis of financial condition and results of operations,
and controls and procedures
• Part III — Directors and executive officers of the company, executive compensation,
securities ownership by certain beneficial owners and management, certain
relationships and related transactions, and the fees of the principal accountant
• Part IV — Reports, exhibits and schedules from 8-Ks filed during the reporting period.
The 10-Q is an abbreviated form of the 10-K.
SEC reporting requirements for all registrants are mainly outlined in two regulations.

FINANCIAL REPORTING THROUGH THE LENS OF A PROPERTY/CASUALTY ACTUARY
Part VI. Differences from Statutory to other Financial/Regulatory Reporting Frameworks in
the U.S.
332
1. Regulation S-X — Form and Content of Financial Statements
2. Regulation S-K — Integrated Disclosure Rules
Regulation S-X contains general instructions to all companies around the composition and
presentation of financial statements. Specifically, article seven provides detailed rules around
the form and content of financial statement data and schedules of insurance companies.
Many of these requirements are also required under GAAP. In particular, article seven
requires the insurance company to state in the Notes to Financial Statements the:
• Basis of assumptions, including interest rates, for determining discounted liabilities
• Deferred acquisition costs amortized in the period
• Statutory stockholders equity and net income or loss
In addition, Regulation S-X requires certain schedules to be included in each registrant’s 10-K
form (their annual filing). These schedules include:
• Schedule III — Supplementary insurance information for each reporting segment, of
which the following is required to be reported:
• Deferred policy acquisition costs
• Unpaid loss and loss expenses
• Unearned premiums
• Other policy claims payable
• Premium revenue
• Net investment income
• Losses and loss expenses
• Amortization of deferred policy acquisition costs
• Other operating expenses
• Premiums written
• Schedule IV — Reinsurance including amounts ceded and assumed
• Schedule VI — Supplemental information concerning property/casualty insurance
operations that includes the same information as Schedule III in total across fiscal
years for the current fiscal year and the two years prior
Following are examples of Schedules III (Table 104), IV (Table 105) and VI (Table 106) from a
2018 10-K filing for a company we are calling “Fictional Insurance Company”.

FINANCIAL REPORTING THROUGH THE LENS OF A PROPERTY/CASUALTY ACTUARY
Part VI. Differences from Statutory to other Financial/Regulatory Reporting Frameworks in
the U.S.
333
TABLE 104
10
-
K Schedule III
Fictional Insurance Company
Supplementary Insurance Information
2016—2018
($ in millions)
Segment
Deferred
Acquisition
Costs
Claims and
Claim
Adjustment
Expense
Reserves
Unearned
Premiums
Earned
Premiums
Net
Investment
Income (1)
Claims and
Claim
Adjustment
Expenses
Amortization
of Deferred
Acquisition
Costs
Other
Operating
Expenses (2)
Net
Written
Premiums
2018
Business Insurance 430 21,132 2,887 5,965 1,075 448 956 1,024 5,972
Financial,
Professional and
International
Insurance 175 3,611 1,076 1,671 218 783 318 341 1,633
Personal Insurance 336 2,300 1,884 3,996 223 3,340 768 478 4,078
Total – Reportable
Segments 940 27,042 5,846 11,632 1,516 8,571 2,041 1,843 11,684
Other – 35 – – – – – 233 –
Consolidated 940 27,077 5,846 11,632 1,516 8,571 2,041 2,076 11,684
2017
Business Insurance 424 21,231 2,825 5,669 1,135 3,425 921 1,003 5,717
Financial,
Professional and
International
Insurance 185 3,686 1,126 1,747 231 895 322 320 1,691
Personal Insurance 329 2,222 1,800 3,870 244 2,636 759 457 3,985
Total – Reportable
Segments 938 27,139 5,751 11,286 1,611 6,956 2,002 1,779 11,393
Other – 36 – – – – – 219 –
Consolidated 938 27,175 5,751 11,286 1,611 6,956 2,002 1,998 11,393
2016
Business Insurance 417 22,171 2,833 5,776 1,002 3,179 935 1,035 5,741
Financial,
Professional and
International
Insurance 194 3,790 1,199 1,755 238 920 328 305 1,730
Personal Insurance 315 2,227 1,688 3,748 222 2,435 746 413 3,765
Total – Reportable
Segments 926 28,188 5,719 11,279 1,462 6,534 2,008 1,753 11,235
Other – 38 – – – – – 221 –
Consolidated 926 28,226 5,719 11,279 1,462 6,534 2,008 1,974 11,235
(1) See note 2 to the consolidated financial statements for discussion of the method used to allocate net investment income and invested assets
to
the identified segments.
(2) Expense allocations are determined in accordance with pr
escribed statutory accounting practices. These practices make a reasonable allocation of
all expenses to those product lines with which they are associated.

FINANCIAL REPORTING THROUGH THE LENS OF A PROPERTY/CASUALTY ACTUARY
Part VI. Differences from Statutory to other Financial/Regulatory Reporting Frameworks in
the U.S.
334
TABLE 105
10
-
K Schedule IV
Fictional Insurance Company
Valuation and Qualifying Accounts
(USD in millions)
Balance
beginning
of period
Charged
to costs
and
expenses
Charged
to other
accounts
(1)
Deductions
(2)
Balance at
end of
period
2018
Reinsurance recoverables
191
–
–
9
182
Allowance for uncollectible:
Premiums receivable from u
nderwriting
activities
61
12
–
29
44
Deductions
19
3
–
2
21
2017
Reinsurance recoverables
275
–
–
84
191
Allowance for
uncollectible:
Premiums receivable from underwriting
activities
68
24
(1)
31
61
Deductions
26
(4)
–
2
19
2016
Reinsurance recoverables
325
–
–
50
275
Allowance for uncollectible:
premiums receivable from underwriting
activities
68
32
1
33
68
Deductions
35
(2)
–
7
26
(1) Charged to claims and claim adjustment expenses in the consolidated statement of income.
(2) Credited to the related asset account.

FINANCIAL REPORTING THROUGH THE LENS OF A PROPERTY/CASUALTY ACTUARY
Part VI. Differences from Statutory to other Financial/Regulatory Reporting Frameworks in
the U.S.
335
TABLE 106
10
-
K Schedule VI
Fictional Insurance Company
Supplementary Information Concerning Property-Casualty Insurance Operations (1)
2016–2018
(USD in millions)
Affiliation
with
Registrant
(2)
Deferred
Acquisitio
n Costs
Claims and
Claim
Adjustment
Expense
Reserves
Discount
From
Reserves
for
Unpaid
Claims
(3)
Unearned
Premiums
Earned
Premiums
Net
Claims and Claim
Adjustment
Expenses Incurred
Related to:
Amortization
of Deferred
Paid
Claims and
Claims and Net
Investme
nt
Income
Current
Year
Prior
Year
Acquisition
Costs
Adjustment
Expenses
Written
Premiums
2018 940 27,042 629 5,846 11,632 1,516 8,919 (443) 2,041 8,112 11,684
2017 938 27,139 626 5,751 11,286 1,611 7,610 (746) 2,002 7,213 11,393
2016 926 28,188 612 5,719 11,279 1,462 7,204 (763) 2,008 6,803 11,235
(1) Excludes accident and health insurance business.
(2) Consolidated property/casualty insurance operations.
(3) For a discussion of types of reserves discounted and discount rates used, see Item 1, Business, Discounting.
Regulation S-K contains the requirements for the nonfinancial statement portions of the 10-K
filing. In conjunction with the Securities Act Industry Guides, Guide 6: Disclosures Concerning
Unpaid Claims and Claim Adjustment Expenses of Property-Casualty Insurance Underwriters,
the following items are required to be disclosed:
• A tabular analysis of changes in aggregate reserves for unpaid claims and claim
adjustment expenses for each of the latest three one-year periods
• Method for estimating the effects of inflation, implicitly or explicitly
• A reconciliation between statutory and GAAP reserves for unpaid claims and claim
adjustment expenses, including an explanation of the key differences
• The amount of discount embedded in the GAAP reserves for unpaid claims, including
the pre-tax income effect of discount accrued and of discount amortized
The following in an example of the tabular analysis of changes in aggregate reserves.

FINANCIAL REPORTING THROUGH THE LENS OF A PROPERTY/CASUALTY ACTUARY
Part VI. Differences from Statutory to other Financial/Regulatory Reporting Frameworks in
the U.S.
336
TABLE 107
10
-
K
Notes to Consolidated Financial Statements
Fictional Insurance Company
Insurance Claim Reserves
Reconciliation of beginning and ending property casualty reserve balances for
claims and claim adjustment expenses
(USD in millions)
At and for the year ending December 31 2018 2017 2016
Claims and claim adjustment expense
reserves at beginning of year 27,139 28,188 29,026
Less reinsurance recoverables on unpaid
losses 5,941 6,629 7,272
Net reserves at beginning of year
21,198
21,559
21,755
Estimated claim
s and claim adjustment
expenses for claims arising in the current
year 8,919 7,610 7,204
Estimated decrease in claims and claim
adjustment expenses for claims arising
in prior years (443) (746) (763)
Total increases
8,476
6,864
6,441
Claims and cla
im adjustment expense
payments for claims arising in:
Current year
4,082
3,133
2,843
Prior years
4,030
4,080
3,959
Total payments
8,112
7,213
6,803
Unrealized foreign exchange (gain) loss
(14)
(13)
166
Net reserves at end of year
21,548
21,198
21,5
59
Plus reinsurance recoverables on unpaid
losses 5,494 5,941 6,629
Claims and claim adjustment expense
reserves at end of year 27,042 27,139 28,188
Table 107 shows for each of the last three years the beginning reserve from the prior year-
end, the provision for reserve development in the calendar year (ultimate incurred losses
from accidents occurring in the current year plus change in ultimate incurred losses on
accidents from prior fiscal periods), paid losses and the ending reserve. The beginning reserve
plus the provision for reserve development minus paid losses equals the ending reserve. If the
company makes an acquisition, this would be reflected in the beginning reserve balance.
Accounting Standards Update (ASU) 2015-09
In the early 2010s, the FASB explored a joint project with the International
Accounting Standards Board (IASB) to update insurance accounting. Due to a lack of
agreement between the Boards, the FASB decided instead to make targeted
improvements to the current accounting under U.S. GAAP. Meanwhile the IASB went
on to developing IFRS 17 (See Chapter 24).

FINANCIAL REPORTING THROUGH THE LENS OF A PROPERTY/CASUALTY ACTUARY
Part VI. Differences from Statutory to other Financial/Regulatory Reporting Frameworks in
the U.S.
337
The FASB initially proposed that short duration contract liabilities be discounted, to
allow investors the ability to understand the present value of the liabilities, but with
no adjustment for risk. Insurance companies and the analyst community provided
feedback indicating that any discount would immediately be unwound by analysts, to
be replaced with what they believe is the appropriate amount of discount. Instead the
analysts requested additional disclosures be developed to allow them more insight to
develop their own discount and to judge management’s ability to establish the
appropriate reserve estimates over time.
The resulting guidance that was issued in ASU 2015-09 added several new
disclosures to U.S. GAAP financial statements for short duration insurance contracts.
The key elements of ASU 2015-09 are as follows:
· The reserve roll-forward table required annually by the SEC (see Table 107)
was codified into U.S. GAAP and required quarterly for all U.S. GAAP financial
statements rather than just annually for SEC public filers.
· Accident year triangles of paid and ultimate loss and ALAE for up to 10 years
on a net of reinsurance basis. These triangles were required to be reconciled
in another schedule to the carried reserves.
· Current reported claim frequencies and current net loss and ALAE IBNR by
accident year on the same level of aggregation as the triangles.
· A description of the methodologies used to estimate the loss and ALAE IBNR.
· The average annual payout of ultimate incurred claims based on the paid
triangles and current ultimate incurred loss and ALAE.
· In the aggregate, a description of any significant changes in the methodology
used to estimate the IBNR or the reported claim frequencies.
These additional disclosures were required to be presented at a level such that
“useful information is not obscured by either the inclusion of a large amount of
insignificant detail or the aggregation of items that have significantly different
characteristics.” The exceptions to this requirement were the quarterly roll-forwards
and the description of significant changes in methodology, both of which are only
required in the aggregate.
While there are similarities to the triangles in Schedule P for some of these
disclosures, there are also important differences. Some of these differences include:
· These U.S. GAAP triangles require ALAE, not DCC. For example, this can drive
significant differences if claims are handled by external adjustors, whose costs
would fall under ALAE for U.S. GAAP as long as they can be allocated to a
specific claim, but A&O expense for SAP.

FINANCIAL REPORTING THROUGH THE LENS OF A PROPERTY/CASUALTY ACTUARY
Part VI. Differences from Statutory to other Financial/Regulatory Reporting Frameworks in
the U.S.
338
· The level of disclosure for the U.S. GAAP triangles is principle based, while
SAP has defined lines of business.
· Schedule P, even when presented for a group, only contains business written
through U.S. entities for an insurance group. The U.S. GAAP disclosures may
require business written globally, which can lead to significant foreign
currency exchange issues.
· Under U.S. GAAP, the IBNR and reported claim frequency are as of the
financial reporting date, and not in triangle form. The former limits the ability
for a user of the financial statements to obtain and use case incurred data.
The latter, while meant to help the user understand the severities in the
underlying business, ignores that incurred amounts for reported claims tend
to develop after being reported and claims reported later tend to have higher
severities. Therefore, care must be taken by users in interpreting these
disclosures.
The American Academy of Actuaries published a white paper on the considerations in
implementing ASU 2015-09 in December 2016. In developing the white paper, the
authors consulted with the AICPA’s insurance expert panel and the SEC. Therefore,
the reader is urged to read the white paper for further information.
https://www.actuary.org/sites/default/files/files/publications/FASB_SDC_Disclosures
_White_Paper_120916.pdf

FINANCIAL REPORTING THROUGH THE LENS OF A PROPERTY/CASUALTY ACTUARY
Part VI. Differences from Statutory to other Financial/Regulatory Reporting Frameworks in
the U.S.
339
CHAPTER 23. FAIR VALUE UNDER PURCHASE GAAP
When an entity agrees to buy another entity, under U.S. Generally Accepted Accounting
Principles (GAAP) the purchaser is required to state at fair value the assets and liabilities of
the purchased entity. This accounting for business combinations is often referred to as
Purchase GAAP (P-GAAP). As part of the P-GAAP process, certain intangible assets are
included that would not typically be recognized and measured under U.S. GAAP. After the fair
value of the assets and liabilities is determined, the implied capital (fair value assets minus
fair value liabilities) is compared to the purchase price. If the implied capital is less than the
purchase price of the purchased entity, the difference is defined to be goodwill and an asset
equivalent to that amount is established. If the implied capital is greater than the purchase
price of the purchased entity, the difference is immediately recognized as an operating gain
into income.
As actuaries we may become involved in the estimation of certain balance sheet items on a
fair value basis. In particular we may be asked to estimate the fair value of loss and LAE
reserves and to estimate the value of business in-force (VBIF).
FAIR VALUE OF LOSS AND LAE RESERVES
Fair value under U.S. GAAP is defined in Accounting Standards Codification (ASC) 820-10-05
as “the price at which an orderly transaction to sell the asset or to transfer the liability would
take place between market participants at the measurement date under current market
conditions.” Such a value could be obtained by a market quote if there were a deep and liquid
market for insurance liabilities. As there is no such market, the approach is “mark-to-model,”
which entails determining the market value through an estimation process rather than using
an observable market price. Recent actuarial literature supports an approach to estimating
fair value of insurance liabilities based on three components. These components are:
1. The expected value of the nominal future cash flows related to liabilities incurred, for
loss and LAE, as of the date of the transaction.
2. The reduction in those cash flows for the time value of money at a risk-free rate plus
an element for the illiquid nature of the liabilities. This discount rate is meant to reflect
the characteristics of the underlying liabilities.
3. A risk adjustment to compensate an investor for bearing the risk associated with the
liabilities. This is meant to reflect the expected net present value of profit that an
investor would demand in return for the risk inherent within the liabilities.
We will separately consider each in our example below, basing the expected value of the cash
flows on what we deem to be a reasonable estimate of unpaid claims as of the sale date and
the associated future payout pattern (first component), and the current risk-free rate
matched to the duration of those liabilities plus an adjustment for illiquidity (second

FINANCIAL REPORTING THROUGH THE LENS OF A PROPERTY/CASUALTY ACTUARY
Part VI. Differences from Statutory to other Financial/Regulatory Reporting Frameworks in
the U.S.
340
component). For the third component of fair value, the risk adjustment, we use what is
commonly referred to as the “cost of capital approach.” This approach estimates the amount
of capital required to support the reserves at each future evaluation date. The required return
on a pretax basis in excess of the risk-free rate plus illiquidity adjustment is applied to this
amount to calculate the value of the excess return expected by the investor in that future
period. These values are in turn discounted to present value. The sum of the present value of
excess returns from each future period is considered the risk margin.
The first component, expected nominal cash flows, can be derived from the current recorded
reserve if management’s best estimate is indeed an expected value that has no obvious
inherent bias. There are two common ways to establish the cash flows by line of business
from the nominal reserves. The first is to use the payout pattern based on the loss reserve
development that the actuary would have selected in the course of his or her review of the
reasonableness of management’s recorded reserve. The second approach is to utilize the
implied pattern based on the ratios of paid loss to ultimate loss by accident year. This latter
approach may require more smoothing depending on the methods used in selecting ultimate
losses and the stability, yet decreasing values, of incurred but not reported (IBNR) to case
reserve ratios.
The second component is the amount of discount. Once the cash flows are estimated, the
discounting calculation is fairly straightforward provided the rate is given. Given the third
component is an explicit risk margin, the interest rate should reflect only the characteristics
of the liability not related to the underlying risk in the outcomes for the purchasing entity.
This is effectively the risk-free rate plus an element for the illiquidity of the liability, typically
less than 100 basis points.
The risk-free rates are typically observed by referencing the U.S. Treasury Daily Yield Curve
for the evaluation date of study, for liabilities settled in U.S. dollars. The liquidity/illiquidity
premium (the terms “liquidity” and “illiquidity” are used interchangeably) is not readily
available or typically understood. The need for an illiquidity premium is much easier to initially
comprehend when considered from an asset perspective. Two assets with identical expected
cash flows and no difference in the risk associated with those cash flows would be expected to
be valued the same. But what if one was publicly listed and readily tradable, while the other is
privately held? In this situation the ability to readily trade the asset would result in a lower
discount rate being applied to the tradable asset’s future cash flows than that of the privately
held asset. The difference in the discount rates is the illiquidity premium for the privately held
asset.
From a liability perspective, many find it hard to fathom why a liability that is less liquid
should be lower in value than a liability that is liquid. It is easier to understand by considering
the asset transferred to support the liability by the seller. The less liquid the liability is, the
greater the opportunity for the purchaser of the liability to utilize the asset for their own gain
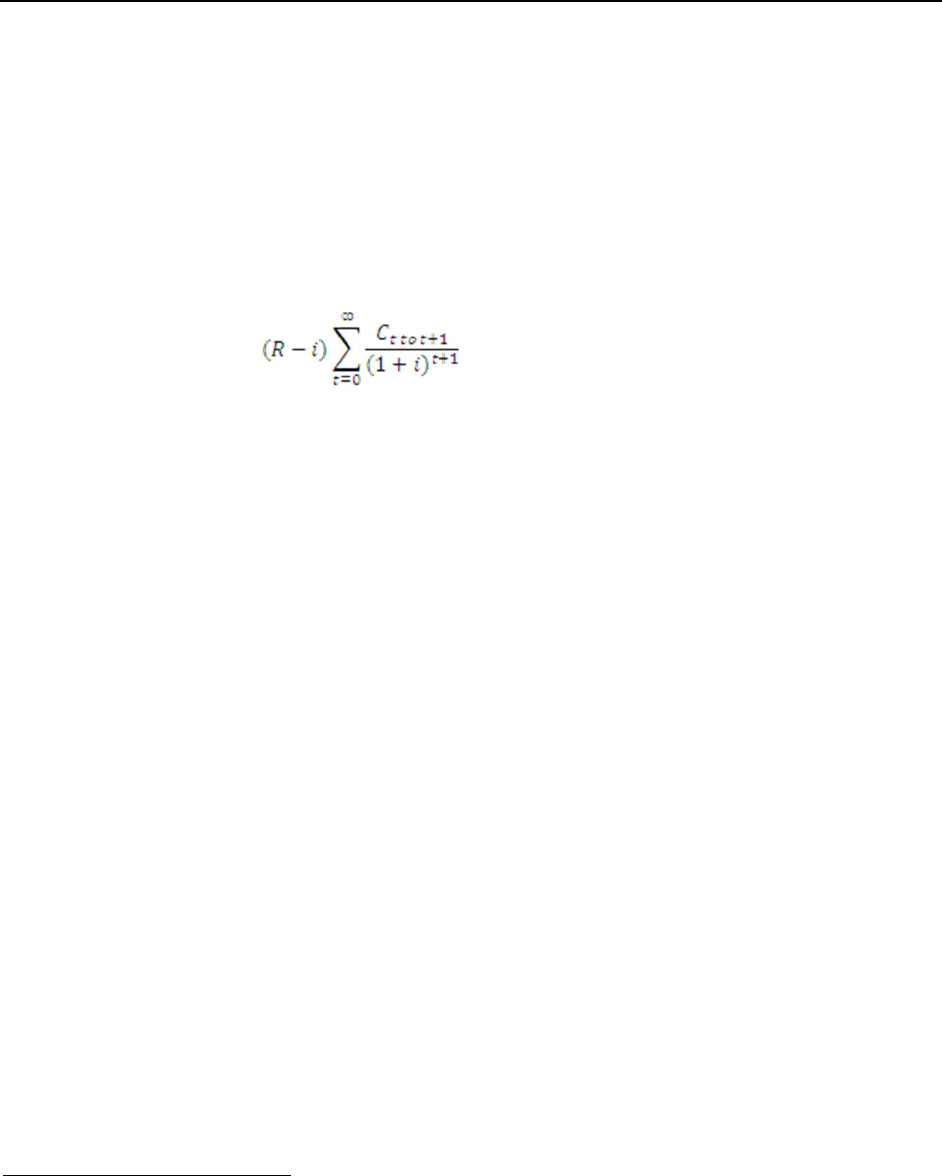
FINANCIAL REPORTING THROUGH THE LENS OF A PROPERTY/CASUALTY ACTUARY
Part VI. Differences from Statutory to other Financial/Regulatory Reporting Frameworks in
the U.S.
341
until the liability comes due. This opportunity cost results in a greater discount for the seller
of the liability, i.e., a higher discount rate. How to derive the illiquidity premium is an active
debate at the time of writing and beyond the scope of this study material.
The third and final component of the fair value of the loss reserves is the risk adjustment. The
most logical approach to calculating a risk adjustment for an estimate that is meant to
represent a market-based valuation is a cost of capital. The cost of capital approach is simply
the present value of the future returns on capital that an investor would require for bearing
the risk in the expected cash flows. The basic formula for the risk adjustment is:
Risk adjustment =
Where:
• R = pretax required return on capital by the capital provider
• i = risk-free rate of return plus an illiquidity premium
• t = time
• C
t to t+1
= average capital carried over time t and t+1 to support the liability
The pretax required return can be approximated from the post-tax weighted average cost of
capital that is typically produced by valuation experts performing the P-GAAP work on other
intangible assets. The capital at any time t could be derived from using a suitable benchmark
of the required capital for a hypothetical market participant based on Risk-Based Capital,
S&P’s capital model or Best’s Capital Adequacy Ratio model.
As an example, we shall calculate the fair value of the loss and loss adjustment expense (LAE)
reserves for the homeowners/farmowners line of business from Fictitious’ Annual Statement.
In performing the calculation, we have assumed the following:
• The recorded reserve of $1.457 million is a mean estimate of the expected future cash
flows, i.e., no margin is present in management’s best estimate.
• The appropriate payout pattern of the loss reserves, with some slight smoothing, can
be derived from the ultimates in each accident year divided by the paid losses in each
accident year
201
.
• The discount rates are the U.S. Treasury yield curve as of the valuation date plus an
adjustment of 35 basis points for the illiquidity premium.
• The payments are made halfway through each future period.
201
Note the term “payout pattern” is used interchangeably by actuaries as either the ratio of paid losses to
ultimate loss (“percent paid”) or the ratio of ultimate loss to paid loss (which is equivalent to a paid age-to-
ultimate factor).

FINANCIAL REPORTING THROUGH THE LENS OF A PROPERTY/CASUALTY ACTUARY
Part VI. Differences from Statutory to other Financial/Regulatory Reporting Frameworks in
the U.S.
342
• The required capital ratio is 20.1% of the unpaid claim estimates in each future period
and is applied to the average amount outstanding over the period to estimate the
required capital.
• The cost of capital is 10%, which is reduced by the discount rate associated with the
average duration of capital to derive the risk cost of capital of 9.7%, (R-i) in the above
formula.
• The return on capital is paid at the end of each future period.

FINANCIAL REPORTING THROUGH THE LENS OF A PROPERTY/CASUALTY ACTUARY
Part VI. Differences from Statutory to other Financial/Regulatory Reporting Frameworks in
the U.S.
343
TABLE 108
Fictitious
Insurance Company
Homeowners/Farmowners
Fair Value of Loss and LAE Reserves — Net
As of December 31, 2018
(U.S.D in 000s)
Anticipated Loss Payments By Payment Period
Total
2019
2020
2021
2022
2023
2024
2025
2026
2027
2028
Payments in Period
(1)
1,457
879
261
104
112
38
27
7
8
9
11
Payment Duration
(2)
0.5
1.5
2.5
3.5
4.5
5.5
6.5
7.5
8.5
9.5
Discount Rate
(3)
0.095%
0.210%
0.336%
0.481%
0.711%
0.973%
1.231%
1.463%
1.633%
1.822%
PV of Payment
(4)
1,446
878
260
104
110
37
25
7
7
8
10
Undiscounted Future
Payments
(5)
1,457
578
317
213
101
62
36
29
21
11
Required Capital
Ratio
(6)
0.201
0.201
0.201
0.201
0.201
0.201
0.201
0.201
0.201
0.201
Average Required
Capital
(7)
205
90
53
32
16
10
7
5
3
1
Risk Cost of Capital
(8)
0.097
0.097
0.097
0.097
0.097
0.097
0.097
0.097
0.097
0.097
Cost of Capital in
Period
(9)
20
9
5
3
2
1
1
0
0
0
Duration
(10)
1
2
3
4
5
6
7
8
9
10
Discount Rate
(11)
0.155%
0.285%
0.395%
0.585%
0.865%
1.095%
1.385%
1.546%
1.725%
1.925%
Associated Risk
Margin
(12)
40
20
9
5
3
2
1
1
0
0
0
Total Fair Value
Reserve
(13)
1,486
(1)
Determined from reserve and payout pattern
(2)
Payments assumed to occur on
average halfway through the period
(3)
From yield curve
(4)
= (1) / [1 + (3)] ^ (2)
(5)
Sum of remaining amounts from (1)
(6)
Selected
(7)
= Average of (5) from t and t+1 x (6)
(8)
Selected
(9)
= (7) x (8)
(10)
Capital is assumed to be held until the end of the period
(11)
From yield curve
(12)
= (9) / [1 + (11)] ^ (10)
(13)
= Total (4) + Total (12)
The resulting fair value for this line of business differs only slightly from the recorded reserve
and is likely within the bounds of the level of accuracy for determining a reasonable reserve
estimate. However, this is due to several factors, some of which are offsetting. The discount
is minimal in this case due to the relatively short payout pattern of the line of business and
the low level of interest rates on U.S. treasuries as of December 31, 2018.
The shorter payout pattern also affects how long you need to hold the capital. The less time
the capital is held, the lower the future capital charges that can accumulate. In addition, in
this case the line of business is not one that is associated with a large degree of reserve
variability. Therefore, the required capital ratio is fairly small, which decreases the absolute
return that a third party would demand to acquire the liability. Finally, working in the opposite

FINANCIAL REPORTING THROUGH THE LENS OF A PROPERTY/CASUALTY ACTUARY
Part VI. Differences from Statutory to other Financial/Regulatory Reporting Frameworks in
the U.S.
344
direction, there is the effect of discount rates on the risk margin. The low discount rates
effectively increase the risk margin as the present value of the future returns on capital is
higher.
In this example, you can see that the fair value of a liability can be affected by many moving
pieces that can require an actuary to dig into the calculation to be able to explain differences
between lines of business or between evaluation dates.
Not all believe that cost of capital is the right approach to producing a risk adjustment.
Australian Prudential Regulation Authority requires reserves to be recorded at or about the
75
th
percentile of the discounted distribution of outcomes. In Canada, property/casualty
actuaries judgmentally select the risk adjustment for loss reserves as a percentage value up
to 20%. In addition, one could use a tail value at risk (T-VaR) approach. While the cost of
capital can be calibrated to the pre-tax return investors require and the amounts of capital
typically held for a risk, these other methods lack any calibration to the market. This makes it
difficult to assert that the assumption of a certain confidence level, T-VaR or percentage load
is required by a market participant in an arm’s-length transaction.
VALUE OF IN-FORCE
Under P-GAAP, the fair value of deferred acquisition costs (DAC) is zero, given its lack of
ability to generate future cashflows. In its place an asset is established based on the VBIF.
This is not, as some companies assume, equivalent to the DAC asset. The VBIF is affected by
the relationship of discount to risk adjustment on the liabilities expected to be incurred in
connection with the unearned premium reserves, the amount of acquisition costs that were
covered by the premium but previously expensed, and the estimated profitability of the
unearned premium reserves. A shortcut technique to calculating the VBIF is to state at fair
value the liabilities expected to be incurred in connection with the unearned premium
reserves and subtract them from the unearned premium to obtain the implied VBIF. The steps
to obtain a fair value of these liabilities are identical to those in obtaining the fair value of the
loss reserves but with some additional steps. The expected and unbiased loss ratio is required
to estimate the nominal expected liabilities from the unearned premium, and the cash flows in
the first year should include an amount for policy maintenance costs. Consideration should
also be given to the additional risk, event risk, present during the coverage period which can
be reflected with a higher capital charge during that period if using a cost of capital approach
to estimate a risk adjustment.

FINANCIAL REPORTING THROUGH THE LENS OF A PROPERTY/CASUALTY ACTUARY
Part VI. Differences from Statutory to other Financial/Regulatory Reporting Frameworks in
the U.S.
345
CHAPTER 24. INTERNATIONAL FINANCIAL REPORTING STANDARDS
International Financial Reporting Standards (IFRS) is a single set of global financial reporting
standards issued by the International Accounting Standards Board (IASB). It was developed in
the public interest as a high-quality set of general purpose standards that will provide users
across borders and industries with transparent and comparable information. That is, they
provide the world’s integrated capital markets with a common language for financial
reporting.
Most of the world’s major economies permit or require the use of IFRS. The European Union,
Canada, Hong Kong, and Australia are among the economies that use IFRS. At the time of
writing, the Securities and Exchange Commission (SEC) in the U.S. does not allow domestic
issuers of financial statements the ability to file using IFRS rather than U.S. Generally
Accepted Accounting Principles (GAAP), but it currently permits foreign issuers to do so
without reconciliation to U.S. GAAP.
In 2005, the IASB realized it was unable to issue a new standard for insurance contracts
before IFRS was due to be implemented in the European Union. Consequently, under time
constraints, the IASB issued an interim standard known as IFRS 4. IFRS 4 allowed entities to
use a wide variety of accounting practices for insurance contracts, reflecting national
accounting requirements and variations within the respective requirements. For instance,
companies were allowed to continue to use their local GAAP but with minimum rules around
that practice. However, the standard did not adequately reflect the true underlying financial
position or performance of the insurance contracts as the contracts:
• Are accounted for differently across jurisdictions as national accounting requirements
were allowed to be adopted;
• Often cover difficult-to-measure long term and complex risks, with uncertain
outcomes;
• Are not typically traded in the market;
• May include a significant investment or deposit component – the amount that the
insurer is liable to pay the policyholder regardless of whether the insured event
occurs.
To address the issues above, in May 2017, the IASB issued IFRS 17 which was initially set to
be effective on or after January 1, 2021, superseding IFRS 4. However, in 2018, the IASB
voted to defer its effective date to January 1, 2022.
IFRS 17 establishes principles for the recognition, measurement, presentation and disclosure
of insurance contracts. The objective is to:
a) Improve comparability between insurers

FINANCIAL REPORTING THROUGH THE LENS OF A PROPERTY/CASUALTY ACTUARY
Part VI. Differences from Statutory to other Financial/Regulatory Reporting Frameworks in
the U.S.
346
- Harmonization of insurance practices across jurisdictions
- New accounting framework to replace the various accounting treatments
b) Improve quality of financial information
- Inclusion of useful information in the financial statements
- Increase transparency on insurers’ profitability.
SCOPE
IFRS 17 applies to contracts that are insurance contracts issued, reinsurance contracts held,
and investment contracts with discretionary participation features. Similar to IFRS 4, it does
not apply to insurance contracts in which the company is the policyholder, with the exception
that the contracts are reinsurance contracts.
The new standard retains the IFRS 4 definition of an insurance and reinsurance
contract, which is “a contract under which one party (the insurer) accepts significant
insurance risk from another party (the policyholder) by agreeing to compensate the
policyholder if a specified uncertain future event (the insured event) adversely affects
the policyholder.”
LEVEL OF AGGREGATION
IFRS 17 provides a consistent framework for accounting for all insurance contracts issued. A
company applies the requirements of IFRS 17 to a group of insurance contracts rather than
on a contract-by-contract basis. In grouping insurance contracts, a company is required to
identify portfolios of contracts and divide each portfolio into:
a) A group of contracts that are onerous at initial recognition;
b) A group of contracts, at initial recognition, that have no significant
possibility of becoming onerous subsequently; and
c) A group of remaining contracts
Contracts issued more than one year apart can’t be grouped into the same group.
MEASUREMENT MODEL
The standard introduced a new measurement model referred to as the General Model with the
measurement objective of fulfillment value for insurance contracts. Two variants of the
General Model were also defined by the standard, the Premium Allocation Approach (“PAA”)
and the Variable Fee Approach (“VFA”).

FINANCIAL REPORTING THROUGH THE LENS OF A PROPERTY/CASUALTY ACTUARY
Part VI. Differences from Statutory to other Financial/Regulatory Reporting Frameworks in
the U.S.
347
General Model
The General Model is the default model in IFRS 17. Under this model, insurance contracts are
to be reported on the balance sheet as the total of:
a) Fulfillment cash flows – the current estimate of amounts that the
insurer expects to collect from premiums and pay out for claims, benefits
and expenses, including an adjustment for the timing and risk of those
cash flows; and
b) Contractual service margin (“CSM”) – the expected profit for providing
future insurance coverage (i.e., unearned profit).
The fulfillment cash flows consist of the present value of future cash flows and a provision for
risk adjustment. The risk adjustment component represents compensation that an insurer
requires for bearing the uncertainty about the amount and timing of the cash flows that arise
as it fulfills the insurance contract.
Upon initial recognition, the CSM is defined as the net difference between the fulfillment cash
inflows and outflows, floored by zero. The CSM cannot be negative. If it is negative upon
inception, the expected losses are to be recognized in the income statement immediately. The
purpose of recognizing a positive initial CSM is to report expected profitability arising from
the contract over time, reflecting the service to be provided.
The standard requires companies to update the fulfillment cash flows at each reporting date,
using current estimates that are consistent with relevant market information. For instance,
companies are to use current discount rates to measure insurance contracts. Using current
discount rates, as opposed to historical rates (i.e., discount rates during contract inception)
or a mix of rates, will reflect the characteristics of the cash flows arising from the insurance
contract liabilities in a consistent manner across all companies. As such, changes in insurance
obligations due to economic factors, i.e., interest rates, will be reflected in the financial
statements in a timely way.
Premium allocation approach
The PAA is a simplification of the General Model. It is an option that insurers can elect to
implement if the model is expected to produce results that would not differ materially from
the General Model and if it doesn’t contain any complex features. There is a safe harbor for
contracts that have a coverage period of twelve months or less. Other contracts can be tested
to allow them to use the PAA over the General Model.
The PAA splits the measurement of groups of insurance contracts into two pieces where
needed, the liability for remaining coverage and the liability for incurred claims. The liability

FINANCIAL REPORTING THROUGH THE LENS OF A PROPERTY/CASUALTY ACTUARY
Part VI. Differences from Statutory to other Financial/Regulatory Reporting Frameworks in
the U.S.
348
for remaining coverage is approximately equal to the unearned premium less any premium
receivable and deferred acquisition costs.
The liability for incurred claims is measured using the fulfilment cashflows from the General
Model. No CSM is required for this portion of the liability as the coverage from the contract
has expired for this portion of the liability.
Variable Fee Approach
The VFA is based on the General Model but with additional features to account for contracts
with direct participating features.
Overall, IFRS 17 and its basis for conclusions published by the IASB total 240 pages. It covers
in-depth topics such as what is considered an insurance contract and therefore needs to be
accounted for under the standard, the boundaries of such contracts, more specifics around
the building blocks (fulfilment cashflows and CSM), the option to lock-in discount rates to
avoid income statement volatility from mismatched accounting of assets, recognition of
revenue, and required disclosures.
At the time of writing of this text, significant amounts of accounting and actuarial literature
have been published on how to implement this complex standard. No doubt much more will be
written in the coming years as the implementation date is reached. Those interested in
reading more should first look to International Actuarial Note 100 that will be published by
the International Actuarial Association during 2020.
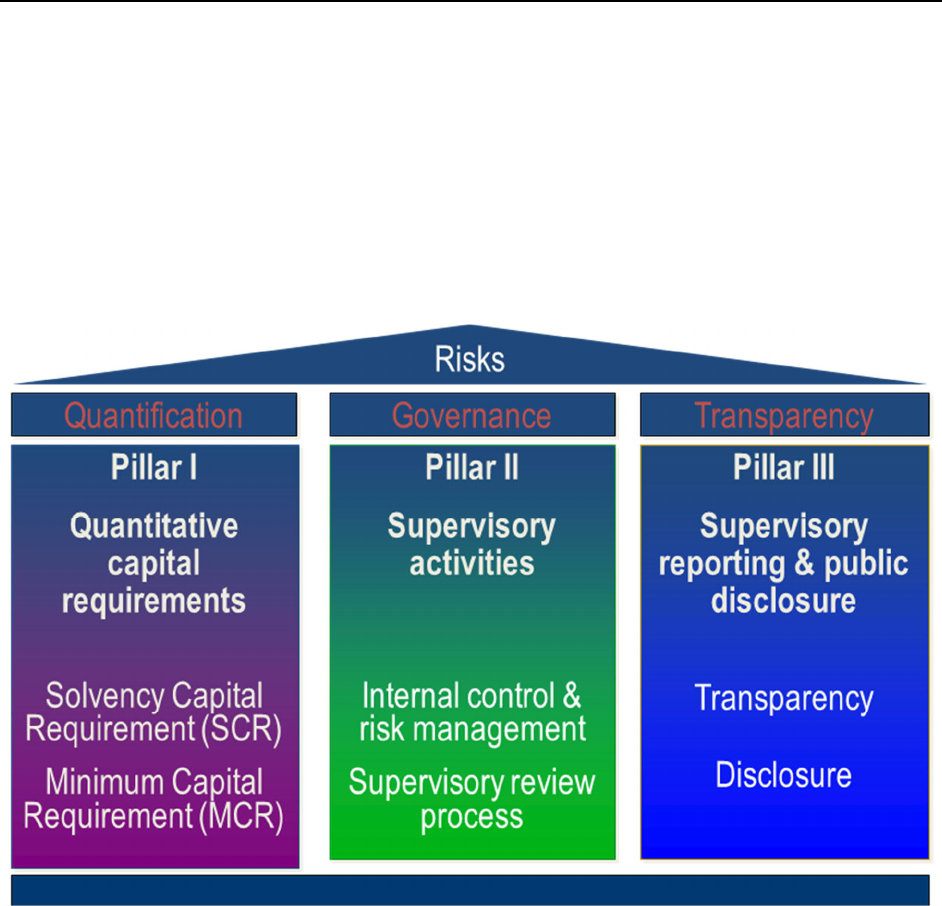
FINANCIAL REPORTING THROUGH THE LENS OF A PROPERTY/CASUALTY ACTUARY
Part VI. Differences from Statutory to other Financial/Regulatory Reporting Frameworks in
the U.S.
349
CHAPTER 25. SOLVENCY II
Solvency II is a principle-based insurance regulatory system governing how insurance
companies are funded in the European Union. It links the required capital of insurance
companies to their risk profile.
Solvency II came into effect on January 1, 2016. The new system is based on three pillars
similar to those of Basel II. Those pillars are quantification, governance, and transparency.
PILLAR I — QUANTITATIVE CAPITAL REQUIREMENTS
Pillar I is focused on the quantitative aspect of Solvency II to obtain the solvency capital
requirement (SCR) and minimum capital requirement (MCR). It also harmonized standards for
the valuation of assets and liabilities. The measurement approach is summarized in the
following diagram and is often referred to as the total balance sheet approach.
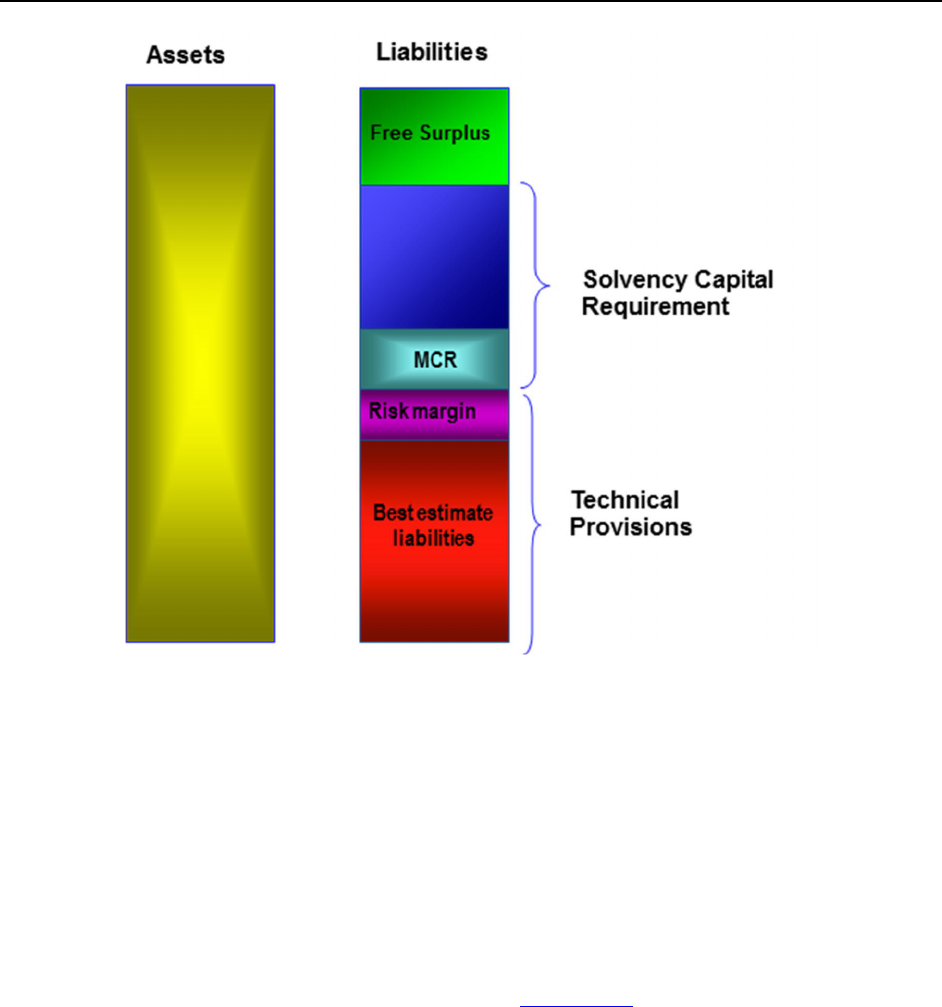
FINANCIAL REPORTING THROUGH THE LENS OF A PROPERTY/CASUALTY ACTUARY
Part VI. Differences from Statutory to other Financial/Regulatory Reporting Frameworks in
the U.S.
350
On the asset side of the balance sheet, non-insurance assets are recorded using the
measurement approach under International Financial Reporting Standards (IFRS).
Reinsurance assets are measured in the same way as insurance liabilities. On the liability side
of the balance sheet, the technical provisions consist of the discounted best estimate of the
liabilities and their associated risk margin. These are meant to represent the fair market value
of the insurance liabilities, and although principles based, the approach to calculating them is
fairly prescriptive. The best estimate of the liabilities is the expected value of the cash flows
discounted using a risk-free rate; adjustments such as matching adjustment for illiquidity are
available for long term liabilities. The risk-free discount rates are published by the European
regulator on a monthly basis. The risk margin is calculated using a cost of capital method with
the cost of capital above the risk-free rate (R-i from Chapter 23) equal to 6%.
Under Pillar 1 there are two capital requirements defined which are the Solvency Capital
Requirement (SCR) and the Minimum Capital Requirement (MCR). The SCR and MCR are
capital requirements that must be held in addition to the best estimate liabilities. SCR is the
capital that should be held to ensure that the insurance company can meet its obligations to
policyholders and beneficiaries with certain probability and should be set to a confidence level
of 99.5% over a 12-month period i.e., a one-year 99.5% Value at Risk (VaR). A company
whose capital falls below the SCR will be subject to regulatory intervention. If it falls even

FINANCIAL REPORTING THROUGH THE LENS OF A PROPERTY/CASUALTY ACTUARY
Part VI. Differences from Statutory to other Financial/Regulatory Reporting Frameworks in
the U.S.
351
further below the MCR, the company will lose its license and will not be permitted to operate.
Critics have noted that the one-year 99.5% VaR is not an adequate measure for bearing the
risk to ultimate settlement. Solvency II requires consideration of recapitalization based on
adverse development in each future annual period, yet doesn’t assume you need to hold
sufficient capital from inception to settlement without raising capital. Therefore, critics of
Solvency II believe using one-year 99.5% VaR as the capital standard in the risk margin
calculation does not provide a true fair market value.
The SCR can be calculated using the standard model, an approved internal model or a mix of
both. To obtain approval for an internal model, the company has to demonstrate that the
model is used in running the business, has been validated by an independent third party and is
documented appropriately. The benefits of using an internal model are a model which is more
appropriately tailored to the risk profile of the insurance company and the likely outcome of a
lower SCR.
Any remaining amount between the assets minus the technical provisions and SCR is
considered free surplus.
PILLAR II — SUPERVISORY ACTIVITIES
Pillar II provides insurance supervisors with the tools required to identify high-risk companies
and the power to intervene. First, this pillar requires companies to have the governance
structure in place to address the following key areas:

FINANCIAL REPORTING THROUGH THE LENS OF A PROPERTY/CASUALTY ACTUARY
Part VI. Differences from Statutory to other Financial/Regulatory Reporting Frameworks in
the U.S.
352
The functional areas, while each satisfying the conditions, should be allocated responsibility in
a manner that avoids duplication. Each one is viewed as essential for an insurance business to
operate effectively. Key responsibilities of each function include:
· Internal audit: Produce a report at least annually to the board of directors on any
deficiencies of the internal controls and any shortcomings in compliance with internal
policies and procedures. This function should have unrestricted access to information
and staff.
· Actuarial: Ensure the reasonability of methods and assumptions used in calculating the
technical provisions and providing a look-back analysis of best estimates against
experience. Also, provide opinions on the overall underwriting policy and adequacy of
reinsurance arrangements.
· Risk management: Monitoring the risk management function and maintaining an
aggregated view. Ensure the integration of any internal model with the risk
management function.
· Compliance: Ensure the internal control system is effective to comply with all
applicable laws and regulation, promptly reporting any major compliance issues to the
board of directors.
Pillar II also requires that companies complete an own risk self-assessment (ORSA). The ORSA
has been defined by the European Insurance and Occupational Pensions Authority (EIOPA) as:
“The entirety of the processes and procedures employed to identify, assess, monitor,
manage, and report the short- and long-term risks a (re) insurance undertaking faces or may
face and to determine the own funds necessary to ensure that the undertaking’s overall
solvency needs are met at all times.”
An ORSA should contain at a minimum the following:
• The overall solvency needs, taking into account the specific risk profile, approved
risk tolerance limits and the business strategy of the undertaking
• The compliance with the capital requirements and the requirements regarding
technical provisions
• The extent to which the risk profile of the undertaking deviates significantly from
the assumptions underlying the SCR, calculated with the standard formula or with
its partial or full internal model
The ORSA results will periodically be reported to the supervisor who will use the results as
input for their risk-based supervision and actions. The ORSA will also be the basis for the
dialogue between the insurer and the supervisor regarding important decisions made by the
insurer.

FINANCIAL REPORTING THROUGH THE LENS OF A PROPERTY/CASUALTY ACTUARY
Part VI. Differences from Statutory to other Financial/Regulatory Reporting Frameworks in
the U.S.
353
In the case of significant deviations from the risk profile, the ORSA will be the starting point of
the supervisor’s process that could lead to a capital add-on (i.e., an increase in the SCR).
PILLAR III — TRANSPARENCY
Pillar III represents the disclosure and reporting of information about a company’s capital and
regulatory position collected from Pillars I and II to the supervisors and the financial markets.
Some items will be reported quarterly and others annually. The purpose of public disclosure of
a company’s financial and solvency position is to increase market discipline because
companies are aware that their risk-based decisions will be in the public and supervisory
domains.
COMPARISON TO THE U.S. SOLVENCY REGIME
Solvency II was developed as a group wide solvency regime. The U.S. regime, being state-
based, is focused on the regulation of individual statutory entities with capital “walled” off
from other entities in the group. However, pressure stemming from the financial crisis in
2008 combined with closer coordination between international insurance regulators led to
the NAIC’s Solvency Modernization Initiative (“SMI”).
The SMI developed a “Windows and Walls” approach, giving windows for state insurance
regulators to look into group wide operations and the effect those operations might have on a
statutory entity, while maintaining the walls at the statutory legal entity level. Those windows
that developed out of the SMI were:
1.Communication between regulators – enhanced communications between the state
insurance regulators within the group
2. Supervisory Colleges – formally incorporate supervisory colleges of international
regulators into the NAIC review procedures
3. Access to and collection of information – enhanced access to upstream entities
within a group structure including regulated and non-regulated entities
4. Enforcement measures – tools to protect policyholders if violations occur
5. Group capital assessments –group supervision requires a panoramic view of capital
needs of the group to be effective
6. Accreditation – state insurance regulators involved in group supervision should be
accredited through the NAIC
The regulatory tool developed to implement several of these windows was the U.S. Own Risk
and Solvency Assessment (“ORSA”) requirement. The NAIC defines the ORSA as “an internal

FINANCIAL REPORTING THROUGH THE LENS OF A PROPERTY/CASUALTY ACTUARY
Part VI. Differences from Statutory to other Financial/Regulatory Reporting Frameworks in
the U.S.
354
assessment … conducted by [the] insurer of the material and relevant risks identified by the
insurer associated with an insurer’s current business plan and the sufficiency of capital
resources to support those risks.”
The NAIC has stipulated two primary goals for the ORSA:
1. To foster an effective level of Enterprise Risk Management (ERM) at all insurance
companies through which each insurance company identifies, assesses, monitors, prioritizes
and reports on its material and relevant risks, using techniques that are appropriate to the
nature, scale and complexity of the insurer’s risks, in a manner that is adequate to support
risk and capital decisions
2. To provide a group-level perspective on risk and capital, as a supplement to the existing
legal entity view
In order to meet these goals, an insurer that is a member of an insurance holding company
system (as defined by state insurance law) and meets certain benchmarks for direct written
and unaffiliated assumed premium is required to complete the ORSA process at least annually
and create an ORSA Summary Report to be provided to its lead state commissioner and, upon
request, to its domiciliary state commissioner. Additionally, the insurer must retain
documentation and supporting risk management material to evidence the efficacy of its ORSA
process, as these may be requested for review by the insurer’s state commissioner(s).
The ORSA process is intended to be just one element of an insurer’s overall ERM framework,
in which the insurer assesses and summarizes the other elements of the framework, as well as
linking these to the insurer’s overall organizational structure, business strategy and capital
management/planning process. Accordingly, the NAIC expects that the depth and detail of
the ORSA and the ORSA Summary Report should reflect the nature of the size and complexity
of insurer and its ERM framework. To assist state commissioners in gaining a high-level
understanding of an insurer’s ORSA, the NAIC has established three key areas that the ORSA
Summary Report should cover:
Section 1: Description of the Insurer’s Risk Management Framework
This section provides a summary of the insurer’s ERM framework, covering how the
insurer has integrated the following key principles into the organization: risk culture and
governance; risk identification and prioritization process; risk appetite and
tolerances/limits; risk management and controls; and risk reporting and communication.
In summary, it brings together how the insurer identifies and categorizes its material risks
and how it assesses, monitors and manages those risks against its established risk
tolerances as it executes its business strategy.
Section 2: Insurer’s Assessment of Risk Exposure

FINANCIAL REPORTING THROUGH THE LENS OF A PROPERTY/CASUALTY ACTUARY
Part VI. Differences from Statutory to other Financial/Regulatory Reporting Frameworks in
the U.S.
355
This section provides a high-level summary of the current quantitative and/or qualitative
assessments of the insurer’s risk exposure in both normal and stressed environments for
each material risk category identified in Section 1. In addition to providing detailed
descriptions and explanations of the risks identified by the insurer, the insurer describes
the assessment methodology used and key assumptions made to evaluate the current risk
level and how this compares to the relevant risk tolerances/limits for the risk under both
normal and stressed conditions. For P&C insurers, relevant material risk categories
typically include insurance risk (often divided into underwriting/premium risk, reserve risk
and catastrophe risk), market risk, credit risk, liquidity risk, operational risk, and strategic
risk.
Section 3: Group Assessment of Risk Capital and Prospective Solvency Assessment
This section provides a summary of the insurer’s process for assessing capital adequacy in
relation to its risk profile and how this process is integrated into the insurer’s
management and decision-making culture. For the Group Assessment of Risk Capital, the
insurer describes its approach for assessing its group capital adequacy, including the basis
of its definition of solvency, accounting/valuation basis, and the key methodologies,
assumptions and considerations used in calculating available capital and risk capital
required. For the Prospective Solvency Assessment, the insurer projects its future
financial position, including its projected economic and regulatory capital to assess its
ability to meet its internally defined risk appetite and its regulatory capital requirements
based on the insurer’s multi-year (typically three to five years) business plan. The
Prospective Solvency Assessment is also completed under both normal and stressed
environments.
Further detail on the requirements for completing an ORSA process and the details that are
expected to be covered within each section of an insurer’s ORSA Summary Report can be
found in the NAIC’s Own Risk and Solvency Assessment (ORSA) Guidance Manual
202
.
Depending on their role within an insurer, actuaries may become involved in the ORSA
process in several ways.
Due to the significant role they play in establishing and executing the insurer’s ERM
framework and policies, identifying and monitoring its key risks, and assisting senior
leadership in overall risk and capital management, an actuary that serves as the insurer’s
Chief Risk Officer and actuaries that are members of its ERM function typically have
ownership of the overall drafting of the ORSA Summary Report, particularly where these
elements are covered within Section 1. Additionally, actuaries within the ERM function are
frequently involved with the estimation and monitoring of the insurer’s risk exposure in
202
https://www.naic.org/documents/prod_serv_fin_recievership_ORSA-2014.pdf

FINANCIAL REPORTING THROUGH THE LENS OF A PROPERTY/CASUALTY ACTUARY
Part VI. Differences from Statutory to other Financial/Regulatory Reporting Frameworks in
the U.S.
356
relation to its risk tolerances for the material risks identified in Section 2, as well as the
modelling of the group’s risk capital adequacy and prospective solvency assessment detailed
in Section 3.
Actuaries working within an insurer’s pricing or reserving functions assist the ERM team in the
risk identification and assessment/estimation process for the insurer’s material insurance
risks and may contribute to drafting sections of the ORSA Summary Report related to their
risk area.
The models utilized by the insurer to estimate its material risk exposures, group risk capital
and prospective solvency position are typically validated by another qualified actuary that
was not involved in their development, which sometimes results in the involvement of a third-
party party actuarial consulting firm.
Finally, actuaries assisting in the regulatory examination and financial analysis review of an
insurance company may review the ORSA Summary Report to better understand the material
risks the insurer is facing, its current and projected capital adequacy, and the strength of the
insurer’s risk management program.

FINANCIAL REPORTING THROUGH THE LENS OF A PROPERTY/CASUALTY ACTUARY
Part VI. Differences from Statutory to other Financial/Regulatory Reporting Frameworks in
the U.S.
357
CHAPTER 26. TAXATION IN THE U.S.
Beyond the solvency and general-purpose financial reporting frameworks, taxation is another
framework applicable to insurance companies. Taxation has many forms, including the direct
taxation of the income of corporations. Generally, tax is imposed on net profits from business,
net gains, and other income. The income subject to taxation is determined under accounting
principles that are modified or replaced by tax law principles where a different basis is
determined as necessary by the relevant taxing authorities. In the U.S., an insurance
company is taxed based on its statutory income, but with adjustments provided by the
Internal Revenue Code (“IRC”) that will be described herein.
Understanding the impact of federal taxation is important for insurance contract pricing,
insurance company valuation, capital models construction, and tax returns preparation.
Additionally, when there are changes to the tax law, it is important to understand the changes
that occurred and the potential impact. In 2017, the Tax Cuts and Jobs Act of 2017
(“TCJA”), which became effective beginning tax year 2018, changed key federal tax rules.
The changes most significant to property/casualty insurance carriers were related to the
corporate tax rate, the discounting rules, and the international tax system.
In this chapter, we will present a summary of how taxable income is derived for
property/casualty insurance companies from their statutory accounts, including a review of
the adjustment of loss reserves for discounting. We will also review the process for
determining taxable income attributable to statutory underwriting income and to investment
income. Statutory underwriting income consists of premium revenue (i.e., earned premiums)
minus losses and expenses incurred.
TAX BASIS EARNED PREMIUMS
On a tax basis, earned premiums are adjusted for “revenue offset”. The need for the revenue
offset stems from a lack of a deferred acquisition cost asset under statutory accounting.
Assume that today a company wrote a policy effective January 1 of the following year for
$100 but incurred $20 in acquisition costs. Under statutory accounting, the company would
incur a $20 loss from establishing an unearned premium reserve of $100 and payment of
$20 in acquisition costs. Rather than allowing property/casualty insurance companies to
claim a tax credit on that “loss” under statutory accounting, the IRC has established a
revenue offset convention, often referred to as the “20% haircut” The revenue offset
convention assumes that acquisition costs are 20% of net written premiums for all lines of
property/casualty business and all types of insurers and requires that 20% of unearned
premiums be currently included in earned premiums. In our example, the unearned premium
reserve would be reduced by $20, resulting in the income effect from writing this contract as
$0.

FINANCIAL REPORTING THROUGH THE LENS OF A PROPERTY/CASUALTY ACTUARY
Part VI. Differences from Statutory to other Financial/Regulatory Reporting Frameworks in
the U.S.
358
Statutory earned premium is calculated as net written premium minus the change in the
unearned premium reserve. Under the revenue offset convention, tax basis earned premiums
are net written premium minus 80% of the change in unearned premium reserves.
Tax Basis Earned Premium
= Net Written Premium – (0.8 x (Change in Unearned Premium Reserve))
This formula can be rearranged to provide:
Tax Basis Earned Premium
= Statutory Earned Premium
+ (0.2 x (Change in Unearned Premium Reserve)).
Where the change in Unearned Premium Reserve
= Unearned Premium Reserve at end of period – Unearned Premium Reserve at
beginning of period.
TAX BASIS INCURRED LOSSES AND LOSS ADJUSTMENT EXPENSES
Statutory calendar-year incurred losses are paid losses plus the change in full value loss
reserves:
Incurred losses = Paid losses + Change in full value loss reserves
= Paid losses + (Full value loss reserves at end of period – Full value loss
reserves at beginning of period).
For long-tailed lines of business, without the time value of money considerations that are
considered in the pricing of policies, the result may be an underwriting loss under this
statutory definition of incurred losses. As we previously discussed, the IRC does not provide
an insurance company with a tax credit for what appears to be a temporary loss when
investment income can be made on the reserves held before the claims are paid. To avoid
this, tax basis accounting is more aligned with economic reality by requiring the discounting
of loss reserves, albeit with defined rules and the lack of a risk margin/adjustment.
Our next section will discuss the process of discounting for taxes in more detail. For now, it is
sufficient to understand that:
Tax Basis Incurred Losses = Paid Losses + Change in Discounted Reserves
= Statutory Incurred Losses – Change in Reserve Discount.

FINANCIAL REPORTING THROUGH THE LENS OF A PROPERTY/CASUALTY ACTUARY
Part VI. Differences from Statutory to other Financial/Regulatory Reporting Frameworks in
the U.S.
359
Loss adjustment expenses are treated in the IRC in the same manner as losses (i.e., estimated
loss adjustment expense is subject to discounting). Other kinds of expense liabilities are
addressed in a different paragraph in the IRC and may be subject to a different timing
requirement.
INVESTMENT INCOME
Taxable investment income consists of income from bonds, mortgages, real estate and
venture capital holdings, and realized capital gains. In addition, there are two key
adjustments: proration of tax-exempt municipal bond interest and proration of dividends
received deduction for stockholder dividends.
Tax-exempt municipal bonds produce tax-free income for most taxpayers. Similarly, the
dividends received deduction (DRD) allows most corporate taxpayers to reduce taxable
income by a portion of dividends received from other corporate taxpayers. Generally,
earnings credited to the cash values of life insurance policies owned by corporate taxpayers
are not recognized as current income. Insurance companies, however, are required under the
IRC to include a portion of such tax-favored income and earnings in taxable income under a
rule known as “proration”. For a property/casualty insurer, proration increases taxable
income by reducing the deduction for losses incurred by a percentage of such tax favored
income.
Previously, the proration rules required a property/casualty insurance company to reduce its
losses incurred deduction by an amount equal to 15% of the sum of its tax-exempt income,
DRD and any earnings credited to life insurance products owned.
The TCJA amended the proration rules in a manner that retains the prior law’s financial effect
(i.e., a 15% reduction in the deduction from income taxed at a top marginal rate of 35%) while
reflecting the reduction of the top corporate marginal rate from 35% to 21%. It does so by
replacing the reduction percentage of 15% under previous law with a reduction percentage
computed by dividing 5.25% (the “applicable percentage” referred to in the statute) by the
top corporate tax rate of 21%, which results in a reduction percentage of 25%. Should the top
corporate tax rate change in future years, the proration rate will also change.
BASE EROSION AND ANTI-ABUSE TAX (BEAT)
Now that we have determined taxable income, we can establish the regular tax liability, which
is 21% of taxable income, a decrease from 35% under the previous tax law. Yet that is not
necessarily the end of the calculations; if a U.S. insurance company makes a payment to a
related foreign company, it might be subject to the BEAT.

FINANCIAL REPORTING THROUGH THE LENS OF A PROPERTY/CASUALTY ACTUARY
Part VI. Differences from Statutory to other Financial/Regulatory Reporting Frameworks in
the U.S.
360
In general, the BEAT calculations may apply when a domestic taxpayer, such as an insurance
company that is domiciled in the U.S., obtains a “base erosion tax benefit” as a result of
making a “base erosion payment” to a related foreign party. BEAT applies when the insurance
company is part of a U.S. group of companies that has average gross receipts in the past
three years equal to or in excess of $500M and if base erosion payments constitute 3% or
more of the total deductions taken by the U.S. group on its current tax return.
The BEAT operates as a type of “minimum tax” that is added to the regular tax liability. It
operates by ascertaining the “modified taxable income” of a U.S. taxpayer that has paid or
incurred amounts to a foreign related party that provide deductions from regular taxable
income or, in the case of reinsurance premiums to a foreign reinsurer, reduce gross income
included in regular taxable income. Generally, modified taxable income is determined by
adding back to regular taxable income the base erosion tax benefit caused by a base erosion
payment. This minimum tax is equal to the excess of:
i. BEAT rate x modified taxable income over
ii. Regular tax liability
The BEAT rate in the 2018 tax year was 5%, moving to 10% in tax years 2019 through 2025,
and then subsequently to 12.5%. The modified taxable income includes the income subject to
the regular tax rate plus all deductible or excludible payments made to a foreign affiliate (base
erosion payments) for the year.
Accordingly, to determine the BEAT charge a corporation should perform the following steps:
1. Determine if subject to the BEAT
2. Determine taxable income and compute regular tax of its U.S. companies
3. Compute modified taxable income
4. Apply the BEAT tax rate to modified taxable income
5. Compare regular tax liability with the BEAT
As an example, assume there is a domestic insurance company that is part of a U.S. group
that meets the minimum requirements for being subject to the BEAT. In the 2019 tax year,
this U.S. subsidiary has $120 of gross written premium for coverage effective January 1 (and
so no unearned premiums), $0 investment income, $0 losses incurred and $10 of general and
administrative expenses. Additionally, the U.S. subsidiary paid reinsurance premiums of $70
to a related foreign insurance company.
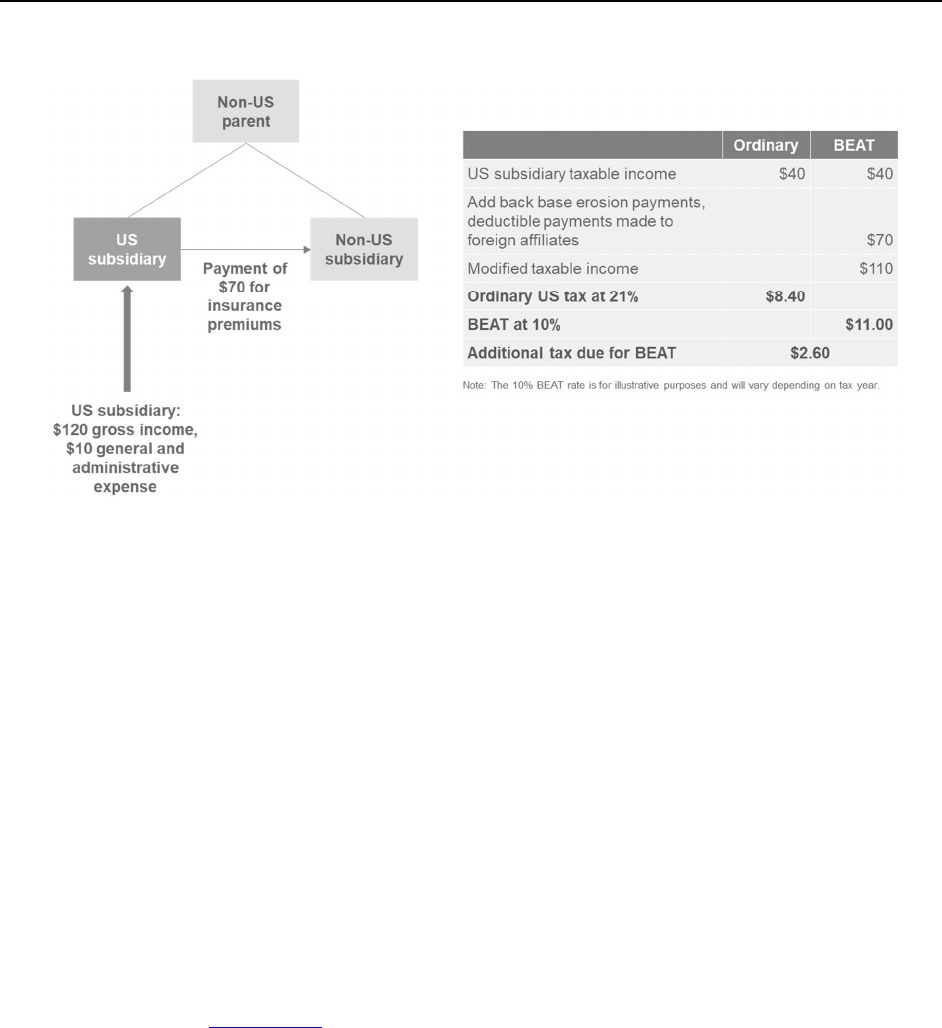
FINANCIAL REPORTING THROUGH THE LENS OF A PROPERTY/CASUALTY ACTUARY
Part VI. Differences from Statutory to other Financial/Regulatory Reporting Frameworks in
the U.S.
361
TABLE 109
The U.S. subsidiary regular tax must first be determined:
• Taxable income = $120 gross written premium reduced by $70 of reinsurance
premiums reduced by expenses of $10 = $40
• Regular tax = $40 * 21% = $8.40
Then the BEAT tax must be determined:
• Modified taxable income = $40 + $70 = $110
• BEAT tax = $110 * 10% = $11
As such, the additional tax due under the BEAT is $2.60 ($11 - $8.40).
It is noted, however, that payments to a foreign company that has elected to be taxed as a
U.S. taxpayer under Section 953(d) are not subject to the BEAT.
DISCOUNTING LOSS RESERVES FOR TAXES
In the section within Chapter 22 titled “Deferred Tax Assets”, we discussed the reasons why
statutory loss reserves are discounted in calculating taxable income. We shall now look in
more detail at the method prescribed under the IRC for determining the discount required.
The discounted loss reserves are calculated using three components:
1. The undiscounted loss reserves
2. The discount rate promulgated by the U.S. Treasury for that accident year
3. The payment pattern

FINANCIAL REPORTING THROUGH THE LENS OF A PROPERTY/CASUALTY ACTUARY
Part VI. Differences from Statutory to other Financial/Regulatory Reporting Frameworks in
the U.S.
362
The first component is obtained from Schedule P, Part 1. Reserves in Schedule P, Part 1 are
net of tabular discount but gross of non-tabular discount. Therefore, any tabular discount will
need to be eliminated to gross-up the loss reserves from Schedule P, Part 1 to an
undiscounted basis.
The discount rate will be determined by the U.S. Treasury for each accident year and is to be
based on the corporate bond yield curve., effective for taxable years beginning after
December 31, 2017. This, this is a change from the previous tax law, where the discount rate
was determined for each accident year based on the 60-month average of the Federal
midterm rates.
The payment pattern for each line of business is determined every five years by the IRS based
on the paid loss development from industry aggregate Schedule P, Part 1 data. Under the
TCJA, insurance companies can no longer elect to use their own payment patterns.
Additionally, during the transition from the previous tax law to the TCJA in tax year 2018,
unpaid losses and loss adjustment expenses for all accident years were discounted using the
interest rate and loss payment patterns applicable to accident year 2018. The recognition of
the adjustment (differences in taxable reserve estimates between the prior methodology and
the new methodology at the same point in time) from the interest rate and payment pattern
changes are evenly spread across eight tax years so that Companies are not burdened with
the full change in the first year in taxable income from a change in the tax reserve. Below is
an example of an implied eight year spread:
TABLE 110
Tax Year Statutory Reserve Tax Discount Factor*
Beginning of Year 2018
Net Change in Taxable
Reserve**
8 Year Spread of Net
Change***
2017 51,557 0.9
2018 0.8 (5,156) (644)
2019 (644)
2020 (644)
2021 (644)
2022 (644)
2023 (644)
2024 (644)
2025 (644)
** -$5,156 = $51,557 * (0.8 - 0.9)
*** -$644 = -$5,156/8
* For example purposes, assume that 0.9 is the company implied tax discount factor under the prior law and 0.8 is the
implied company tax discount factor under the current law

FINANCIAL REPORTING THROUGH THE LENS OF A PROPERTY/CASUALTY ACTUARY
Part VI. Differences from Statutory to other Financial/Regulatory Reporting Frameworks in
the U.S.
363
TCJA IMPACT
As discussed above, the TCJA had the following key changes affecting insurance companies:
· Decrease in the corporate tax rate
· Repeal in the election for use of company-specific payment patterns
· Change in the determination of the interest rate
· Addition of the Base Erosion and Anti-Abuse Tax (BEAT)
These changes will have varying impacts, with the biggest drivers being the primary
exposures that are written, what payment patterns were used in the past, and whether or not
the company utilizes an affiliated foreign entity for certain transactions (e.g., reinsurance).

FINANCIAL REPORTING THROUGH THE LENS OF A PROPERTY/CASUALTY ACTUARY
Part VII. Canadian-Specific Reporting
364
PART VII. CANADIAN-SPECIFIC REPORTING
INTRODUCTION TO PART VII
This part provides an overview of insurance financial reporting in Canada and a description of
the main participants who influence the reporting framework in Canada. The Canadian
regulatory Annual Statement and certain key elements of particular importance to Canadian
actuaries are discussed.

FINANCIAL REPORTING THROUGH THE LENS OF A PROPERTY/CASUALTY ACTUARY
Part VII. Canadian-Specific Reporting
365
CHAPTER 27. OVERVIEW OF FINANCIAL REPORTING IN CANADA
OVERVIEW
Insurance regulators, the accounting profession, and the actuarial profession play a role in
setting the framework for insurance financial reporting in Canada.
Insurance is regulated in Canada at the federal and provincial levels. As a result, insurance
companies can choose to be registered federally (across Canada) or separately in each
province where they conduct business. The majority of insurers are regulated federally under
the jurisdiction of the Office of the Superintendent of Financial Institutions (OSFI).
203
Registered
204
insurers are required annually to file detailed financial statements with
supporting exhibits and quarterly updates. In addition, since 1992 registered insurers have
been required to appoint an actuary (“Appointed Actuary”) to value their policyholders’
liabilities and to report at least annually on the current and future financial condition of the
insurer. Each province regulates its own policy forms and monitors market conduct; hence, an
insurer must also be licensed by each province in which it writes business regardless of where
it is registered.
OFFICE OF THE SUPERINTENDENT OF FINANCIAL INSTITUTIONS
OSFI is a federal agency established in 1987 under the Office of the Superintendent of
Financial Institutions Act. OSFI’s mandate is to supervise all federally regulated financial
institutions, monitor federally regulated pension plans and provide actuarial advice to the
Government of Canada.
OSFI’s activities are structured to protect the rights and interests of depositors,
policyholders, pension plan members, and creditors of financial institutions and in so doing to
contribute to the public confidence in a safe and sound financial system. This is accomplished
through supervision under a principles-based regulatory framework which is designed
205
to
identify key risks in certain institutions and intervene as appropriate and through regulation
to enhance the financial system’s safety and soundness.
OSFI differs from the National Association of Insurance Commissioners (NAIC) in that OSFI
covers all federally regulated financial institutions and not just insurance companies. OSFI has
authority over the entities it regulates, whereas the NAIC is a coordinating body that works
203
Office of the Superintendent of Financial Institutions Canada, http://www.osfi-bsif.gc.ca/, May 20, 2017.
204
A registered insurer in Canada is an insurer that is licensed to distribute insurance policies by either the federal
regulator or a provincial regulator in Canada.
205
OSFI’s web site provides a table of guidelines such as the Minimum Capital Test which comprise the principles-
based regulatory framework by which OSFI regulates insurers in Canada.

FINANCIAL REPORTING THROUGH THE LENS OF A PROPERTY/CASUALTY ACTUARY
Part VII. Canadian-Specific Reporting
366
with state insurance regulators to provide support and coordination to the regulation of
multistate insurers across the various states.
INTERNATIONAL FINANCIAL REPORTING STANDARDS (IFRS)
On January 1, 2013, the Chartered Professional Accountants of Canada (CPA Canada) was
established by both the Canadian Institute of Chartered Accountants (CICA) and the Society
of Management Accountants of Canada (CMA Canada) to support the Canadian provincial
accounting bodies unifying under the CPA banner. Certified General Accountant (CGA-
Canada) integrated with CPA Canada on October 1, 2014, completing the unification of
Canada’s accounting profession at the national level.
In 2011, the Canadian Institute of Chartered Accountants (CICA) adopted all changes to IFRS
standards issued by the International Accounting Standards Board (IASB) as part of the
reporting framework for publicly accountable entities (PAE).
206
Regulated insurance
companies meet the definition of PAEs and therefore were required to adopt IFRS as of
January 1, 2011 (with comparative information for 2010). Today, this still holds with the
merge to CPA Canada.
IFRS 4 is the current standard that deals with accounting for insurance contracts. It allows for
the continuation of valuation practices in existence at the adoption of IFRS that Canadian
Generally Accepted Accounting Principles (CGAAP) provided for insurance contracts. Under
CGAAP the policy liabilities can be recorded in accordance with accepted actuarial practice
(AAP) in Canada, which means the recorded liabilities are discounted to reflect the time value
of money and include a provision for adverse deviation. The accounting for foreign branches
and domestic insurers is substantially the same, and their financial statements are prepared
in accordance with IFRS. However, there are two key differences for foreign branches:
1. The assets of foreign branches are required to be under the control of either the
Minister of Finance of Canada or the branches’ Chief Agent in Canada. The amount of
assets under the control of the Minister of Finance is determined by risk based
minimum capital requirements, further described in Chapter 29. Assets that are under
the control of the Minister of Finance are to be placed in a trust.
2. There is no share capital account, as the entity is operating as a branch of its parent;
therefore, there is a head office account instead.
206
Publicly accountable enterprises, https://www.canada.ca/en/revenue-
agency/services/tax/businesses/topics/international-financial-reporting-standards-ifrs/publicly-accountable-
enterprises-paes.html, 2019
5
Chartered Professional Accountants of Canada, https://www.cpacanada.ca , 2018.

FINANCIAL REPORTING THROUGH THE LENS OF A PROPERTY/CASUALTY ACTUARY
Part VII. Canadian-Specific Reporting
367
CANADIAN INSTITUTE OF ACTUARIES
The Canadian Institute of Actuaries (CIA) is the national organization of the Canadian
actuarial profession.
207
The CIA serves the public through the provision, by the profession, of
actuarial services and advice of the highest quality.
AAP is the manner of performing work in Canada in accordance with the rules and the
Standards of Practice (SOP) of the CIA. SOP is the responsibility of the Canadian Actuarial
Standards Board,
208
and approval of standards and changes to standards are made through a
process that involves consultation with the actuarial profession and other interested parties.
If AAP conflicts with the law, an actuary should comply with the law but report the conflict
and, if practical, useful and appropriate under the terms of the engagement, report the result
of applying AAP.
The SOP published by the CIA are binding on fellows, associates, and affiliates of the CIA for
work in Canada and for members of bilateral organizations, as defined in the bylaws, when
those members are practicing in Canada. The standards consist of recommendations and
explanatory text. A recommendation is the highest order of guidance in the SOP. Unless there
is evidence to the contrary, there is a presumption that a deviation from a recommendation is
a deviation from AAP. Explanatory text, which consists of definitions, explanations, examples,
and useful practices, support and expand upon the recommendations.
The SOP consist of general standards and practice-specific standards. The general standards
apply to all areas of actuarial practice. Usually, the intent of the practice-specific standards is
to narrow the range of practice considered acceptable under the general standards.
Actuaries practicing in Canada should be familiar with relevant educational notes and other
designated educational material affecting their practice. Educational notes are not binding on
an actuary; however, educational notes and other designated educational material describe
but do not recommend practice in illustrative situations. A practice that the educational notes
describe for a situation is not necessarily the only accepted practice for that situation and is
not necessarily AAP for a different situation.
DIFFERENCES BETWEEN STATUTORY AND OTHER FINANCIAL/REGULATORY REPORTING
FRAMEWORKS IN CANADA
Canadian insurers are required to prepare their financial statements in accordance with IFRS,
as issued by the IASB, since 2011. The Canadian Annual Returns were also modified to
include the impacts of changes to IFRS. Upon the introduction of IFRS, the insurance
contracts standard (IFRS 4) permitted insurers to apply CGAAP for their insurance contracts.
With IFRS 4, there was little impact on the financial statements of Canadian property/casualty
6
Canadian Institute of Actuaries, http://www.cia-ica.ca/, 2018.
7
Actuarial Standards Board, “About the ASB – Terms of Reference,” http://www.asb-cna.ca/, September 27, 2017.

FINANCIAL REPORTING THROUGH THE LENS OF A PROPERTY/CASUALTY ACTUARY
Part VII. Canadian-Specific Reporting
368
insurers, and as in the past, the statutory Annual Return was prepared on the same basis as
the company’s financial statements.
In May 2017, the IASB issued a new insurance contracts standard, IFRS 17, which is effective
for annual accounting periods beginning on 1 January 2023. As companies were allowed to
use a wide variety of accounting practices for insurance contracts under IFRS 4, it was
difficult for investors and analysts to understand and compare results of insurers, especially
from an international perspective. IFRS 17 is expected to improve the comparability of
financial performance of insurance contracts between different entities. The standard applies
to both life and property and casualty insurers and it requires insurers to divide insurance
contracts into groups, and recognize groups of contracts as risk-adjusted present value of
future cash flows, plus an amount representing the unearned profit in the group of contracts
(named contractual service margin under IFRS 17). There is a simplified approach (premium
allocation approach) that will apply to certain types of contracts, which is somewhat
consistent with current Canadian practice, and it is expected that this simplified approach will
be widely adopted by property and casualty insurers in Canada. The standard may have a
significant effect on many insurers as their existing accounting policies are likely to differ
from those required by the IFRS 17. Therefore, the costs involved in implementing IFRS 17
are expected to be substantial because of the need for significant systems development in
order to capture the required information.
Statutory Accounting Principles (SAP) is the accounting framework under which all U.S.
insurance companies are required to report for state regulatory purposes. There are many
differences between SAP and IFRS, including the valuation of invested assets and the
valuation of policy liabilities. These differences arise because in Canada there is a desire to
achieve consistency with published financial statements and in the U.S. there is a focus on
insurer solvency.

FINANCIAL REPORTING THROUGH THE LENS OF A PROPERTY/CASUALTY ACTUARY
Part VII. Canadian-Specific Reporting
369
CHAPTER 28. CANADIAN ANNUAL RETURN
OVERVIEW
All insurers are required to file an Annual Return (or Canadian Annual Statement) based on
International Financial Reporting Standards (IFRS) in each province where they are licensed
and with the Office of the Superintendent of Financial Institutions (OSFI) if they are federally
regulated. The Annual Returns are prescribed forms that are annually reviewed by the
Canadian Council of Insurance Regulators. The full Annual Return is to be completed and filed
annually within 60 days of year-end. In addition, there is a requirement to file interim returns
on a quarterly basis within 45 days of the end of each quarter.
PREPARATION OF KEY SCHEDULES
The Canadian Annual Return is logically divided into a number of sections as follows:
• General information: This section contains information about the company, its
officers, and directors and a summary of selected financial data for five years.
• Consolidated financial statements: This section shows the company’s balance sheet
(assets, liabilities, and equity), statement of income; statement of retained earnings
and reserves; statement of comprehensive income and accumulated comprehensive
income; statement of cash flows; statement of changes in equity; and notes.
• Statutory compliance: This is the Minimum Capital Test (MCT) for domestic insurers or
the Branch Adequacy of Assets Test (BAAT) for foreign insurers, including supporting
exhibits, related to capital adequacy.
• Investments: This includes detailed information relating to the company’s invested
assets.
• Miscellaneous assets and liabilities: This includes items such as other receivables and
interests in joint ventures.
• Premiums, claims, and adjustment expenses: This section contains detailed
information relating to unearned premiums, incurred losses, claims liabilities, and
runoff of claims and adjustment expenses.
• Provincial and territorial summaries: This provides geographical premium and claims
information.
• Reinsurance ceded: This includes information related to premiums and claims ceded.
• Commissions and expenses: This includes details relating to commissions and
operating expenses.
• Out of Canada exhibits: This section provides detail relating to operations outside of
Canada.

FINANCIAL REPORTING THROUGH THE LENS OF A PROPERTY/CASUALTY ACTUARY
Part VII. Canadian-Specific Reporting
370
• Non-consolidated financial statements and exhibits: Financial statements and many of
the exhibits are also provided on a non-consolidated basis.
The report of the appointed actuary must be submitted with the Annual Return. It is expected
that the values reported in the financial statements for the items included in the opinion of
the appointed actuary not differ materially from the values opined on by the appointed
actuary.
BALANCE SHEET
Appendix II of this publication shows separately the assets and liabilities and equity elements
of the balance sheet for the total of all Canadian property/casualty insurance companies as
reported by the OSFI as at December 31, 2017. The Appointed Actuary should be familiar
with all aspects of the Annual Return; however, the Appointed Actuary is opining on the policy
liabilities and is thus expected to demonstrate a significant understanding of all elements of
the policy liabilities (claims and policy liabilities in connection with unearned premiums ).
The claims and premium liabilities are typically the largest liabilities on the balance sheet of
an insurer and are reported through the following:
1. Claims liabilities:
a. Direct unpaid claims and adjustment expenses
b. Assumed unpaid claims and adjustment expenses
c. Ceded unpaid claims and adjustment expenses
d. Other amounts to recover
2. Premium liabilities:
a. Gross unearned premiums
b. Net unearned premiums
c. Premium deficiency reserves
d. Other net liabilities
e. Deferred policy acquisition expenses
f. Unearned commissions
Table 111 summarizes the balance sheet provided in Appendix II of this publication into key
items from the perspective of the Appointed Actuary.

FINANCIAL REPORTING THROUGH THE LENS OF A PROPERTY/CASUALTY ACTUARY
Part VII. Canadian-Specific Reporting
371
TABLE 111
Balance sheet summary — Canadian property/casualty companies at December 2018
Assets
Liabil
ities
and Equity
Total Investments 69,100,568 Unpaid Claims and Adjustment
Expenses
58,646,287
Unpaid Claims Recoverable
from Reinsurers
17,103,237 Unearned Premiums 25,688,427
Unearned Premium
Recoverable from
Reinsurers
4,101,116 Unearned Commission 787,090
Deferred Policy Acquisition
Expenses
4,509,415 Other Liabilities 8,782,174
Other Assets
30,208,179
Equity
31,118,537
As illustrated, the unpaid claims and loss adjustment expense (LAE) and unearned premium
liabilities are the most significant liabilities on the balance sheet. In Canada, the claims and
premium liabilities are reported on the balance sheet on a gross basis. That is, the liabilities
are reported gross of reinsurance, and an asset is recorded to reflect the amount of the
liabilities expected to be recoverable from reinsurers, which, as illustrated above, is a
significant asset on the balance sheet.
The liabilities in Canada are recorded in accordance with AAP, which requires that the
liabilities be equal to the value discounted to reflect the time value of money plus a provision
for adverse deviation (PfAD). A discount rate has to be selected to determine the present
value of the liabilities. This discount rate is defined by the Canadian Institute of Actuaries as
follows:
“The expected investment return rate for calculation of the present value of
cash flow is that to be earned on the assets, taking into account reinsurance
recoverables, that support the insurance contract liabilities. It depends on
the assets owned at the calculation date,
the allocation of those assets and related investment income among
lines of business,
the method of valuing assets and reporting investment income,
the yield on assets acquired after the calculation date,
the capital gains and losses on assets sold after the calculation date
investment expenses, and
losses from asset depreciation.

FINANCIAL REPORTING THROUGH THE LENS OF A PROPERTY/CASUALTY ACTUARY
Part VII. Canadian-Specific Reporting
372
The actuary need not verify the existence and ownership of the assets at the
calculation date, but would consider their quality.”
209
This definition requires the Appointed Actuary to also understand the assets on the balance
sheet, how they are valued and the insurer’s investment policy. Typically, a large proportion
of invested assets are used to support insurance contract liabilities. Therefore, the Appointed
Actuary should be able to estimate the expected investment return on those assets. The
following chart, Table 112, illustrates a simple calculation of the market yield of a bond
portfolio. The market yield and modified duration are calculated using readily available
spreadsheet functions and the overall yield is calculated using the product of modified
duration and market value as weights.
TABLE 112
XYZ Insurance Company
CDN$
Evaluation Date: December 31, 2018
Description
Interest
Rate
Maturity
Date
Par
Value
Market
Value
Market
Yield
Effective
Market
Yield
Modified
Duration
BOND A
5.38%
18
-
11
-
50
320,000.00
371,314.76
4.45%
4.50%
16.47
BOND B
4.87%
18
-
06
-
42
8,844,000.00
10,420,050.06
3.75%
3.79%
15.07
BOND C
4.46%
08
-
11
-
41
235,000.00
252,477.15
3.98%
4.02%
14.87
BOND D
6.95%
24
-
10
-
41
805,000.00
874,269.61
6.25%
6.35%
11.91
BOND E
5.15%
15
-
11
-
40
75,000.00
85,366.32
4.20%
4.25%
13.93
BOND F
3
.10%
18
-
06
-
40
2,055,000.00
2,638,690.57
1.59%
1.60%
17.02
BOND G
4.56%
26
-
03
-
40
1,080,000.00
1,321,528.41
3.15%
3.18%
14.67
BOND H
4.99%
30
-
10
-
37
200,000.00
247,497.12
3.34%
3.37%
13.28
BOND I
5.04%
21
-
09
-
29
200,000.00
275,976.38
1.50%
1.50%
9.30
BOND
J
4.30%
08
-
09
-
29
355,000.00
531,274.16
0.04%
0.04%
9.73
BOND K
3.25%
18
-
12
-
23
25,000.00
25,948.14
2.56%
2.58%
5.41
BOND L
8.50%
22
-
11
-
23
200,000.00
224,468.00
6.00%
6.09%
4.65
BOND M
8.00%
27
-
03
-
22
6,134,000.00
6,360,609.90
6.97%
7.10%
3.50
BOND N
4.25
%
30
-
05
-
21
3,270,000.00
2,893,628.26
8.18%
8.34%
3.06
BOND O
4.95%
10
-
03
-
20
4,800,000.00
4,947,188.78
3.48%
3.51%
2.04
BOND P
4.80%
18
-
06
-
20
378,000.00
405,969.44
1.72%
1.73%
2.34
BOND Q
5.56%
30
-
10
-
19
1,375,000.00
1,449,829.32
2.50%
2.51%
1.73
BOND R
4.95%
23
-
08
-
19
2,600,000.00
2,712,868.67
2.25%
2.26%
1.56
BOND S
4.54%
08-04-19
5,000,000.00
5,225,046.55
0.97% 0.98% 1.23
Total
37,951,000.00
41,264,001.60
Market value duration weighted average yield
3.
72
%
Estimated investment expense ratio
0.25%
Indicated discount rate net of expenses
3.47%
There are also other more complex methods employed for estimating the investment yield,
such as using a discounted cash flow model where the discount rate is the rate at which the
209
CIA ASB, Actuarial Standards of Practice – Practice-Specific Standards for Insurance (2000), Present Values, page
2022. http://www.cia-ica.ca. (Effective April 15, 2017; Revised February 1, 2018.)

FINANCIAL REPORTING THROUGH THE LENS OF A PROPERTY/CASUALTY ACTUARY
Part VII. Canadian-Specific Reporting
373
present value of claims cash flows equals the market value of the assets or where the
discount rate is the internal rate of return for a group of assets whose cash flow matches
claims payout.
INCOME STATEMENT
Appendix II of this publication shows the income statement for the total of all Canadian
property/casualty insurance companies as reported by OSFI as at December 31,2018. The
income statement measures the financial performance of the insurer over the accounting
period. The net income for the period is equal to revenues less expenses and income taxes.
For an insurance company, revenues and expenses are separately identified for insurance
underwriting operations, investment operations, and other operations (mainly from
subsidiaries, or affiliated or ancillary operations).
In the Canadian Annual Return, insurance revenue consists of net premiums written, which is
equal to direct written premiums plus assumed written premiums, less written premiums
ceded to reinsurers.
The change (opening unearned premiums less ending unearned premiums) in net unearned
premiums is added to net written premiums resulting in net premiums earned. The net
premiums earned item is the net underwriting revenue that is attributable to the accounting
period under consideration. Other underwriting-related revenues are added, such as service
charges, to generate total underwriting revenue.
Premium deficiency adjustments are required if the Appointed Actuary determines that the
net policy liabilities in connection with the net unearned premium are larger than the total of
the net unearned premium plus unearned commission liabilities less the deferred policy
acquisition expense asset as recorded by the company. Incurred claims, claims adjustment
expenses, acquisition expenses, general expenses, and any premium deficiency adjustments
must be deducted from total underwriting revenue to derive the underwriting income or loss
for the period under consideration.
Gross incurred claims and adjustment expenses are equal to gross claims and adjustment
expenses paid during the period plus the change in gross unpaid claims (ending unpaid claims
minus opening unpaid claims) and adjustment expenses calculated in accordance with AAP
over the period. The reinsurers’ share of claims and adjustment expenses is deducted from
gross incurred claims and adjustment expenses to derive net claims and adjustment expenses.
This calculation of net incurred claims and adjustment expenses is consistent with the same
exposure period(s) as revenue, as defined above.
The categories of acquisition expenses shown in the income statement in the Canadian
Annual Return are gross commissions, ceded commissions, taxes, and other acquisition
expenses. For an insurer that distributes its products through the independent broker

FINANCIAL REPORTING THROUGH THE LENS OF A PROPERTY/CASUALTY ACTUARY
Part VII. Canadian-Specific Reporting
374
network, commissions are typically the largest cost of acquiring the business. For those
companies that have captive agents or that distribute their products directly to the consumer,
the other acquisition expenses will be larger. The net commission expense is the gross (direct
plus assumed) commission expense less any commission income received from ceding
reinsurance — typically ceding commissions received on proportional reinsurance. The tax
expense item is for taxes, other than income taxes, such as premium taxes, associated with
writing insurance in Canada.
General expenses are items that do not relate directly to the acquisition of the business. This
includes salaries, management fees, professional fees, occupancy costs, and information
technology costs, among other items not directly related to the acquisition of the business.
Net investment income consists of investment income earned plus realized gains (losses), less
investment expenses.
Underwriting income, net investment income, and other revenues and expenses are added to
derive net income before income taxes and extraordinary items. Income taxes are separated
into current income taxes and deferred income taxes.
Extraordinary items, net of income tax, are added to arrive at the net income or loss for the
accounting period under consideration.
STATEMENT OF RETAINED EARNINGS
The statement of retained earnings illustrates the calculation of the retained earnings for the
insurance company at the end of the reporting period. The retained earnings at the end of the
reporting period are equal to the retained earnings at the beginning of the period plus the net
income earned during the period less dividends and changes in reserves required plus any
prior period adjustments.
RESERVES
This statement provides detail as to the reserves shown under the Equity section of the
balance sheet. These reserves are appropriations of surplus for items such as earthquakes or
nuclear events. These reserves have specific purposes and are required by OSFI in Canada.
STATEMENT OF COMPREHENSIVE INCOME AND ACCUMULATED COMPREHENSIVE INCOME
Total comprehensive income for the reporting period is equal to net income as reported on
the statement of income (above) plus other comprehensive income (OCI). OCI comes from
changes in unrealized gains (losses) on available-for-sale assets such as loans, bonds, and
debentures and equities; derivatives designated as cash flow hedges; foreign currency
translation; and share of OCI of subsidiaries, associates, and joint ventures. Items that are
reclassified to earnings of gains (losses) are also included in OCI.

FINANCIAL REPORTING THROUGH THE LENS OF A PROPERTY/CASUALTY ACTUARY
Part VII. Canadian-Specific Reporting
375
Accumulated other comprehensive income (AOCI) is the cumulative value of OCI or the total
of unrealized gains on the above noted items that is included in the equity on the balance
sheet.
STATEMENT OF CASH FLOWS
The statement of cash flows derives the value of cash and cash equivalents that are included
as the cash item on the balance sheet at the end of the reporting period. Cash flow is derived
from or used in operating activities, investing activities and financing activities. The cash flow
during the year from these activities is added to the opening cash to derive the cash balance
at the end of the year.
Operating activities relate to the operation of the business and include such items as:
• The net income generated during the year
• Changes in receivables
• Changes in unearned premiums and unpaid claims liabilities
• Recognized gains/losses in investments
The cash flow from investing activities is basically the net cash flow from the purchase of new
investments and the proceeds from the sale of investments plus the amortization of
premiums on investments.
The cash flow from financing activities is the net cash flow from increasing/repayment of
borrowing plus the increase/redemption of shares less dividends to shareholders.
STATEMENT OF CHANGES IN EQUITY
This exhibit illustrates the change in equity across various classes of equity (e.g., share
capital, retained earnings, accumulated other comprehensive income (“AOCI”) ) resulting
from various transactions or events such as issue of share capital, total comprehensive
income for the year, and dividends.
NOTES TO FINANCIAL STATEMENTS
The notes to financial statements are an integral part of the financial statements. The notes
provide significant detail on such important items as the basis of presentation, the basis of
measurement, significant accounting policies and detailed explanations relating to some of
the key financial statement items.
IMPACT OF REINSURANCE, INCLUDING COMMUTATIONS
Insurance companies may purchase reinsurance to limit their risk to loss from certain events.
There are many different forms of reinsurance contracts that insurers can enter into, allowing
each insurer to manage risk and capital in accordance with its own objectives. These

FINANCIAL REPORTING THROUGH THE LENS OF A PROPERTY/CASUALTY ACTUARY
Part VII. Canadian-Specific Reporting
376
reinsurance contracts can be used to protect against multi-claim, catastrophic events,
individual large losses, and poor experience across a line of business, among other uses, and
thereby act to reduce volatility in insurance results.
In the event that a registered insurer cedes business to a non-registered insurer, the
registered insurer is required to secure adequate collateral from the non-registered insurer to
receive full capital credit for the cession of this business. The collateral must be secured
through a Reinsurance Security Agreement providing the adequate level of creditor
protection to the ceding insurer. This aspect is further discussed in Chapter 29.
Treaty reinsurance is a contract that applies to all or a portion of an insurance company’s
contracts covered under the term of the agreement, typically for a calendar year. These
contracts generally are placed on an excess basis or on a proportional (quota-share) basis. In
an excess treaty, the reinsurer responds to all claims during the treaty period excess of a
specified threshold to a specified limit, e.g., automobile claims for $5 million excess of $5
million. In a proportional treaty, the reinsurer receives a set proportion of all premiums
subject to the treaty, net of ceding commission, and in return pays the same proportion of all
claims subject to the treaty. The ceding commission is paid by the reinsurer to the insurer in a
proportional treaty to reimburse the insurer for policy acquisition expenses.
Facultative reinsurance differs from treaty reinsurance in that it relates to reinsurance
against risks from certain policies written by an insurer. For example, an insurance company
writes a very large commercial property exposure and wishes to limit its losses from this
specific policy and hence purchases facultative reinsurance excess of its retained risk.
Reinsurance contracts impact the income statement and balance sheet of an insurance
company. When an insurer purchases reinsurance, it pays a ceding premium, which reduces
its earned premiums during the financial reporting period. It will also reduce its gross claims
and adjustment expenses incurred by the reinsurer’s share of claims and adjusting expenses
and reduce its commission expense for any ceding commissions received. All of these items
are reflected on the income statement.
Similarly, on the balance sheet of the Canadian Annual Return, there are two main
reinsurance assets: unpaid claims and adjustment expenses recoverable from reinsurers, and
unearned premiums recoverable from reinsurers. These assets reflect the share of the
corresponding liabilities recorded by the insurer, which are recoverable from reinsurers.
210
Table 113 charts a sample income statement and balance sheet for an insurance company
prior to the application of reinsurance.
210
This differs from the U.S. Annual Statement, where liabilities are shown net of reinsurance.

FINANCIAL REPORTING THROUGH THE LENS OF A PROPERTY/CASUALTY ACTUARY
Part VII. Canadian-Specific Reporting
377
TABLE 113
No Reinsurance
Statement of Income
Balance Sheet
ASSETs
Premium Written
Cash
$
18,000
Direct
$
340,000
Investments
Assumed
$
—
Bonds
and Debentures
$
650,000
Ceded
$
—
Common Shares
$
120,000
Net
Premiums Written
$
340,000
Receivables
Decrease (increase) in Net Unearned
Premiums $ 7,000
Other Insurers
$
20,000
Net Premiums Earned
$
347,000
Other
$
5,000
Gross Claim
s and Adjustment Expenses
$
225,000
Recoverable from
Reinsurers
Ceded Claims and Adjustment
Expenses $ —
Unearned Premiums
$ —
Net Claims and Adjustment Expenses
$ 225,000
Unpaid Claims and Adjustment
Expenses $ —
Gross Commissions
$
50,000
Other
Assets
$
5,000
Ceded Commissions
$
—
Other
Expenses
$
42,500
TOTAL ASSETS
$
818,000
Total Claims and Expenses
$
317,500
LIABILITIES
AND EQUITY
Underwriting Income
(Loss)
$
29,500
Net Investment Income
$
40,000
LIABILITIES
Net Income (Loss)
before Income Taxes
$
69,500
Income Taxes
$
24,325
Payables
NET INCOME
$
45,175
Other Insurers
$
3,000
Other
$
2,000
Unearned Premiums
$
10,000
Unpaid Claims and
Adjustment
Expenses
$
500,000
Other Liabilities
$
3,000
TOTAL LIABILITIES
$
518,000
EQUITY
Retained Earnings
$
300,000
TOTAL LIABILITIES AND EQUITY
$
818,000
Table 114 shows the impact of reinsurance on a company’s financial statements resulting
from two simple reinsurance treaties: an excess of loss treaty and a proportional treaty. To
simplify the example, we will ignore all impacts on investment income and income taxes, and,
further, we will assume that the treaties run from January 1 to December 31.
For the excess of loss treaty example, it is assumed that the company will cede $20,000 in
premiums and that it will recover $13,000 of losses from the reinsurer, of which $10,000 will
be unpaid at the end of the year. The following chart illustrates the impact on the foregoing
financial statements of such a treaty.

FINANCIAL REPORTING THROUGH THE LENS OF A PROPERTY/CASUALTY ACTUARY
Part VII. Canadian-Specific Reporting
378
TABLE 114
Excess of Loss
Treaty Reinsurance
Statement of Income
Bal
ance Sheet
ASSETS
Premium Written
Cash
$
1,000
Direct
$
340,000
Investments
Assumed
$
—
Bonds
and Debentures
$
650,000
Ceded
$
20,000
Common Shares
$
120,000
Net Premiums Written
$
320,000
Receivables
Decrease (increase) i
n Net Unearned
Premiums $ 7,000
Other Insurers
$
20,000
Net Premiums Earned
$
327,000
Other
$
5,000
Gross Claims and Adjustment
Expenses $ 225,000
Recoverable from Reinsurers
Ceded Claims and
Adjustment
Expenses $ 13,000
Unearned Premiums
$ —
Net Claims and Adjustment Expenses
$ 212,000
Unpaid Claims and Adjustment
Expenses $ 10,000
Gross Commissions
$
50,000
Other Assets
$
5,000
Ceded Commissions
$
—
Other Expenses
$
42,500
TOTAL ASSETS
$
811,000
Total Claims
and Expenses
$
304,500
LIABILITIES
AND EQUITY
Underwriting Income
(Loss)
$
22,500
Net Investment Income
$
40,000
LIABILITIES
Net Income (Loss)
before Income Taxes
$
62,500
Income Taxes
$
24,325
Payables
NET INCOME
$
38,175
Other Insurers
$
3,000
Other
$
2,000
Unearned Premiums
$
10,000
Unpaid Claims and
Adjustment
Expenses
$
500,000
Other Liabilities
$
3,000
TOTAL LIABILITIES
$
518,000
EQUITY
Retained Earnings
$
293,000
TOTAL LIABILITIES AND EQUITY
$
811,000
In the example above, the accounts impacted are highlighted, and it is assumed that ceded
premiums and claims have flowed through cash.
In the proportional example, it is assumed that 15% of premiums and claims are ceded and
that a ceding commission of 25% is paid to the insurer. It is also assumed that due to the large
ceded premium that invested assets (bonds) would be reduced and that 100% of the claims
are unpaid at the end of the year. Table 115 charts the impact on the foregoing financial
statements of such a treaty.

FINANCIAL REPORTING THROUGH THE LENS OF A PROPERTY/CASUALTY ACTUARY
Part VII. Canadian-Specific Reporting
379
TABLE 115
Proportional Reinsurance
Statement of Income
Balance Sheet
ASSETS
Premium Written
Cash
$
30,750
D
irect
$
340,000
Investments
Assumed
$
—
Bonds
and Debentures
$
599,000
Ceded
$
51,000
Common Shares
$
120,000
Net Premiums Written
$
289,000
Receivables
Decrease (increase) in Net Unearned
Premiums $ 7,000
Other Insurers
$
20,000
Net Premiums Earned
$
296,000
Other
$
5,000
Gross Claims and Adjustment
Expenses $ 225,000
Recoverable from Reinsurers
Ceded Claims and Adjustment
Expenses $ 33,750
Unearned Premiums
$ —
Net Claims and Adjustment Expenses
$ 191,250
Unpaid Cla
ims and Adjustment
Expenses $ 33,750
Gross Commissions
$
50,000
Other Assets
$
5,000
Ceded Commissions
$
(12,750)
Other Expenses
$
42,500
TOTAL ASSETS
$
813,500
Total Claims and Expenses
$
271,000
LIABILITIES
AND EQUITY
Underwriting Income
(Loss)
$
25,000
Net Investment Income
$
40,000
LIABILITIES
Net Income (Loss) before Income Taxes
$
65,000
Income Taxes
$
24,325
Payables
NET INCOME
$
40,675
Other Insur
ers
$
3,000
Other
$
2,000
Unearned Premiums
$
10,000
Unpaid Claims and Adjustment
Expenses
$
500,000
Other Liabilities
$
3,000
TOTAL LIABILITIES
$
518,000
EQUITY
Retained Earnings
$
295,500
TOTAL LIABILITIES AND
EQUITY
$
813,500
Again, accounts impacted are highlighted.

FINANCIAL REPORTING THROUGH THE LENS OF A PROPERTY/CASUALTY ACTUARY
Part VII. Canadian-Specific Reporting
380
COMMUTATION OF CLAIMS
Commuting a claim is a process in which one party is relieved of its obligations in respect of
the claim in exchange for a cash payment. This can happen between insurers and individual
claimants, with insurers under financial stress or between insurers and reinsurers. This
section addresses the commutation of claims between insurers and reinsurers.
Reinsurance contracts may contain a commutation clause, which requires the insurer to
relieve the reinsurer of its obligations in exchange for a cash payment. These clauses are
typically more common in contracts that cover long-tail liabilities, and the purpose is
generally to allow the reinsurer to settle its obligations within a finite period.
The primary motivation for a reinsurer to commute is to bring certainty to its results;
however, there are other benefits to the reinsurer associated with commutation, including
capital relief and savings in claims adjusting and administrative costs. From an insurer’s point
of view, there can be a benefit from commutation if there is a concern in respect of the
creditworthiness of the reinsurer — the receipt of cash extinguishes this risk. Insurers also will
save administrative costs. Insurers, however, once they receive the cash payment will be
subject to the risk of any future adverse loss experience in respect of the commuted liability
and will have to hold capital for this risk.
Claims subject to commutation typically have expected cash flows that extend into the future.
Therefore, the settlement of these claims requires that financial and non-financial
considerations associated with the future cash flows be contemplated. Financial
considerations can include items such as the amount and timing of cash flows, the discount
rate to be used, cost inflation, the potential for volatility in cash flows and income tax. Non-
financial considerations can include such items as regulatory involvement or legal court
decisions of the claimant(s), current and future entitlements of the claimant(s), and
unfavorable court decisions.
The commutation of a block of claims under a reinsurance agreement typically will involve the
actuary for the insurer and the actuary for the reinsurer. Each actuary will be charged with
estimating the present value of the future obligations. In estimating the present value of
these obligations, the actuary must consider the following:
• The nominal or undiscounted value of future loss and LAE on reported and unreported
claims
• The expected timing of the payout of the undiscounted loss and LAE
• Expected investment income on assets supporting these cash flows
• Income tax
• An appropriate risk load to provide for volatility
An example calculation of a commuted value of a portfolio is illustrated below.

FINANCIAL REPORTING THROUGH THE LENS OF A PROPERTY/CASUALTY ACTUARY
Part VII. Canadian-Specific Reporting
381
TABLE 116
Estimate of Commuted Value of Claims
December 31, 2018
Total
201
9
20
20
20
21
20
22
20
23
20
24
20
25
202
6
Estimated Payments
in Period
$1,000,000
$350,000
$150,000
$125,000
$100,000
$100,000
$75,000
$50,000
$50,000
Payment
Timing
0.5
1.5
2.5
3.5
4.5
5.5
6.5
7.5
Duration Matched
Risk Free Rate
2.
00%
2.00%
2.00%
2.00%
2.00%
2.00%
2.00%
2.00%
Present Value Claims
Cash Flow
$
950,223
$346,552
$145,610
$118,962
$93,304
$91,474
$67,261
$43,961
$43,099
Undiscounted Future
Payments remaining
$1,000,00
0
$650,000
$500,000
$375,000
$275,000
$175,000
$100
,000
$50,000
Required Margin
10.00%
10.00%
10.00%
10.00%
10.00%
10.00%
10.00%
10.00%
Target
Capital
Level
at 200%
$200,000
$130,000
$100,000
$75,000
$55,000
$35,000
$20,000
$10,000
Risk Cost of Capital
9.00%
9.00%
9.00%
9.00%
9.00%
9.00%
9.00%
9.00%
Cost of Capital in
Period
$18,000
$11,700
$9,000
$6,750
$4,950
$3,150
$1,800
$900
Timing
1
2
3
4
5
6
7
8
Discount Rate
2.00%
2.00%
2.00%
2.00%
2.00%
2.00%
2.00%
2.00%
Risk Margin
$
53,225
$17,647
$11,246
$8,481
$6,236
$4,483
$2,797
$1,567
$768
Commuted Value
$
1,003,448
The starting point in estimating the commuted value is to estimate the undiscounted value of
the liabilities to be commuted and the expected payout of the liabilities. This can be
completed using various actuarial approaches. In Table 116, these liabilities are discounted at
a risk-free rate corresponding to the average duration of each expected payment to obtain an
estimate of discounted liabilities.
The risk margin is estimated based on the cost of holding capital for claims liabilities. In this
case, it is assumed that required capital is based on a regulatory approach. For purposes of

FINANCIAL REPORTING THROUGH THE LENS OF A PROPERTY/CASUALTY ACTUARY
Part VII. Canadian-Specific Reporting
382
this example, it is assumed that a margin of 10% of the claim liabilities is required and that the
company must hold target capital equal to 200% of required capital.
The cost of holding capital is equal to the risk cost of capital multiplied by the regulatory
capital. The risk cost of capital can be calculated in various ways, such as by calculating a
weighted average cost of capital less the risk-free rate. The total risk margin is the present
value of the annual cost of capital amounts discounted at the risk-free rate. The commuted
value is calculated as the sum of the discounted value of the liabilities plus the risk margin.
PREMIUM LIABILITIES
The policy liabilities of a property/casualty insurance company at a particular valuation date
consist of claims liabilities and premium liabilities. Claims liabilities provide for events that
have happened prior to the valuation date, whether reported or not. Premium liabilities
provide for events that will occur after the valuation date on policies in force on the valuation
date, i.e., premium liabilities are the liabilities associated with the unexpired portion of an
insurance or reinsurance contract.
Net premium liabilities are not separately identified on an insurer’s balance sheet as a single
item but rather are derived by considering the following items:
1. Net unearned premiums
2. Net loss and LAE costs (external and internal) after the valuation date on in-force policies
3. Expected excess of loss reinsurance costs after the valuation date on in-force policies
4. Costs of servicing the in-force policies
5. Provision for premium adjustments
6. Contingent commissions adjustments
7. Unearned reinsurance commissions
8. Deferred policy acquisition expenses (DPAE)
9. Premium deficiency
A property/casualty insurer typically records items 1, 6, 7, and 9 as liabilities on its balance
sheet, item 8 is recorded as an asset on the balance sheet, and item 5 can be an asset or a
liability. Items 2, 3, and 4 are not recorded on the insurer’s financial statements but are used
by the Appointed Actuary in testing the adequacy of the recorded premium liabilities.
In testing the adequacy of premium liabilities, the Appointed Actuary is comparing an
estimate of ultimate costs associated with the unexpired portion of the policy against
premium liabilities recorded by the company. The elements of this calculation are discussed
below (on a net of reinsurance basis as the gross basis is identical with the exception of the
items relating to reinsurance ceded):
A. Unearned premiums: These are the company’s unearned premiums net of proportional
reinsurance.

FINANCIAL REPORTING THROUGH THE LENS OF A PROPERTY/CASUALTY ACTUARY
Part VII. Canadian-Specific Reporting
383
B. Excess of loss reinsurance costs: This is the expected costs of excess of loss
reinsurance associated with unexpired policies. It is typically calculated by applying the
subsequent year’s excess of loss reinsurance rates to the unearned premium.
C. Expected losses and external LAE: This is the expected losses (net of all reinsurance)
for the unexpired portion of the policy. In Canada this is calculated on an AAP basis,
i.e., discounted plus a PfAD. There are different ways to calculate this, such as
reviewing historical loss and LAE ratios on an AAP basis and selecting an expected
AAP loss ratio or by forecasting expected loss and LAE cash flows and then
discounting these and adding a PfAD.
D. Expected internal LAE: This provides for the internal costs associated with settling
these claims. This is typically calculated by reviewing historical ratios of paid internal
LAE to paid losses.
E. Expected maintenance expenses: This is the cost of servicing these in-force policies,
other than internal claims handling. This would provide for policy changes, customer
inquiries, etc.
F. Contingent commissions: Many insurers have contingent commission arrangements
with brokers, which pay additional commissions if certain volume and/or profit targets
are met, and this provides for the anticipated cost of these.
G. Policy Liabilities in Connection with Unearned Premium: The total of items B to F in
Table 117 below are all expenses associated with the unearned premium. The net
liability recorded by the company would be the unearned premium plus unearned
commissions less the deferred premium acquisition expense (DPAE) asset.
H. Equity in Unearned Premium Reserve: This is the amount by which the unearned
premiums exceed the policy liabilities in connection with unearned premium.
I. Unearned commissions: These are ceding commissions from proportional reinsurance
that are not yet earned by the company.
J. Maximum net DPAE: This is the maximum DPAE asset that the company may record
given the expected costs and the liability already recorded. If the company, on a
provisional basis, has a higher amount recorded, it must be adjusted downward to a
level at or below the amount flowing from this calculation.
K. In the event that this amount is negative, the company must record a premium
deficiency reserve, which is an additional liability to ensure that all future costs are
provided for.

FINANCIAL REPORTING THROUGH THE LENS OF A PROPERTY/CASUALTY ACTUARY
Part VII. Canadian-Specific Reporting
384
These elements are illustrated below in Table 117 on both gross and net of reinsurance
bases.
TABLE 117
ABC Insurance Company
Illustration of Test of Adequacy of Premium Liabilities ($000's)
Gross of Reinsurance Basis Net of Reinsurance Basis
A. Unearned Premiums $ 100,000 A. Unearned Premiums $ 80,000
B. Expected Losses and External L.A.E. $ 75,000 B. Excess of Loss Reinsurance Costs $ 3,000
C. Expected Internal L.A.E. $ 4,500 C.
Expected Losses and External
L.A.E. $ 61,600
D. Expected Maintenance Expenses $ 2,000 D. Expected Internal L.A.E. $ 4,500
E. Contingent Commissions $ 50 E. Expected Maintenance Expenses $ 2,000
F.
Policy Liabilities in Connection with
Unearned Premium (B+C+D+E) $ 81,550 F. Contingent Commissions $ 50
G.
Equity in Unearned Premium Reserve
(A-F) $ 18,450 G.
Policy Liabilities in Connection with
Unearned Premium (B+C+D+E+F) $ 71,150
H.
Equity in Unearned Premium
Reserve (A-F) $ 8,850
I. Unearned Commissions $ 150
J.
Maximum Net Deferred Acquisition
Expense (MAX(A-G+I,0)) $ 9,000
A number of items above are included in the premium liability component of the actuarial
opinion required by OSFI, as part of the Annual Return, as illustrated in Table 118. It is
assumed in this case that the company booked $6.5 million as a DPAE asset, which is less
than the $9 million calculated by the Appointed Actuary. Since the booked DPAE is less than
the maximum DPAE calculated by the appointed actuary there is no need for a premium
deficiency reserve.

FINANCIAL REPORTING THROUGH THE LENS OF A PROPERTY/CASUALTY ACTUARY
Part VII. Canadian-Specific Reporting
385
TABLE 118
Premium Liabilities (CDN in 000s)
Carried in
Annual Return
(Column 1)
Actuary’s
Estimate
(Column 2)
(1) Gross policy liabilities
in connection with unearned prem
iums
81,550
(2) Net policy liabilities in connection with unearned premiums
71,150
(3) Gross unearned premiums
100,000
(4) Net unearned premiums
80,000
(5) Premium deficiency
—
—
(6) Other net
liabilities
—
—
(7) Deferred policy acquisition ex
penses
6,500
(8) Maximum policy acquisition expenses deferrable
9,000
[(4)+(5)+
(9)]
Col. 1
–
(2)
Col. 2
(9) Unearned commissions
150

FINANCIAL REPORTING THROUGH THE LENS OF A PROPERTY/CASUALTY ACTUARY
Part VII. Canadian-Specific Reporting
386
CHAPTER 29. FINANCIAL HEALTH OF PROPERTY/CASUALTY INSURANCE
COMPANIES IN CANADA
RISK-BASED CAPITAL ADEQUACY FRAMEWORK
The Minimum Capital Test (MCT) for federally regulated property/casualty insurance
companies and the Branch Adequacy of Asset Test (BAAT) for foreign property/casualty
companies operating in Canada on a branch basis (foreign branch) were introduced in 2003
by the Office of the Superintendent of Financial Institutions (OSFI). To simplify their use,
effective January 1, 2012, the MCT/BAAT guidelines were consolidated into one document,
the MCT guideline. Under this guideline the MCT/BAAT ratios are also subject to an
independent audit.
The minimum and supervisory target capital standards set out in the MCT guideline published
by OSFI provide the framework within which the Superintendent assesses whether a
property/casualty company, or a foreign branch, maintains adequate capital.
Property/casualty companies are required, at a minimum, to maintain an MCT ratio of 100%
(minimum capital ratio). OSFI has also set a “supervisory target capital ratio” of 150% to
trigger early intervention and provide time for a company to take action to improve its MCT
ratio, if it falls below the supervisory target.
OSFI expects companies to establish their own “internal target capital ratio” to reflect their
own risk appetite and profile. An adequate internal target capital ratio provides the company
with capacity to withstand unexpected losses beyond those covered by the minimum capital
ratio. Notwithstanding that a property/casualty company or a foreign branch may meet these
standards, the Superintendent has the authority to direct the property/casualty company to
increase its capital or the foreign branch to increase the margin of assets over liabilities in
Canada.
Typically, the Appointed Actuary is involved with company management in setting its internal
target capital ratio. In setting it, the Appointed Actuary should consider the following, among
other items:
• Nature of the company: A stock company has the ability to raise capital and thus may
wish to hold enough capital to ensure that it stays above the supervisory target capital
ratio (150%) but not so much that it cannot generate its required return on capital. A
mutual company cannot raise capital and thus will typically wish to operate at a higher
ratio.
• Size of the company: A smaller company or monoline company may have more volatile
results and thus wish to hold more capital to ensure that it stays above the supervisory
target capital ratio under most circumstances.

FINANCIAL REPORTING THROUGH THE LENS OF A PROPERTY/CASUALTY ACTUARY
Part VII. Canadian-Specific Reporting
387
• Company’s reinsurance program: Reinsurance is a form of capital support in that it can
act to reduce the volatility in loss experience. In addition, when reinsurance reduces
the net claims liability, the capital required will also be reduced.
• Investment philosophy: Certain investment approaches will require greater capital.
That is, if a company does not match assets and liabilities or if a company holds a
greater proportion of its investments in equities, more capital may be required.
• Competitive forces: If competing companies can raise capital quickly, by issuing stocks
for example, their internal target can be relatively lower as it would be easy to raise
funds in an event that drains the capital.
In simple terms, the Minimum Capital Test (“MCT”) compares capital available to capital
required. Detailed guidelines are issued by and available from OSFI.
CAPITAL AVAILABLE
Capital available generally represents the company’s total equity adjusted for certain items.
It is restricted to the following, subject to qualification requirements by OSFI:
• Category A: common equity including common shares, surplus, retained earnings,
earthquake, nuclear and general reserves and Accumulated other comprehensive
income (AOCI);
• Category B & C: instruments issued by the institution that meet certain criteria for the
respective category.
Certain items are deducted from/adjusted within the total of capital available, such as:
• Interests in non-consolidated subsidiaries and associates, and joint ventures with more
than a 10% ownership interest
• Loans to non-consolidated subsidiaries, associates, and joint ventures with more than
a 10% ownership interest considered as capital
• Amounts due to/from unregistered reinsurers to the extent they are not covered by
deposits or letters of credit held as security
• Self-insured retentions where no collateral has been received
• The earthquake premium reserve (EPR) not used as part of financial resources to
cover earthquake risk exposure
• Deferred policy acquisition expenses associates with accident and sickness (A&S)
business, other than those arising from commissions and premium taxes
• Accumulated other comprehensive income on cash flow hedges
• Accumulated impact of shadow accounting
• Goodwill and other intangible assets
• Deferred tax assets that are not eligible for the 10% capital factor

FINANCIAL REPORTING THROUGH THE LENS OF A PROPERTY/CASUALTY ACTUARY
Part VII. Canadian-Specific Reporting
388
• Cumulative gains and losses due to changes in own credit risk on fair values financial
liabilities
• Defined benefit pension fund assets and liabilities
• Investments in treasury stock
• Reciprocal cross holdings in the common shares of insurance, banking, and financial
entities
• Adjustment to owner-occupied property valuations
• Accumulated net after-tax revaluation losses in excess of gains accounted for using
the revaluation model
• Other assets, as defined by OSFI, in excess of 1% of total assets
No capital factor is applied to items that are deducted from capital available.
CAPITAL REQUIRED
The total capital required is determined as the sum of capital required for insurance risk,
market risk, credit risk, and operational risk, less diversification credit (divided by 1.5). See
below for calculations of the capital requirements and the target level for each of these risk
components. Further details on each component of capital required follow.
INSURANCE RISK
MARGINS FOR UNPAID CLAIM AND PREMIUM LIABILITY
Insurance risk is the risk arising from the potential for claims or payouts to be made to
policyholders or beneficiaries. This risk arises from the present value of losses being
higher than the amounts originally estimated. Factors are applied to net unpaid claims
(less PfAD) and net premium liabilities (less PfAD). The factors for unpaid claims vary
by class of insurance and reflect the potential for variability in the estimates of these
amounts, e.g., a 15% factor is applied to personal property claims, and a 25% factor is
applied to liability claims. The risk factors for premium liabilities also vary by class of
insurance, e.g., property claims have a 20% factor, and Auto – Liability claims have a
15% factor. However, the accident and sickness line of insurance has margins for
unearned premiums and unpaid claims to take into account possible abnormal
negative variations in actual requirements.
RISK MITIGATION and RISK TRANSFER - REINSURANCE
The factor to be applied to unpaid claims and unearned premiums recoverable from
registered non-associated reinsurers is treated as a combined weight under the MCT
and is set at 2.5%. The factor to be applied to unearned premiums and unpaid claims
ceded to unregistered reinsurers is 20%. The resulting margin can be reduced to zero
by letters of credit and non-owned deposits held as security.

FINANCIAL REPORTING THROUGH THE LENS OF A PROPERTY/CASUALTY ACTUARY
Part VII. Canadian-Specific Reporting
389
SELF RETENTION
Self-Insured Retention represents the portion of a loss that is retained by the
policyholder. Credit maybe taken with acceptable collateral such as letters of credit
which are also subject to risk factors depending on the credit rating of the issuing
organization.
CATASTROPHES
In Canada there is specific guidance on the amount of capital required for earthquake
exposure and nuclear risk (if written). Components of capital are required for
Earthquake Premium risk and Earthquake Reserves. These maybe reduced based on
specific financial resources. The financial resources may take the form of capital &
surplus, earthquake premium reserve, reinsurance coverage and prior approved
capital financing.
MARKET RISKINTEREST RATE RISK
Interest rate risk is the risk of loss from changes in interest rates impacting interest-
rate-sensitive assets and liabilities. Interest rate risk arises due to the volatility and
uncertainty of future interest rates. Assets and liabilities whose value depends on
interest rates are impacted; generally, this includes fixed income assets and
discounted policy liabilities. The interest rate risk margin is the difference between the
change in the value of interest-rate-sensitive assets and the change in the value of
interest-rate-sensitive liabilities arising from a change in interest rates plus the change
in the value of allowable interest rate derivatives (only simple derivatives such as
interest rate futures, forwards, and swaps may be included).
Interest-rate-sensitive assets include the following:
• Term deposits and other short-term securities (excluding cash)
• Bonds and debentures
• Commercial paper
• Loans
• Mortgages
• Mortgage-backed securities and asset-backed securities
• Preferred shares
• Interest rate derivatives held for other than hedging purposes
Assets held in mutual funds and segregated funds that are interest-rate sensitive are
to be included in interest-rate-sensitive assets. All interest-rate-sensitive assets that
are held by the insurer are to be included, not just those backing liabilities.

FINANCIAL REPORTING THROUGH THE LENS OF A PROPERTY/CASUALTY ACTUARY
Part VII. Canadian-Specific Reporting
390
Net unpaid claims and adjustment expenses and net premium liabilities (as determined
in accordance with AAP) are considered to be the interest-rate-sensitive liabilities.
The interest rate risk margin is calculated as A – B + C where:
A. Estimated change in the value of the interest-sensitive asset portfolio
for an interest rate change of X%
B. Estimated change in the value of the interest-sensitive liabilities for an
interest rate change X%
C. Estimated change in the value of the allowable interest rate derivatives
for an interest rate change X%
The same calculation is completed for an interest rate change of –X%. The interest rate
risk margin is the greater of that resulting from a change of X% or –X%.
The change in the value of the interest-rate-sensitive assets and liabilities depends on
the duration of the relevant assets and liabilities. Modified duration or effective
duration may be used to calculate duration; however, the selected method must be
used for all interest-rate-sensitive assets and liabilities and must be used consistently
from year to year. The portfolio duration is calculated as a weighted average of the
duration of the individual assets or liabilities comprising the portfolio. The dollar
duration is the change in the asset or liability dollar value for a given change in
interest rates.
The estimated change in the value of the interest rate assets is therefore calculated as
duration of the asset portfolio multiplied by fair value of the asset portfolio multiplied
by X%. The estimated change in the value of the interest rate liabilities is therefore
calculated as duration of the liabilities multiplied by fair value of the liabilities
multiplied by X%. A simple example (ignoring the impact of interest rate derivatives)
follows:
Asset duration = 6 years
Fair value of asset portfolio = $500 million
X = 1.25%
Liability duration = 3 years
Fair value of liabilities = $350 million
Capital required = 6 * $500 million *.0125 – 3 * $350 million * .0125 =
$24.375 million

FINANCIAL REPORTING THROUGH THE LENS OF A PROPERTY/CASUALTY ACTUARY
Part VII. Canadian-Specific Reporting
391
FOREIGN EXCHANGE RISK
The foreign exchange risk margin is 10% of the greater of either the aggregate net
long positions or the aggregate net short positions in each currency, adjusted by any
effective allowable foreign exchange rate hedges.
The net open positions for each currency is the sum of:
• The net spot position (all asset items less all liabilities denominated in the
currency under consideration, including accrued interest and accrued expenses
if they are subject to exchange rate fluctuations);
• The net forward position, valued at current spot market exchange rates or
discounted using current interest rates and translated at current spot rates;
• Guarantees that will be called and are irrecoverable;
• Any fully hedged net future income/expenses not yet accrued;
• Other items representing a profit or loss in foreign currencies.
To reduce the amount of net exposure, a carve-out may be used by P&C insurer with a
net open long position in a given currency. This carve-out is equal to a short position
of up to 25% of the liabilities denominated in the corresponding currency, to a
maximum of zero.
A simple example for calculating the foreign exchange risk is as follows:
If a P&C insurer has $200 of U.S. assets and $100 of U.S. liabilities,
Net spot position = 200 – 100 = $100
Carve-out = 25% * $100 = 25
Foreign exchange risk margin = 10% * MAX ((net spot position – carve-out), 0)
= 10% * MAX ((100 – 25), 0)
= 10% * 75
= 7.5
EQUITY, REAL ESTATE, AND OTHER MARKET RISK EXPOSURES
Equity risk is the risk of economic loss due to fluctuations in the value of equity
securities. A 30% risk factor is applied to investments in common shares and joint
ventures in which a company holds less than or equal to 10% ownership interest, and
to the market value of equity futures, forwards, and swaps.
Real estate risk is the risk of loss due to changes in the value of a property or in real
estate investment cash flows. The risk factor for owner-occupied properties is 10%,
and a 20% factor is applied to real estate held for investment purposes.

FINANCIAL REPORTING THROUGH THE LENS OF A PROPERTY/CASUALTY ACTUARY
Part VII. Canadian-Specific Reporting
392
Other market risk exposures include those assets comprised in the “other assets”
category, where a 10% risk factor applies.
CREDIT RISK
The risk of loss resulting from a counterparty’s potential inability to fully meet contractual
obligations due to an insurer is defined as credit risk. This risk occurs anytime funds are
extended, committed, or invested through actual or implied contractual agreements. Risk
factors are as follows:
• Long-term obligations (term deposits, bonds, debentures, and loans) that are not
eligible for a 0% risk factor have a risk factor between 0.25% and 18% depending on
the rating and remaining term to maturity of the investment
• Short-term obligations (term to maturity less than 1 year) that are not eligible for a 0%
risk factor have risk factors between 0.25% and 8% depending on the rating of the
investment
• Risk factors for preferred shares are between 3% and 30% depending on the rating of
the investment
STRUCTURED SETTLEMENTS, LETTERS OF CREDIT, DERIVATIVES, AND OTHER
EXPOSURES
Capital required for structured settlements, letters of credit, derivatives, and other
exposures are for counterparty risk not covered by the capital required for balance sheet
assets. The capital required for these instruments is calculated as follows:
Capital required =
The credit equivalent amount of the instrument less collateral or guarantees
* Credit conversion factor (reflects the nature and maturity of the instrument)
* Capital factor (to reflect counterparty default risk).
The credit equivalent amount varies according to the type of instrument. The credit
equivalent of a structured settlement is the current replacement cost of the settlement.
For derivatives, it is the positive replacement cost plus an amount for potential future
credit exposure.
OPERATIONAL RISK
Operational risk is the risk of loss arising from inadequate or failed internal processes, people
and systems from external events. There are two risk drivers to determine the operational
risk margin: capital required and premium volume. For the total capital required (before the

FINANCIAL REPORTING THROUGH THE LENS OF A PROPERTY/CASUALTY ACTUARY
Part VII. Canadian-Specific Reporting
393
operational risk margin and diversification credit), an 8.5% risk factor is applied. The following
risk factors apply to insurance premiums:
• 2.50% for all direct premiums and ceded premiums written arising from third party
reinsurance
• 1.75% for assumed premiums written arising from third party reinsurance
• 0.75% for assumed and ceded premiums written arising from intra-group pooling
arrangements
To account for the additional pressures on people and systems due to rapid growth, additional
capital is required. Thus, a 2.50% risk factor is applied to the total amount of gross premiums
written in the past 12 months above a 20% growth threshold compared to the gross premiums
written for the same period in the previous year. Finally, to lessen the effect of the
operational risk margin for companies that have high-volume/low-complexity business, a 30%
cap is applied. This is calculated in relation to the total capital required before the operational
risk margin and diversification credit.
DIVERSIFICATION CREDIT
A company is not likely to incur the maximum possible loss from each type of risk
simultaneously since the losses arising across risk categories are not perfectly correlated.
Therefore, a diversification credit can be applied so that the total capital for the credit,
market, and insurance risk requirements is lower than the sum of the individual requirements
for these risks.
The formula used to calculate the diversification credit is:
=+− √
+
+ 2 × × ×
A = asset risk margin = capital required for credit risk + capital required for market
risk (e.g., interest rate, foreign exchange, equity, real estate, and other market
risks)
I = insurance risk margin
R = correlation factor between A and I = 50%
MINIMUM CAPITAL TEST
MCT = Capital Available / Capital Required, where Capital Required =
[Insurance risk margin + Market risk margin + Credit risk margin + Operational risk margin –
Diversification credit] / 1.5

FINANCIAL REPORTING THROUGH THE LENS OF A PROPERTY/CASUALTY ACTUARY
Part VII. Canadian-Specific Reporting
394
FOREIGN COMPANIES
Foreign companies operating in Canada on a branch basis are required to maintain an
adequate margin of assets over liabilities in respect of their business in Canada. The BAAT
provides a framework, similar to the MCT, by which the regulator assesses the adequacy of
assets of the branch.
The BAAT is similar to the MCT in that it compares net assets available to margin required.
The net assets available are equal to the excess of assets vested in Canada less total net
liabilities. The margin required is the sum of amounts required for the same items as in the
MCT, e.g., assets, policy liabilities, catastrophes, etc., less the diversification credit (as in the
MCT), divided by 1.5.
DYNAMIC CAPITAL ADEQUACY TESTING
Under federal regulation, the Appointed Actuary must investigate the insurer’s financial
condition. This is completed by way of Dynamic Capital Adequacy Testing (DCAT).
DCAT is a process of analyzing and projecting the trends of a company’s financial condition,
given its current financial and operating circumstances, its recent past, and its intended
business plan under a variety of future scenarios. It allows the Appointed Actuary to inform
company management of the likely implications of the business plan on capital and to provide
guidance on the significant risks to which the company is exposed.
The principal goal of this process is to help measure capital adequacy by arming the company
with the best information on courses of events that may lead to capital depletion and the
relative effectiveness of alternative corrective actions. Furthermore, knowing the sources of
threat, the company can strengthen the monitoring systems where it is most vulnerable and
thus provide information on a continuous and timely basis.
In accordance with AAP, the DCAT process must include a base scenario and several plausible
adverse scenarios. The CIA provides guidance as to the risk categories that must be examined
for possible threats to capital adequacy. For property and casualty insurers, some of these
risk categories include claim frequency and severity, inflation, premium increases and
decreases, investment, reinsurance, and policy liabilities. However, the risk categories
enumerated by the CIA are not necessarily the only ones to be examined because the
circumstances of the insurer may result in the need to examine other risk categories.
The DCAT process generally consists of the following:
1. Development of a base scenario, which is typically derived from the company’s
business plan
2. Examination of the risk categories (mandatory or otherwise) to determine those that
are relevant to the company circumstances

FINANCIAL REPORTING THROUGH THE LENS OF A PROPERTY/CASUALTY ACTUARY
Part VII. Canadian-Specific Reporting
395
3. Stress-testing of the risk category in question for each relevant risk category
4. Selection of those scenarios requiring further analysis
5. Reporting on the results of the analysis
In the most general sense, solvency is the ability of an entity to honor its financial obligations.
From the accounting viewpoint, solvency requires that assets equal or exceed liabilities and
therefore that the total equity is non-negative. This is ascertained as of a specified date. Even
though a balance sheet may show a corporate entity to be technically insolvent by this
definition, legal insolvency is only determined through court or regulatory action to terminate
the operations of that company. In contrast, the concept of capital adequacy envisioned by
DCAT extends beyond the balance sheet at a specific date to the continued vitality of the
organization.
Accordingly, in considering the solvency of insurance operations, the amount of and expected
trends in surplus and other forms of available capital over the near future are of vital
importance, especially in terms of risk profile of the company. It is necessary to consider the
purposes of and needs for capital in relation to anticipated and possible events occurring after
the statement date.
DCAT utilizes the regulatory formula for the capital adequacy standard. For insurers
regulated under the Federal Insurance Companies Act or the Ontario Insurance Act, the
minimum regulatory capital requirement for the purposes of the DCAT standard is based upon
the MCT for a Canadian property/casualty insurer and the BAAT for a Canadian branch of a
foreign property/casualty insurer. Should an insurer be subject to minimum capital
requirements under other jurisdictions, the most restrictive requirement is used.
The company’s financial condition is deemed satisfactory if, throughout the forecast period, it
is able to meet all its future obligations under the base and all plausible adverse scenarios. In
addition, under the base scenario, it must meet the target regulatory capital requirement.
Otherwise the company’s financial condition is deemed unsatisfactory.
DCAT analysis provides the Appointed Actuary with significant information about the financial
condition of a company. The base scenario is in essence the business plan of the company
throughout the forecast period. A review of the business plan should allow the Appointed
Actuary to learn much about the company, including the following:
• Whether the company is growing or contracting through the forecast period and, if
relevant, the level at which it is growing
• Whether the company is profitable throughout the period and whether the profits are
sufficient to grow the capital base to support the growth of the company
• Planned changes in mix of business written by the company through the forecast
period
• Planned changes to reinsurance programs, investment philosophies, expenses, etc.

FINANCIAL REPORTING THROUGH THE LENS OF A PROPERTY/CASUALTY ACTUARY
Part VII. Canadian-Specific Reporting
396
Further, the adverse scenarios can reveal information about the risk management strategy
employed by the company. For example, if a scenario that tests the impact of a change in
interest rates has very little impact on the company, it is likely that the company has
employed an asset/liability matching strategy to minimize the impact of this event. Adverse
scenarios can also identify risks to which the company’s financial condition is particularly
sensitive, and the Appointed Actuary can work with management in developing mitigation
strategies to manage these risks.
FINANCIAL CONDITION TESTING
Under federal regulation, the Appointed Actuary must investigate the insurer’s financial
condition. The financial condition of an entity refers to its prospective ability to meet its
future obligations and is sometimes termed “future financial condition”. The investigation is
completed by way of Financial Condition Testing (FCT). The Appointed Actuary can
supplement FCT with the use of other means, such as the own risk solvency assessment
(ORSA).
Financial condition testing examines the effect of selected adverse scenarios on the insurer’s
forecasted capital adequacy. FCT is a process of analyzing and projecting the trends of a
company’s financial condition, given its current financial and operating circumstances, its
recent past, and its intended business plan under a variety of future scenarios. It allows the
Appointed Actuary to inform company management of the likely implications of the business
plan on capital and to provide guidance on the significant risks to which the company is
exposed.
The purpose FCT is to identify plausible threats to satisfactory financial condition, actions
that would lessen the likelihood of those threats, and actions that would mitigate a threat if it
materialized. FCT is one of several stress-testing processes that would fit within the insurer’s
overall risk management process. The FCT process allows management to understand
implications the business plan has on capital and provides awareness of the significant risks to
which the insurer is exposed
The FCT process generally consists of the following:
1. Development of a base scenario, which is typically derived from the company’s business
plan. The forecast period would be sufficiently long to be aligned with the risk emergence
and the recognition of impacts and to capture the effect of management actions.
2. Development and analysis of the impact of adverse scenarios to determine those that are
relevant to the company circumstances.
The adverse scenarios may be single-risk or an integration thereof. Possible adverse
scenarios include but not limited to risks associated with claims frequency and severity,
policy liabilities, investment and reinsurance. They are categorized as solvency or going-
concern. A solvency scenario is a plausible adverse scenario if it is credible and has a non-

FINANCIAL REPORTING THROUGH THE LENS OF A PROPERTY/CASUALTY ACTUARY
Part VII. Canadian-Specific Reporting
397
trivial chance of occurring whereas a going-concern scenario is more likely to occur and
less severe.
The approach used to determine adverse scenarios may be stochastic (based on statistical
models), deterministic (based on judgement), or a combination of the two.
3. Identification and analysis of the effectiveness of corrective management actions to
mitigate risks. Possible management actions include repricing products, reducing planned
dividends and strengthening capital.
4. Reporting on the results of the analysis
5. An opinion by the Appointed Actuary. The financial condition is deemed satisfactory if
throughout the forecast period, the following are met:
· Under the solvency scenarios, the statement value of the insurer’s assets is greater
than the statement value of its liabilities;
· Under going concern scenarios, the insurer meets the regulatory minimum capital
ratio; and
· Under the base scenario, the insurer meets its internal target capital ratio as
determined by the ORSA.
DCAT utilizes the regulatory formula for the capital adequacy standard. The report need not
include any explanation on the development and/or validity of the regulatory capital formula
used. In most cases it will suffice to disclose the following:
· The applicable federal and/or provincial regulatory formula(s);
· For insurers subject to target capital requirements under multiple jurisdictions, the
rationale for using the selected formula; and
· The target requirement used in the projections and the rationale.
FCT analysis provides the Appointed Actuary with significant information about the financial
condition of a company. The base scenario is in essence the business plan of the company
throughout the forecast period. A review of the business plan should allow the Appointed
Actuary to learn much about the company, including the following:
· Whether the company is growing or contracting through the forecast period and, if
relevant, the level at which it is growing;
· Whether the company is profitable throughout the period and whether the profits are
sufficient to grow the capital base to support the growth of the company;
· Planned changes in mix of business written by the company through the forecast
period;
· Planned changes to reinsurance programs, investment philosophies, expenses, etc.
Further, the adverse scenarios can reveal information about the risk management strategy
employed by the company. For example, if a scenario that tests the impact of a change in
interest rates has very little impact on the company, it is likely that the company has
employed an asset/liability matching strategy to minimize the impact of this event. Adverse

FINANCIAL REPORTING THROUGH THE LENS OF A PROPERTY/CASUALTY ACTUARY
Part VII. Canadian-Specific Reporting
398
scenarios can also identify risks to which the company’s financial condition is particularly
sensitive, and the Appointed Actuary can work with management in developing mitigation
strategies to manage these risks.
INDUSTRY RESEARCH
Market-Security Analysis and Research, Inc.
Market-Security Analysis and Research, Inc. (MSA) is a Canadian analytical research firm that
is focused on the Canadian insurance industry.
211
While MSA is not a rating agency, it
publishes many reports and also offers a software tool that allows for comprehensive analysis
of company and industry results in significant detail over a number of years. Canadian
insurers are also monitored by major rating agencies such as A.M. Best, Standard & Poor’s,
and Moody’s.
Individual company reports are presented by way of a number of exhibits. The first exhibit
(Exhibit 1) is titled “Key Company Information.” It presents key information about the
company’s type of license, ownership, and distribution category; identification of the
appointed actuary and external auditor; and the name of the CEO or chief agent. There is
additional information included in this exhibit for companies with publicly traded parents.
Key financial indicators are included in Exhibit 2. A number of regulatory tests and early
warning indicators are included, such as:
• The MCT/BAAT ratio
• Profitability measures such as return on equity, return on revenue, return on assets
after tax, and insurance return on net premium earned
• Liabilities as a percentage of liquid assets
• Net loss reserves to equity
• One-year loss development to equity
• Overall net leverage
The above measures are used by OSFI and other regulatory bodies as early warning solvency
indicators. In its reports, MSA flags results that fall outside of OSFI’s acceptable range. The
MCT/BAAT ratios are OSFI’s Risk-Based Capital adequacy assessment and are important
measures of a company’s financial position. If a company fails this test, it will likely be the
subject of regulatory intervention. Often companies fail certain other ratios without being in
distress; thus, the Appointed Actuary should consider results across all of the tests as a whole
when making judgments about a company’s financial position.
211
MSA Research Inc. http://www.msaresearch.com/.

FINANCIAL REPORTING THROUGH THE LENS OF A PROPERTY/CASUALTY ACTUARY
Part VII. Canadian-Specific Reporting
399
There are also supplementary ratios calculated to provide more summary-level information
about the company, including:
• Investment yield (including realized capital gains)
• Change in net premium written
• Change in gross premium written
• Change in equity
• AOCI to equity
• Reinsurance recoverable to equity
• Net underwriting leverage ratio (ratio of net premiums written to equity)
• Two-year combined ratio
• Overall diversification score

FINANCIAL REPORTING THROUGH THE LENS OF A PROPERTY/CASUALTY ACTUARY
Part VIII. The Future of SAP
400
PART VIII. THE FUTURE OF SAP
INTRODUCTION TO PART VIII
Regulation and financial reporting of insurance companies has evolved over time. The original
FASB accounting standard for insurance entities (FAS 60) was discussed and developed in the
1970s and adopted in June 1982. The NAIC codified its statutory accounting principles,
effective January 1, 2001. Today we see the implications of the work performed by the FASB
and the IASB on insurance contracts accounting and the NAIC’s Solvency Modernization
Initiative (SMI). So, what is driving change today and where are we heading?

FINANCIAL REPORTING THROUGH THE LENS OF A PROPERTY/CASUALTY ACTUARY
Part VIII. The Future of SAP
401
CHAPTER 30. THE FUTURE OF FINANCIAL REPORTING AND SOLVENCY
MONITORING OF INSURANCE COMPANIES
THE NAIC AND THE FINANCIAL SECTOR ASSESSMENT PROGRAM
In Part VI. Differences from Statutory to other Financial/Regulatory Reporting Frameworks in
the U.S., we discussed the reasons behind the development of new accounting standards for
insurance contracts by the Financial Accounting Standards Board (FASB) and the
International Accounting Standards Board (IASB), . The National Association of Insurance
Commissioners’ (NAIC) Solvency Modernization Initiative was started in part because of
pressure to conform to new and evolving international standards. In November 2008 at a G20
summit, during the global financial crisis, the G20 members agreed to undergo periodic peer
reviews of their financial services regulatory regimes. This peer review process was
developed by the International Monetary Fund and World Bank in response to the financial
crisis in the late 1990s but had mainly been applied to developing countries. This peer review
process is called the Financial Sector Assessment Program (FSAP).
The NAIC participated in the FSAP process during 2010 for the first time, and again in 2015.
The assessment process benchmarked the U.S. insurance regulatory regime against the
Insurance Core Principles (ICPs) developed and published by the International Association of
Insurance Supervisors (IAIS). The results of the 2010 assessment were generally favorable
but were based on the ICPs published in 2003. In October 2011, the IAIS published a revised
set of ICPs, with amendments to certain of the ICPs published through November 2018. This
revised set of ICPs were used to perform the 2015 FSAP review.
The 2015 FSAP concluded that while there were improvements since 2010, there remained
difficulties in assessing the health of the U.S. insurance sector. In particular:
“Capital adequacy at legal entity level, measured by the regulators’ risk-based capital (RBC)
requirements, has increased since the crisis, and the number of companies breaching
regulatory levels has declined. However, capital adequacy ratios are hard to interpret due to
valuation rules, regulatory arbitrage via captives, and lack of regulatory capital adequacy
measures at group level.”
The report also noted that one area that still poses a challenge is ICP 14, Valuation. ICP 14
states the following:
“The context and purpose of the valuation of assets or liabilities of an insurer are key factors
in determining the values that should be placed on them. This ICP considers the valuation
requirements that should be met for the purpose of the solvency assessment of insurers
within the context of IAIS risk-based solvency requirements that reflect a total balance sheet
approach on an economic basis and address all reasonably foreseeable and relevant risks.”

FINANCIAL REPORTING THROUGH THE LENS OF A PROPERTY/CASUALTY ACTUARY
Part VIII. The Future of SAP
402
ICP 14 also states that “an economic value should reflect the prospective valuation of the
future cash flows of the asset or liability allowing for the riskiness of those cash flows and the
time value of money.” Some may argue the current statutory valuation of property/casualty
liabilities does not comply with this statement as it doesn’t reflect the time value of money,
except in limited circumstance, nor the underlying risk. The 2015 FSAP found that the U.S.
insurance regulatory regime only partially observed this ICP. It recommended:
“Allowing for conservatism explicitly in a margin over current estimate would increase
transparency. The explicit decomposition of reserves into a current estimate and a margin
over current estimate allows assessment of the overall conservatism for different lines of
products. This would allow a recalibration of the valuation standard for products where
reserves are overly conservative or not sufficient.”

FINANCIAL REPORTING THROUGH THE LENS OF A PROPERTY/CASUALTY ACTUARY
Part VIII. The Future of SAP
403
COMFRAME, SOLVENCY II AND THE FEDERAL INSURANCE OFFICE
In addition to the revised set of ICPs, the IAIS has been developing a Common Framework for
the Supervision of Internationally Active Insurance Groups, commonly referred to as
ComFrame. The final framework was published in November 2019.
U.S. regulators have expressed concerns about the valuation approach under ComFrame
which requires a margin over the current estimate for valuation purposes, also known as a
GAAP plus valuation approach. U.S. regulator have instead proposed allowing an aggregation
approach based on current local requirements in determining the required amount of group
capital. As a compromise there will be a five year monitoring period to assess GAAP plus
valuation and its effect on the prescribed capital requirement versus the aggregated
approach proposed by U.S. regulators.
The Dodd-Frank Wall Street Reform and Consumer Protection Act of 2010 created the
Federal Insurance Office (FIO), which has several functions. The relevant functions are:
• To coordinate federal efforts and develop federal policy on prudential aspects of
international insurance matters, including representing the U.S., as appropriate, in the
IAIS and assisting the Treasury Secretary in negotiating covered agreements (bilateral
or multilateral agreements entered into by the U.S. regarding prudential measures
with respect to the business of insurance or reinsurance)
• To determine whether state insurance measures are preempted by covered
agreements
• To consult with the states (including state insurance regulators) regarding insurance
matters of national importance and prudential insurance matters of international
importance
Effectively, this gives the FIO the power to act like a national regulator for purposes of
negotiating the contents of ComFrame and its group capital requirement as it can preempt
state law if the director of the FIO determines that the measure “results in less favorable
treatment of a non-U.S. insurer domiciled in a foreign jurisdiction that is subject to a covered
agreement than a U.S. insurer domiciled, licensed, or otherwise admitted in that State,” and
state law “is inconsistent with a covered agreement.”
In addition to the FIO, Dodd-Frank gave the Federal government powers to regulate
systemically important financial institutions (SIFI). What financial institutions are systemically
important is determined by the Financial Stability Oversight Council, a body set up by Dodd-
Frank to reduce the risk of any one company being “too big to fail.”

FINANCIAL REPORTING THROUGH THE LENS OF A PROPERTY/CASUALTY ACTUARY
Part VIII. The Future of SAP
404
THE FUTURE
All the above activities by the NAIC, FASB, IASB, IAIS, and the FIO leave us with a very muddy
picture of how insurance liabilities will be evaluated in the future. The common theme,
though, is change, as each proposed framework differs from the current valuation of
insurance liabilities today. Several scenarios could play out that would leave us with several
different frameworks in place. Yet, any of these changes individually would have one common
result: a greater need for actuaries to perform the additional calculations and explain the
drivers of the results.

FINANCIAL REPORTING THROUGH THE LENS OF A PROPERTY/CASUALTY ACTUARY
Glossary of Terms
405
Glossary of Terms
Accepted Actuarial Practice (AAP)
The manner of performing work in accordance with rules and standards of practice as
promulgated by the relevant actuarial body, e.g., American Academy of Actuaries in
the U.S. or the Canadian Institute of Actuaries in Canada.
Accident year
The calendar year in which the accident occurs and/or the loss is incurred.
Accumulated other comprehensive income (AOCI)
The cumulative value of other comprehensive income or the total of unrealized gains
and losses on (i) available-for-sale assets such as loans, bonds and debentures and
equities; (ii) derivatives designated as cash flow hedges; (iii) foreign currency
translation; and (iv) share of other comprehensive income of subsidiaries, associates,
and joint ventures. AOCI is included on the balance sheet of a Canadian insurance
company in equity.
Actuarial Opinion Summary (AOS)
A confidential document containing the appointed actuary’s range of unpaid claim
estimates and/or point estimate, as calculated by the appointed actuary, in
comparison to the company’s recorded reserves on both a net and gross of
reinsurance basis.
Actuarial Standards Board (ASB)
“The Actuarial Standards Board (ASB) establishes and improves standards of actuarial
practice. These Actuarial Standards of Practice (ASOPs) identify what the actuary
should consider, document, and disclose when performing an actuarial assignment.
The ASB’s goal is to set standards for appropriate practice for the U.S.”
212
Actuarial Standards of Practice (ASOP)
“ASOPs are intended to provide actuaries with a framework for performing
professional assignments and to offer guidance on relevant issues, recommended
practices, documentation, and disclosure.”
213
Adjusting and other (A&O) expenses
One of the two components of loss adjustment expense, with defense and cost
containment being the other. A&O generally include all expenses associated with the
212
Actuarial Standards Board. “About the ASB.” http://www.actuarialstandardsboard.org/aboutasb.asp , 2019.
213
Actuarial Standards Board, Introduction to the Actuarial Standards of Practice,
http://www.actuarialstandardsboard.org/pdf/asops/Introduction_113.pdf , October 2008.

FINANCIAL REPORTING THROUGH THE LENS OF A PROPERTY/CASUALTY ACTUARY
Glossary of Terms
406
adjusting and recording of insurance claims, other than those included with defense
and cost containment expenses. According to the 2011 National Association of
Insurance Commissioners Annual Statement Instructions Property/Casualty, A&O
expenses are “those expenses that are correlated with claim counts or general loss
adjusting expenses.”
214
Alien insurance company
A company doing business in the U.S. that is incorporated under the laws of a country
outside the U.S.
Allocated loss adjustment expenses (ALAE)
Expenses that can be readily assigned to a specific claim, such as attorney fees.
A.M. Best Company
A global credit rating agency that serves the financial and health care service
industries. In the insurance area, Best’s Credit Ratings cover property/casualty, life,
annuity, reinsurance, captive, title and health insurance companies as well as health
maintenance organizations. A.M. Best covers thousands of insurance entities across
the globe.
American Academy of Actuaries Committee on Property and Liability Financial Reporting
(COPLFR)
“This committee monitors activities regarding financial reporting related to property
and liability risks, reviews proposals made by various organizations affecting the
actuarial aspects of financial reporting and auditing issues related to property and
liability risks, and evaluates property and liability insurance and self-insurance
accounting issues.”
215
Amortized cost
“The cost of bonds less the amortization of premium, or plus the accumulated accrual
of discount, from the date of purchase to the date of valuation.”
216
Annual Statement
A filing made annually by an insurance company to each state insurance department in
which it writes business. The filing is prepared under Statutory Accounting Principles
and includes the company’s financial statements and various supporting schedules and
exhibits.
214
2018 NAIC Annual Statement Instructions Property/Casualty, page 225.
215
American Academy of Actuaries, “Committee on Property and Liability Financial Reporting,”
http://www.actuary.org/committees/dynamic/COPLFR, 2019.
216
Insurance Accounting & Systems Association, Property Casualty Insurance Accounting, 2006.

FINANCIAL REPORTING THROUGH THE LENS OF A PROPERTY/CASUALTY ACTUARY
Glossary of Terms
407
Appointed actuary
“A qualified actuary appointed the Board of Directors, or its equivalent, or by a
committee of the Board to render a statement of actuarial opinion. ‘Qualified Actuary’
is a person who is either:
i. A member in good standing of the Casualty Actuarial Society, or
ii. A member in good standing of the American Academy of Actuaries who has
been approved as qualified for signing casualty loss reserve opinions by the
Casualty Practice Council of the American Academy of Actuaries.”
217
Assets
Resources obtained or controlled by a company as a result of past events that have a
probable future economic benefit to the company.
Authorized control level (ACL)
The level of Risk-Based Capital within which the state regulatory authority is
authorized, but not required, to take control of an insurance company. This level is
triggered when a company’s total adjusted capital is between 70% and 100% of the
ACL benchmark.
Authorized reinsurer
A reinsurer that is licensed or approved to transact insurance business in a
jurisdiction; an unauthorized reinsurer is not.
Balance sheet
The financial statement that presents all of a company’s assets and liabilities as of a
specific point in time.
Branch Adequacy of Asset Test (BAAT)
Guideline for federally regulated property/casualty insurance companies published by
the Office of the Superintendent of Financial Institutions that provides the framework
within which the Superintendent assesses whether a property/casualty company, or a
foreign branch, maintains adequate capital.
Canadian Institute of Actuaries (CIA)
The national organization of the Canadian actuarial profession.
217
2018 NAIC Annual Statement Instructions Property/Casualty, page 10.

FINANCIAL REPORTING THROUGH THE LENS OF A PROPERTY/CASUALTY ACTUARY
Glossary of Terms
408
Chartered Professional Accountants Canada (CPA Canada)
“Chartered Professional Accountants of Canada (CPA Canada) is one of the largest
national accounting organizations in the world and is a respected voice in the business,
government, education and non-profit sectors.
CPA Canada is a progressive and forward-thinking organization whose members bring
a convergence of shared values, diverse business skills and exceptional talents to the
accounting field. Domestically, CPA Canada works cooperatively with the provincial
and territorial CPA bodies who are charged with regulating the profession. Globally, it
works together with the International Federation of Accountants and the Global
Accounting Alliance to build a stronger accounting profession worldwide. As one of the
world’s largest national accounting bodies, CPA Canada carries a strong influential
voice and acts in the public interest.”
218
Cap
“An agreement obligating the seller to make payments to the buyer, each payment
under which is based on the amount, if any, that a reference price, level, performance
or value of one or more Underlying Interests exceed a predetermined number,
sometimes called the strike/cap rate or price.”
219
Carryforward of net operating losses
An accounting practice used when an insurance company has net operating losses in
one financial year and expects those losses to offset gains in the future, thereby
reducing future tax liability.
Carrying value
An initial cost of an investment adjusted over time based on the reporting entity’s
share in the company’s income.
Case development
Increases or decreases in the reserves for known claims as additional information
becomes available.
Case incurred loss
The reported value of a known claim equal to the sum of paid losses plus case
outstanding losses.
218
Chartered Professional Accountants Canada, “About Chartered Professional Accountants of Canada (CPA
Canada),” https://www.cpacanada.ca/en/the-cpa-profession/about-cpa-canada, 2019.
219
2018 NAIC Annual Statement Instructions Property/Casualty, page 373.

FINANCIAL REPORTING THROUGH THE LENS OF A PROPERTY/CASUALTY ACTUARY
Glossary of Terms
409
Case outstanding loss
The reserve for a known claim, or case reserve, generally established by the
company’s claims administrator(s)/handler(s) based either on the facts of the
particular claim or based on formula.
Case reserves
See definition for case outstanding loss
Cash flow statement
A statement that presents a company’s operations strictly from a cash perspective.
Ceded reinsurance premiums payable
Premiums that are owed to reinsurers relating to ceded reinsurance.
Ceding commission
A fee paid by the reinsurer to the insurance company (ceding company) for the
reinsurance transaction. The fee is generally expected to reimburse the insurer for
policy acquisition expenses.
Certified public accountant (CPA)
“Professional accountant who has passed the uniform CPA examination administered
by the American Institute Of Certified Public Accountants, and has fulfilled the
educational and work related experience requirements for certification.”
220
Claim frequency
The rate of claim occurrence, typically calculated as the ratio of claim counts to
exposures.
Claim severity
The average cost of a claim, typically calculated as the ratio of losses to claim counts.
Claims-made policy
An insurance policy covering claims that arise on or after the policy retroactive date
and are reported during the term of the policy. The retroactive date may be a date
many years before the purchase of the policy. Therefore, a claims-made policy may
cover claims made today that result from actions that occurred any time after the
retroactive date.
220
BusinessDictionary.com, Definitions, http://www.businessdictionary.com/definition/certified-public-
accountant-CPA.html, 2019.

FINANCIAL REPORTING THROUGH THE LENS OF A PROPERTY/CASUALTY ACTUARY
Glossary of Terms
410
Collar
“An agreement to receive payments as the buyer of an Option, Cap or Floor and to
make payments as the seller of a different Option, Cap or Floor.”
221
Common capital stock
A surplus account that is equal to the par value of common stocks that were issued.
Common stock
A type of stock holding that confers voting privileges and may pay a dividend, though
the dividend is not guaranteed.
Commutation of ceded reinsurance
The agreement to fully settle all current and future liabilities associated with a
reinsurance agreement for a set payment from the reinsurer.
Commuting a claim
A process in which one party is relieved of its obligations in respect of the claim in
exchange for a cash payment.
Contingent commissions
Additional commissions paid by an insurance company to its broker if certain volume
and/or profit targets are met.
Contingent liabilities
Amounts for which the insurance company may be held responsible but for which the
balance is not currently determinable.
Credit risk
A risk that the counterparty will default (or not pay in whole or in part) and the
estimation risk associated with amounts recorded for those receivables.
Defense and cost containment (DCC)
One of the two components of loss adjustment expense, with adjustment and other
expense being the second. DCC generally includes defense, litigation and medical cost
containment expenses, whether internal or external. According to the 2011 NAIC
Annual Statement Instructions Property/Casualty, DCC expenses are “those that are
correlated with the loss amounts.”
222
221
2018 NAIC Annual Statement Instructions Property/Casualty, page 373.
222
Ibid., page 225.

FINANCIAL REPORTING THROUGH THE LENS OF A PROPERTY/CASUALTY ACTUARY
Glossary of Terms
411
Deferred acquisition costs (DAC)
An asset that is established under U.S. Generally Accepted Accounting Principles to
defer the recognition of acquisition expenses to match the recognition of revenue of
insurance companies.
Deferred tax assets (DTAs)
Expected future tax benefits related to amounts previously recorded in the statutory
financial statements and not expected to be reflected in the tax return as of the
reporting date.
Derivatives
Financial contracts between two parties for which the value is dependent upon the
performance of other assets or variables. Examples include options, warrants, caps,
floors, collars, swaps, forwards and futures.
Discount rate
The term commonly used when referring to the rate at which the present value of cash
flows are calculated.
Discovery year
A calendar year in which a loss or damage is discovered.
Dividends received deduction (DRD)
In the case of corporate stockholders, DRDs are certain allowances that are made to
reduce tax on dividends to avoid triple taxation when the Company in turn dividends
earnings to their investors.
Dynamic Capital Adequacy Testing (DCAT)
A process of analyzing and projecting the trends of a company’s financial condition
given its current financial and operating circumstances, its recent past, and its
intended business plan under a variety of future scenarios.
Earned but unbilled premiums
Estimated adjustments that will occur to the premium on policies where the actual
amount of premium depends on an exposure measure (such as payroll) that is
unknown until the end of the policy period.
Encumbrance
An impediment or claim on an asset made by a party that restricts the value of asset
from complete use by the owner until the owner clears its obligation to the other
party. An example is a lien on a property.

FINANCIAL REPORTING THROUGH THE LENS OF A PROPERTY/CASUALTY ACTUARY
Glossary of Terms
412
Equity method
A method under which investments in insurance company subsidiary, controlled and
affiliated entities (SCAs) are recorded based on the reporting entity’s proportionate
share of audited statutory equity of the SCA’s balance sheet, adjusted for any
unamortized goodwill.
Excess treaty reinsurance
A contract under which the reinsurer responds to claims during the treaty period
excess of a specified threshold to a specified limit.
Exhibit of Capital Gains (Losses)
An Annual Statement exhibit that shows the split of the gains (losses) between those
gains (losses) that were realized on the sale or maturity of an asset and those due to
impairments.
Exhibit of Net Investment Income
An Annual Statement exhibit that differentiates between the amount of income
collected and the amount of income earned in the year and describes the deductions
for investment expenses and other costs.
Facultative reinsurance
A reinsurance contract that is negotiated separately for each insurance policy that is
reinsured. Facultative reinsurance is purchased for individual risks that are not
covered, or not adequately covered, by the insurer’s treaty reinsurance.
Fair value
The value at which an asset or liability could be bought or sold for in the open market.
Financial Accounting Standards Board (FASB)
A private organization providing authoritative accounting guidance for non-
governmental entities. It has the responsibility of developing and establishing U.S.
Generally Accepted Accounting Principles, with the Securities and Exchange
Commission operating in an overall monitoring role over the application of the
accounting standards by public companies.
Floor
“An agreement obligating the seller to make payments to the buyer, each payment
under which is based on the amount, if any, that a predetermined number, sometimes

FINANCIAL REPORTING THROUGH THE LENS OF A PROPERTY/CASUALTY ACTUARY
Glossary of Terms
413
called the strike/floor rate or price exceeds a reference price, level, performance or
value of one or more Underlying Interests.”
223
Forward
“An agreement (other than a Future) to make or take delivery of, or effect a cash
settlement based on, the actual or expected price, level, performance or value of one
or more Underlying Interests.”
224
Future
“An agreement traded on an exchange, Board or Trade or contract market to make or
take delivery of, or effect a cash settlement based on, the actual or expected price,
level, performance or value of one or more Underlying Interests.”
225
General expenses
Insurance company operating and administrative expenses other than those that
relate directly to the acquisition of the business or ongoing policy maintenance costs
incurred by an insurance company.
General Interrogatories
A series of questions that the insurance company is required to respond to within its
Annual Statement.
Generally Accepted Accounting Principles (GAAP)
An accounting framework that provides a consistent set of rules under which publicly
traded and privately held companies report their financial transactions.
Goodwill
An intangible asset that results from the excess of the price paid for an acquired entity
and its book value (for U.S. SAP) or fair value (for U.S. GAAP). It represents the value
perceived by the buyer in the company for things like customer relationships or trade
name, which are not physical or material assets but can be bought or sold due to their
relevance to the company’s future profitability.
Governmental Accounting Standards Board (GASB)
“…the independent private-sector organization…, that establishes accounting and
financial reporting standards for U.S. state and local governments that follow
generally accepted accounting principles (GAAP).”
226
223
2018 NAIC Annual Statement Instructions Property/Casualty, page 373.
224
Ibid., page 373.
225
Ibid., page 374.
226
GASB, “About the GASB” https://www.gasb.org/jsp/GASB/Page/GASBSectionPage&cid=1176168081485, 2019.

FINANCIAL REPORTING THROUGH THE LENS OF A PROPERTY/CASUALTY ACTUARY
Glossary of Terms
414
Income statement
A statement that describes a company’s gain or loss in net income during a specific
time period.
Incurred but not reported (IBNR)
The reserve for claims that have been incurred but not yet reported to the insurance
company. IBNR includes a provision for development on known claims (“case
development”), a provision purely for those claims that are incurred but not yet
reported to the insurance carriers (“pure IBNR”), and reopened claims.
Insurance Expense Exhibit (IEE)
An Annual Statement exhibit that enables regulators to dive deeper into an insurance
company’s profitability by examining profitability by line of business on a direct and
net of reinsurance basis.
Insurance Regulatory Information System (IRIS)
A collection of analytical solvency tools and databases designed to provide state
insurance departments with an integrated approach to screening and analyzing the
financial condition of insurers. IRIS is used to assist each state in prioritizing which
companies need additional regulatory attention.
Insurance contract
A contract under which one party (the insurer) accepts significant insurance risk from
another party (the policyholder) by agreeing to compensate the policyholder if a
specified uncertain future event (the insured event) adversely affects the policyholder.
Insurance or underwriting risk
The risk of an insurance company associated with issuing insurance policies.
Intercompany pooling
A common arrangement among companies in a group in which each participant fully
cedes all of its business to the lead insurance company of the pool, and then each
participant assumes back a specific percentage of the total.
Interest rate risk
The risk of loss from changes in interest rates impacting interest-rate-sensitive assets
and liabilities.

FINANCIAL REPORTING THROUGH THE LENS OF A PROPERTY/CASUALTY ACTUARY
Glossary of Terms
415
Internal Revenue Service (IRS)
The U.S. government agency that is responsible for establishing tax laws and
collecting taxes.
Internal Target Capital Ratio
The ratio determined by an insurance company intended to provide capacity to
withstand unexpected losses beyond those covered by the minimum capital ratio.
Canadian property and casualty companies are asked by the Office of the
Superintendent of Financial Institutions to establish their own internal target capital
ratio.
International Accounting Standards Board (IASB)
“The Board is an independent group of experts with an appropriate mix of recent
practical experience in setting accounting standards, in preparing, auditing, or using
financial reports, and in accounting education…Board members are responsible for the
development and publication of IFRS Standards including the IFRS for SMEs Standard.
The Board is also responsible for approving interpretations of IFRS Standards as
developed by the IFRS Interpretations Committee (formerly IFRIC).”
227
International Financial Reporting Standards (IFRS)
The accounting standards promulgated by the International Accounting Standards
Board typically used for financial reporting by companies licensed in countries outside
of the U.S.
Investment affiliate
An affiliate, other than a holding company, engaged or organized primarily to engage
in the ownership and management of investments for the insurer. Investment affiliates
exclude entities that manage funds of organizations other than the parent.
Letters of credit
Issued by a bank to guarantee that payment will be made by a borrower to the lender.
In the case of reinsurance transactions, a letter of credit guarantees that the reinsurer
will be able to meet its obligations to the reinsured. The bank typically charges for this
guarantee as a percent of its value. The percentage rate generally rises during periods
of uncertain economic times.
Liability
An obligation that the company must fulfill based on past events or transactions that
will require the use of monetary resources.
227
IFRS Foundation, “About the International Accounting Standards Board (Board),”
https://www.ifrs.org/groups/international-accounting-standards-board/, 2019.

FINANCIAL REPORTING THROUGH THE LENS OF A PROPERTY/CASUALTY ACTUARY
Glossary of Terms
416
Liquidity/Illiquidity premium
In a situation when the ability to readily trade the asset results in a lower discount rate
being applied to the tradable asset’s future cash flows than that of the privately held
asset, the difference in the discount rates is the liquidity/illiquidity premium for the
privately held asset.
Loss adjustment expense (LAE)
Expenses associated with the handling of a claim from the time it is reported to the
insurance company until the time it is closed. LAE includes allocated loss adjustment
expenses (ALAE) and unallocated loss adjustment expenses (ULAE). The National
Association of Insurance Commissioners currently uses the defense and cost
containment (DCC) and adjusting and other (A&O) expenses to comprise the two forms
of LAE. While LAE in total is equivalent under either the ALAE/ULAE or DCC/A&O
definitions, it is the segregation of expenses between the two that differs. DCC
generally includes defense, litigation and medical cost containment expenses, whether
internal or external, and A&O includes all expenses associated with adjusting and
recording policy claims, other than those included with DCC.
Mandatorily convertible security
A security that is required to be exchanged for another type of security at a specified
price that differs from the market price at the time of conversion.
Market-Security Analysis & Research (MSA)
A Canadian analytical research firm that is focused on the Canadian insurance
industry.
Market valuation approach
A valuation approach in which an investment by an insurance company in subsidiary,
controlled and affiliated entities (SCAs) is based on the market value of the SCA,
adjusted for the reporting entity’s ownership percentage.
Maximum net deferred policy acquisition expense (DPAE)
A ceiling to the amount of the DPAE asset that a property/casualty insurance company
may record on its financial statements in Canada.
Minimum capital ratio
Minimum Capital Test (MCT) ratio of 100%.

FINANCIAL REPORTING THROUGH THE LENS OF A PROPERTY/CASUALTY ACTUARY
Glossary of Terms
417
Minimum capital requirement (MCR)
The smallest level of capital at which a company would be permitted to operate in
Canada per the Office of the Superintendent of Financial Institutions.
Minimum capital test (MCT)
Guideline for Federally Regulated Property and Casualty Insurance Companies
published by the Office of the Superintendent of Financial Institutions that provides
the framework within which the Superintendent assesses whether a property/casualty
company, or a foreign branch, maintains adequate capital. MCT compares capital
available to capital required.
Mortgage-backed security (MBS)
“Debt instrument secured by a mortgage or a pool of mortgages (but not conveying a
right of ownership to the underlying mortgage). Unlike unsecured securities, they are
considered 'investment grade,' and are paid out of the income generated by principle
and interest payments on the underlying mortgage. It is a type of mortgage
derivative.”
228
We note that there can be MBS securities designated by the NAIC at 3
through 6, which would be equivalent to a below investment grade designation for
bonds.
National Association of Insurance Commissioners (NAIC)
Serves as an organization of state regulators that facilitates and coordinates
governance of insurance companies across the U.S.
NAIC Model Investment Law
Allows for two alternative types of investment guidelines:
1. The defined limit system of investment guidelines follows a rule-based
approach and prescribes specific quantitative limits for the invested assets
that a company may hold.
2. The prudent person system of investment guidelines follows a principles-based
approach and requires an insurance company to develop its own investment
guidelines.
NAIC’s Securities Valuation Office (SVO)
“The National Association of Insurance Commissioners’ Securities Valuations Office
(SVO), one of three groups within the Capital Markets & Investment Analysis Office, is
responsible for the day-to-day credit quality assessment of securities owned by state
regulated insurance companies. Insurance companies report ownership of securities
228
BusinessDictionary.com, Definitions, http://www.businessdictionary.com/definition/mortgage-backed-
security.html, 2019.

FINANCIAL REPORTING THROUGH THE LENS OF A PROPERTY/CASUALTY ACTUARY
Glossary of Terms
418
to the Capital Markets and Investment Analysis Office when such securities are eligible
for filing on Schedule D, DA or BA of the NAIC Financial Statement Blank.”
229
Net income/Net loss
The difference between the amount of the revenues and expenses during the period. It
is referred to as net income if it is positive and net loss if it is negative.
Net investment income earned
Interest and dividends received on investment assets held over the course of the year,
net of investment expenses including any associated taxes.
Net realized capital gain (loss)
Income received related to changes in the value of investment assets that are held
under U.S. SAP, net of any associated taxes.
Nonadmitted assets
Assets that are not recognized by state insurance departments in evaluating the
solvency of an insurance company for statutory accounting purposes.
Notes to Financial Statements
Qualitative and quantitative disclosures made by a company to further explain the
balances shown in its financial statements.
Off-balance sheet and other items
Amounts that are not recorded by the insurance company in its statutory financial
statements yet still represent assets and/or potential liabilities of the insurance
company and therefore expose the company to risk.
Office of the Superintendent of Financial Institutions (OSFI)
The organization that supervises all federally regulated financial institutions, monitors
federally regulated pension plans and provides actuarial advice to the Government of
Canada.
Option
“An agreement giving the buyer the right to buy or receive, sell or deliver, enter into,
extend or terminate, or effect a cash settlement based on the actual or expected price,
level, performance or value of one or more Underlying Interests.”
230
229
Per the description of the Securities Valuation Office on the NAIC and The Center for Insurance Policy and
Research website, http://www.naic.org/svo.htm, 2019.
230
2018 NAIC Annual Statement Instructions Property/Casualty, page 373.

FINANCIAL REPORTING THROUGH THE LENS OF A PROPERTY/CASUALTY ACTUARY
Glossary of Terms
419
Other comprehensive income (OCI)
Changes in unrealized gains and losses on (i) available for sale assets such as loans,
bonds and debentures and equities; (ii) derivatives designated as cash flow hedges; (iii)
foreign currency translation; and (iv) share of OCI of subsidiaries, associates and joint
ventures. OCI is required by U.S. GAAP and International Financial Reporting
Standards.
Overdue authorized reinsurance
Reinsurance for which the amount of paid loss and loss adjustment expense
recoverable is more than 90 days past due for reasons other than dispute between the
insurance company and the reinsurer.
Own risk self-assessment (ORSA)
The entirety of the processes and procedures employed to identify, assess, monitor,
manage and report the short- and long-term risks a (re) insurance undertaking faces or
may face and to determine the own funds necessary to ensure that the undertaking’s
overall solvency needs are met at all times.
Paid losses
Amounts paid by the insurance carrier for insured claims.
Par value
An amount set by the issuer of a stock when the stock is initially offered, which serves
as a minimum value for which the stock can be sold in that initial offering.
Policyholder dividend
A return to the policyholder of a portion of the premium that was originally paid by the
policyholder. There are typically state requirements that must be met for a company
to pay dividends.
Preferred stock
A stock holding that does not confer voting privileges but usually provides a guarantee
on dividends to be paid and usually has preference to common stock in the event of
liquidation.
Premium deficiency reserve
A reserve that must be recorded when the unearned premium of in-force business is
not sufficient to cover the losses, loss adjustment expense and other expenses that
will arise when that premium is earned.

FINANCIAL REPORTING THROUGH THE LENS OF A PROPERTY/CASUALTY ACTUARY
Glossary of Terms
420
Proportional treaty
A contract under which the reinsurer receives a set proportion of all premiums subject
to the treaty, net of ceding commission, and in return pays the same proportion of all
claims subject to the treaty.
Protected cell company
A company that comprises individual cells, each with its own assets, liabilities and
equity, but that also has access to a part of the company’s overall capital. The liability
to each cell is limited such that creditors to one cell cannot look to another cell or the
company as a whole for assets.
Provision for adverse deviation (PfAD)
A provision required in Canada for adverse deviation in a company’s loss reserves
determined by increasing the value of variables used in the reserve estimation
process.
Provision for reinsurance
A penalty for reinsurance recoverables that may not be collectible. The amount of this
provision is a reduction to surplus. This penalty applies to unauthorized reinsurers that
do not provided full collateral, that are slow to pay or that have disputed amounts
owed to the ceding company, as well as the authorized reinsurers that are slow to pay
or that have disputed amounts that are owed to the ceding company.
Regulation S-X
The Securities and Exchange Commission’s regulation that contains general
instructions to all companies around the composition and presentation of financial
statements
Reinsurance contract
Oftentimes considered insurance for insurance companies, a contract under which one
party (the insurer or reinsured) transfers risk to another party (the reinsurer) to
protect the insurer (reinsured) from financial loss.
Replication (synthetic asset) transaction
A derivative transaction entered into in conjunction with other investments to
reproduce the investment characteristics of otherwise permissible investments.
Report year
A calendar year in which losses are reported.

FINANCIAL REPORTING THROUGH THE LENS OF A PROPERTY/CASUALTY ACTUARY
Glossary of Terms
421
Reported loss
Amount of paid plus case outstanding losses incurred by an insurance company. It
represents the dollar value of loss known to the insurance company. Reported loss is
synonymous with the term case incurred loss.
Reserve risk
The risk that a reporting entity’s loss and loss adjustment expense reserves will
develop adversely.
Retroactive date
The date specified in a claims-made insurance policy that defines the first day on which
incurred losses are covered under the policy.
Retroactive reinsurance
Reinsurance that is purchased for liabilities that occurred in the past (i.e., prior to the
effective date of the reinsurance policy).
Revenue offset
A reduction in earned premium to account for a lack of deferred acquisition costs.
Review date
The valuation date through which material information known to the actuary is
included in forming the reserve opinion.
Risk-Based Capital (RBC)
A solvency framework developed by the National Association of Insurance
Commissioners from which an amount of capital is determined formulaically based on
the application of specified factors to an insurance company’s admitted assets and
liabilities recorded as of year-end. The calculated amount, or RBC, is compared to the
total adjusted capital for the insurance company at year-end to determine the level, if
any, of company or regulatory action required from a solvency perspective.
Risk-Based Capital ratio (RBC ratio)
The ratio of total adjusted capital to the authorized control level benchmark computed
under the National Association of Insurance Commissioners RBC framework.
Schedule A
A schedule within an Annual Statement that provides information on real estate
directly owned by the insurance company.

FINANCIAL REPORTING THROUGH THE LENS OF A PROPERTY/CASUALTY ACTUARY
Glossary of Terms
422
Schedule B
A schedule within an Annual Statement that provides information on mortgage loans
owned by the insurance company that are backed by real estate.
Schedule BA
A schedule within an Annual Statement that provides information on other long-term
invested assets owned by the insurance company. These are assets not included in any
of the other invested asset schedules, such as real estate that is not owned directly by
the insurance company and therefore excluded from Schedule A.
Schedule D
A schedule within an Annual Statement that provides information on bonds and stocks
owned by the insurance company.
Schedule DA
A schedule within an Annual Statement that provides information on short-term
investments owned by the insurance company. The schedule includes all investments
whose maturities (or repurchase dates under repurchase agreement) at the time of
acquisition were one year or less except those defined as cash or cash equivalents in
accordance with SSAP No. 2R, Cash, Cash Equivalents, Drafts and Short-term
Investments.
Schedule DB
A schedule within an Annual Statement that provides the number of contracts for each
derivative and the notional amount, which represents the number of units of the
underlying asset that are involved.
Schedule DL
A schedule within an Annual Statement that provides information on securities lending
reinvested assets.
Schedule E
A schedule within an Annual Statement that provides information on the insurance
company’s cash and cash equivalents.
Schedule F
A schedule within an Annual Statement that provides information on an insurance
company’s assumed and ceded reinsurance transactions.

FINANCIAL REPORTING THROUGH THE LENS OF A PROPERTY/CASUALTY ACTUARY
Glossary of Terms
423
Schedule P
A schedule within an Annual Statement that provides loss and loss expenses reserves
gross and net and also breaks down the total reserves by line of business and accident
year.
Schedule P interrogatories
A series of questions that the insurance company is required to answer to provide
further insight into the information reported in Schedule P.
Schedule T
A schedule within an Annual Statement that provides an allocation of its contents by
U.S. state (50) and the District of Columbia, as well as five U.S. territories (American
Samoa, Guam, Puerto Rico, U.S. Virgin Islands and Northern Mariana Islands), Canada,
and “aggregate other alien” territories.
Securities and Exchange Commission (SEC)
The authoritative body for establishing accounting and reporting standards for publicly
traded companies in the U.S.
Solvency capital requirement (SCR)
An amount of capital required to limit the probability of ruin over the forthcoming year
to 0.5%.
Statement of Actuarial Opinion (SAO)
The opinion of a qualified actuary on the reasonableness of the loss and loss
adjustment expense reserves recorded by a property/casualty insurance company as
of December 31 each year.
Statement of cash flows
A statement that shows cash inflows and outflows from a company’s operations,
investments, financing and other sources, the net value of which is included as the
value of cash and cash equivalents (and short-term investments under U.S. SAP) that
is shown on the on the balance sheet at the end of the reporting period.
Statement of Changes in Equity exhibit
A statement included within the financials of a Canadian insurance company
Illustrating the change in equity across the various classes of equity (e.g., share
capital, retained earnings, available for sale financial assets) resulting from various
transactions or events such as issue of share capital, total comprehensive income for
the year, dividends, etc.

FINANCIAL REPORTING THROUGH THE LENS OF A PROPERTY/CASUALTY ACTUARY
Glossary of Terms
424
Statement of retained earnings
A statement included within the financials of a Canadian insurance company that
provides the calculation of the retained earnings for the insurance company at the end
of the reporting period.
Statutory Accounting Principles (SAP)
The accounting framework that all U.S. insurance companies are required to report
under for state regulatory purposes: “accounting principles or practices prescribed or
permitted by an insurer’s domiciliary state”
231
Structured settlements
A situation where an insurance company settles a claim by purchasing an annuity on
behalf of a claimant.
Surplus (policyholders’ surplus)
The difference between assets and liabilities is generally referred to as net worth, and,
in the specific case of an insurance company under statutory accounting, it is referred
to as surplus.
Surplus aid
An amount of enhancement to surplus in the current period as a result of ceding
commission that has been taken into income on its ceded unearned premium.
Surplus ratio
A ratio of mean policyholders’ surplus to the sum of mean net loss and loss adjustment
reserves, mean net unearned premium reserves and current year net earned
premiums, in total for all lines combined.
Swap
“An agreement to exchange or net payments at one or more times based on the actual
or expected price, level, performance or value of one or more Underlying Interests or
upon the probability occurrence of a specified credit or other event.”
232
Tabular reserves
Indemnity reserves that are calculated using discounts determined with reference to
actuarial tables that incorporate interest and contingencies such as mortality,
remarriage, inflation or recovery from disability applied to a reasonably determinable
payment stream. This definition does not include medical loss reserves or any LAE
reserves.
231
NAIC, Accounting Practices and Procedures Manual, Volume I, March 2019, page P-2.
232
2018 NAIC Annual Statement Instructions Property/Casualty, page 373.

FINANCIAL REPORTING THROUGH THE LENS OF A PROPERTY/CASUALTY ACTUARY
Glossary of Terms
425
Tail coverage
Coverage issued as an endorsement to a claims-made policy that covers claims
incurred after the retroactive date but reported to the insurer subsequent to the
claims-made policy expiration date.
Tax-basis earned premium
Earned premium adjusted for a revenue offset.
Tax-basis incurred losses and expenses
Statutory calendar-year incurred paid losses plus the change in discounted loss
reserves.
Total comprehensive income
Net income as reported by Canadian insurance companies on the Statement of Income
plus other comprehensive income.
Treaty reinsurance
A reinsurance contract that applies to all or a portion of an insurance company’s
policies written during the term of the reinsurance agreement, typically a calendar
year.
Unallocated loss adjustment expenses (ULAE)
Expenses associated with the handling of claims that are not generally assigned to a
particular claim, such as salaries for adjustors and utility costs.
Underwriting income
Earned premium minus loss and LAE incurred and other underwriting expenses
incurred.
Unearned commissions
Ceding commissions from reinsurance that are not yet earned by the insurance
company.
Unearned premiums
The premium that corresponds to the time period remaining on an insurance policy
prior to expiration.
Unpaid loss (or loss reserve)
Amount of case outstanding plus incurred but not reported reserves. It represents the
remaining amount expected to be paid on claims incurred by the insurance company.

FINANCIAL REPORTING THROUGH THE LENS OF A PROPERTY/CASUALTY ACTUARY
Glossary of Terms
426
Value at risk
“Largest loss likely to be suffered on a portfolio position over a holding period (usually
1 to 10 days) with a given probability (confidence level). VAR is a measure of market
risk, and is equal to one standard deviation of the distribution of possible returns on a
portfolio of positions. ”
233
Warrant
“An agreement that gives the holder the right to purchase an underlying financial
instrument at a given price and time or at a series of prices and times according to a
schedule or warrant agreement.”
234
Written premium risk
A risk that future business written by the company will be unprofitable.
Yield curve
“Graph used typically to show yields for different bond maturities and used for
determining the best value in bonds and as an economic indicator. Positive (upward
sloping) curve indicates an expanding economy whereas a flat or negative (downward
sloping) curve indicates a slowing or contracting economy.”
235
233
BusinessDictionary.com, Definitions, http://www.businessdictionary.com/definition/value-at-risk-VAR.html,
2019.
234
2018 NAIC Annual Statement Instructions Property/Casualty, page 373.
235
BusinessDictionary.com, Definitions, http://www.businessdictionary.com/definition/yield-curve.html, 2019.

FINANCIAL REPORTING THROUGH THE LENS OF A PROPERTY/CASUALTY ACTUARY
Appendices
427
APPENDICES

FINANCIAL REPORTING THROUGH THE LENS OF A PROPERTY/CASUALTY ACTUARY
Appendix I. Fictitious Insurance Company
APPENDIX I. FICTITIOUS INSURANCE COMPANY
EXCERPTS FROM THE 2018 ANNUAL STATEMENT FOR FICTITIOUS INSURANCE
COMPANY

ANNUAL STATEMENT
* * Selected Excerpts ONLY * *
OF THE
2018
FICTITIOUS INSURANCE COMPANY
Of
Sunny City
in the state of Florida
to the Insurance Department
of the state of Florida
For the Year Ended
December 31, 2018

Prior Year
1 2 3 4
Assets
Non-Admitted
Assets
Net Admitted
Assets
(Cols. 1 - 2)
Net
Admitted Assets
1. Bonds (Schedule D)...................................................................................................................... 58,676,000................. 0............................. 58,676,000....... 58,861,000...........
2. Stocks (Schedule D):
2.1 Preferred Stocks................................................................................................................... 34,000........................ 0............................. 34,000.............. 35,000..................
2.2 Common Stock...................................................................................................................... 19,408,000................. 68,000.................... 19,340,000....... 19,081,000...........
3. Mortgage Loans on real estate (Schedule B):
3.1 First Liens............................................................................................................................. 238,000...................... 0............................. 238,000............ 245,000................
3.2 Other than first liens.............................................................................................................. 7,000.......................... 0............................. 7,000................ 0...........................
4. Real Estate (Schedule A):
4.1 Properties Occupied by the company (less $.…..0 Encumbrances)..................................... 453,000...................... 0............................. 453,000............ 472,000................
4.2 Properties held for the production of income (less $.…..0 Encumbrances).......................... 3,359,000................... 0............................. 3,359,000......... 3,274,000.............
4.3 Properties held for sale (less $.…..0 encumbrances)........................................................... 33,000........................ 0............................. 33,000.............. 0...........................
5.
Cash ($…...153,000 Sch. E-Part 1), cash equivalents ($......0 Sch. E-Part 2) and short-term
investments ($......829,000, Sch DA)……………………………………..
983,000...................... 0............................. 983,000............ 1,233,000.............
6. Contract loans (Including $0 premium notes)............................................................................... 0................................. 0............................. 0....................... 0...........................
7. Derivatives (Schedule DB)............................................................................................................ 0................................. 0............................. 0....................... 0...........................
8. Other invested assets (Schedule BA)........................................................................................... 4,726,000................... 98,000.................... 4,628,000......... 4,405,000.............
9. Receivables for securities............................................................................................................. 0................................. 0............................. 0....................... 0...........................
10. Securities lending reinvested collateral assets (Schedule DL)..................................................... 79,000........................ 0............................. 79,000.............. 183,000................
11. Aggregate write-ins for invested assets........................................................................................ (5,000)......................... 0............................. (5,000)............... (5,000)...................
12. Subtotal, cash and invested assets (Lines 1 to 11)....................................................................... 87,991,000................. 166,000.................. 87,825,000....... 87,784,000...........
13. Title plants less $...0 charged off (For Title insurers only)............................................................ 0................................. 0............................. 0....................... 0...........................
14. Investment income due and accrued............................................................................................ 726,000...................... 0............................. 726,000............ 750,000................
15. Premiums and Considerations:
15.1 Uncollected premiums and agent's balances in course of collection.................................. 2,870,000................... 244,000.................. 2,626,000......... 2,866,000.............
15.2 Deferred premiums, agents balances and installments booked but deferred and not yet
due (Including $... 60,000 earned but unbilled premium)……………………
5,153,000................... 39,000.................... 5,114,000......... 4,927,000.............
15.3 Accrued retrospective premium ($...0) and contracts subject to redetermination ($...0).... 254,000...................... 4,000...................... 250,000............ 263,000................
16. Reinsurance:
16.1 Amounts recoverable from reinsurers................................................................................. 426,000...................... 0............................. 426,000............ 451,000................
16.2 Funds held by or deposited with reinsured companies....................................................... 0................................. 0............................. 0....................... 0...........................
16.3 Other amounts receivable under reinsurance contracts...................................................... 0................................. 0............................. 0....................... 0...........................
17. Amounts receivable relating to uninsured plans........................................................................... 0................................. 0............................. 0....................... 0...........................
18.1 Current federal and foreign income tax recoverable and interest thereon.................................... 233,000...................... 0............................. 233,000............ 0...........................
18.2 Net deferred tax asset................................................................................................................... 3,082,000................... 878,000.................. 2,204,000......... 1,979,000.............
19. Guaranty funds receivable or on deposit...................................................................................... 9,000.......................... 0............................. 9,000................ 14,000..................
20. Electronic data processing equipment and software..................................................................... 1,000.......................... 0............................. 1,000................ 1,000....................
21. Furniture and equipment, including health care delivery assets( $...0)......................................... 88,000........................ 88,000.................... 0....................... 0...........................
22. Net adjustment in assets and liabilities due to foreign exchange rates........................................ 0................................. 0............................. 0....................... 0...........................
23. Receivables from parent, subsidiaries and affiliates..................................................................... 0................................. 0............................. 0....................... 0...........................
24. Health care ($...0) and other amounts receivable......................................................................... 0................................. 0............................. 0....................... 0...........................
25. Aggregate write-ins for other than invested assets....................................................................... 621,000...................... 35,000.................... 586,000............ 641,000................
26.
Total Assets excluding Separate Accounts, segregated Accounts and Protected
Cell Accounts (Lines 12 to 25)…………………………………………………………….
101,454,000............... 1,454,000............... 100,000,000..... 99,676,000...........
27. From Separate Accounts, Segregated Accounts and Protected Cell Accounts............................ 0................................. 0............................. 0....................... 0...........................
28. TOTALS (Lines 26 and 27)........................................................................................................... 101,454,000............... 1,454,000............... 100,000,000..... 99,676,000...........
2
Current Year
ANNUAL STATEMENT FOR THE YEAR 2018 OF THE FICTITIOUS INSURANCE COMPANY
ASSETS

1 2
Current Year Prior Year
1. Losses (Part 2A, Line 35, Column 8)............................................................................................................................................. 41,894,000........ 40,933,000......
2. Reinsurance payable on paid losses and loss adjustment expenses (Schedule F , Part 1, Column 6)......................................... 0........................ 0......................
3. Loss adjustment expenses (Part 2A, Line 35, Col 9)..................................................................................................................... 9,663,000.......... 9,664,000........
4. Commissions payable, contingent commissions and other similar charges.................................................................................. 763,000............. 721,000...........
5. Other expenses (excluding taxes, licenses, and fees)................................................................................................................... 668,000............. 658,000...........
6. Taxes, licenses, and fees (excluding federal and foreign income taxes)....................................................................................... 501,000............. 523,000...........
7.1 Current federal and foreign income taxes (including $...0 on realized capital gains (losses))....................................................... 0........................ 120,000...........
7.2 Net deferred tax liability.................................................................................................................................................................. 0........................ 0......................
8. Borrowed money $ …. 0 and interest thereon $.... 0….................................................................................................................. 0........................ 0......................
9.
Unearned Premiums (Part 1A, Line 38, Col 5)(after deducting unearned premiums for ceded reinsurance of $ 920,000 and
including warranty reserves of $...0 and accrued accident and health experience rating refunds including $...0 for medical loss
ratio rebate per the Public Health Service Act).............................................................................................................
11,895,000........ 11,557,000......
10. Advance premium.......................................................................................................................................................................... 0........................ 0......................
11. Dividends declared and unpaid:
11.1 Stockholders........................................................................................................................................................................ 1,500,000.......... 1,500,000........
11.2 Policyholders........................................................................................................................................................................ 62,000............... 50,000.............
12. Ceded reinsurance premiums payable (net of ceding commissions)............................................................................................. 440,000............. 608,000...........
13. Funds held by company under reinsurance treaties (Schedule F, Part 3, Col 20)......................................................................... 170,000............. 128,000...........
14. Amounts withheld or retained by account of others....................................................................................................................... 308,000............. 255,000...........
15. Remittances and items not allocated............................................................................................................................................. 57,000............... 28,000.............
16. Provision for reinsurance (including $....13,000 certified) (Schedule F, Part 3, Column 78).......................................................... 283,000............. 272,000...........
17. Net adjustments in assets and liabilities due to foreign exchange rates........................................................................................ 31,000............... (12,000)............
18. Drafts outstanding.......................................................................................................................................................................... 0........................ 0......................
19. Payable to parent, subsidiaries and affiliates................................................................................................................................. 0........................ 0......................
20. Derivatives...................................................................................................................................................................................... 0........................ 63,000.............
21. Payable for securities..................................................................................................................................................................... 287,000............. 3,000...............
22. Payable for securities lending........................................................................................................................................................ 79,000............... 183,000...........
23. Liability for amounts held under uninsured plans........................................................................................................................... 0........................ 0......................
24. Capital notes $...0 and interest thereon $.....0…............................................................................................................................ 0........................ 0......................
25. Aggregate write-ins for liabilities..................................................................................................................................................... 375,000............. 814,000...........
26. Total liabilities excluding protected cell liabilities (Lines 1 through 25).......................................................................................... 68,976,000........ 68,068,000......
27. Protected cell liabilities................................................................................................................................................................... 0........................ 0......................
28. Total liabilities (Lines 26 and 27).................................................................................................................................................... 68,976,000........ 68,068,000......
29. Aggregate write-ins for special surplus funds................................................................................................................................. 848,000............. 777,000...........
30. Common capital stock.................................................................................................................................................................... 108,000............. 108,000...........
31. Preferred capital stock................................................................................................................................................................... 0........................ 0......................
32. Aggregate write-ins for other than special surplus funds............................................................................................................... 0........................ 0......................
33. Surplus notes................................................................................................................................................................................. 0........................ 0......................
34. Gross paid in and contributed surplus............................................................................................................................................ 17,585,000........ 17,585,000......
35. Unassigned funds (surplus)............................................................................................................................................................ 12,483,000........ 13,138,000......
36. Less treasury stock, at cost............................................................................................................................................................ 0........................ 0......................
36.1 ……..0.000 shares common (value included in Line 30 $........0)...................................................................................... 0........................ 0......................
36.2 ……..0.000 shares preferred (value included in Line 30 $........0)...................................................................................... 0........................ 0......................
37. Surplus as regards policyholders (Lines 29 to 35, less 36) (Page 4, Line 39)............................................................................... 31,024,000........ 31,608,000......
38. TOTALS (Page 2, Line 28, Col. 3).................................................................................................................................................. 100,000,000...... 99,676,000......
DETAILS OF WRITE-INS
2501. Other Liabilities............................................................................................................................................................................... 2,000................. 2,000...............
2502. Investment real estate liability........................................................................................................................................................ 94,000............... 92,000.............
2503. Interest deposit liability................................................................................................................................................................... 3,000................. 3,000...............
2598. Summary of remaining write-ins..................................................................................................................................................... 276,000............. 717,000...........
2599. Totals (Lines 2501 through 2503 plus 2598) (Line 25 above)........................................................................................................ 375,000............. 814,000...........
2901. Special surplus for deferred taxes.................................................................................................................................................. 703,000............. 608,000...........
2902. Special surplus from retroactive reinsurance................................................................................................................................. 140,000............. 163,000...........
2903. Guaranty surplus fund.................................................................................................................................................................... 5,000................. 5,000...............
2998. Summary of remaining write-ins..................................................................................................................................................... 0........................ 0......................
2999. Totals (Lines 2901 through 2903 plus 2998) (Line 29 above)........................................................................................................ 848,000............. 777,000...........
LIABILITIES, SURPLUS AND OTHER FUNDS
3
ANNUAL STATEMENT FOR THE YEAR 2018 OF THE FICTITIOUS INSURANCE COMPANY

UNDERWRITING INCOME
1 2
Current Year Prior Year
1. Premiums earned (Part 1, Line 35, Column 4)....................................................................................................................................... 26,512,000.... 25,535,000......
DEDUCTIONS
2. Losses incurred (Part 2, line 35, Column 7)............................................................................................................................................ 16,907,000.... 12,798,000......
3. Loss adjustment expenses incurred (Part 3, line 25, Column 1)............................................................................................................. 3,255,000...... 3,008,000........
4. Other underwriting expenses incurred (Part 3, line 25, Column 2)......................................................................................................... 8,483,000...... 8,240,000........
5. Aggregate write-ins for underwriting deductions..................................................................................................................................... 0.................... 1,000...............
6. Total underwriting deductions (Lines 2 through 5).................................................................................................................................. 28,645,000.... 24,047,000......
7. Net Income of protected cells.................................................................................................................................................................. 0.................... 0......................
8. Net underwriting gain (loss) (Line 1 minus line 6 plus line 7).................................................................................................................. (2,133,000)..... 1,488,000........
INVESTMENT INCOME
9. Net investment income earned (Exhibit of Net Investment Income, Line 17)......................................................................................... 4,290,000...... 4,860,000........
10. Net realized capital gains (losses) less capital gains tax of $... 99,000 (Exhibit of Capital Gains (Losses))........................................... 15,000........... (445,000)..........
11. Net investment gain (loss) (Lines 9 + 10)............................................................................................................................................... 4,305,000...... 4,415,000........
OTHER INCOME
12. Net gain (loss) from agents' or premium balances charged off (amount recovered $65,000)................................................................ (78,000).......... (74,000)............
13. Finance and service charges not included in premiums......................................................................................................................... 122,000......... 124,000...........
14. Aggregate write-ins for miscellaneous income........................................................................................................................................ (11,000).......... (3,000)..............
15. Total other income (Lines 12 through 14)............................................................................................................................................... 33,000........... 47,000.............
16. Net income before dividends to policyholders, after capital gains tax and before all other federal and foreign income taxes (Lines 8
+ 11 + 15)..…………………..…………………..…………………..…………………..…………………..………………………
2,205,000...... 5,950,000........
17. Dividends to policyholders....................................................................................................................................................................... 46,000........... 32,000.............
18.
Net income, after dividends to policyholders, after capital gains tax and before all other federal and foreign income taxes (Line 16
minus Line 17)……………………..…………………..…………………..…………………..…………………..……………….……..
2,159,000...... 5,918,000........
19. Federal and foreign income taxes incurred............................................................................................................................................. (20,000).......... 963,000...........
20. Net income (Line 18 minus Line 19) (to Line 22).................................................................................................................................... 2,179,000...... 4,955,000........
CAPITAL AND SURPLUS ACCOUNT
21. Surplus as regards policyholders, December 31 Prior year (Page 4, Line 39, Column 2)...................................................................... 31,609,000.... 35,793,000......
22. Net income (From Line 20)..................................................................................................................................................................... 2,179,000...... 4,955,000........
23. Net transfers (to) from Protected Cell accounts...................................................................................................................................... 0.................... 0......................
24. Change in net unrealized capital gains or (losses) less capital gains tax of $ …7,000........................................................................... 81,000........... 119,000...........
25. Change in net unrealized foreign exchange capital gain (loss)............................................................................................................... (122,000)........ 66,000.............
26. Change in net deferred income tax......................................................................................................................................................... 14,000........... (243,000)..........
27. Change in nonadmitted assets (Exhibit of Nonadmitted Assets, Line 28 Column 3).............................................................................. (13,000).......... 498,000...........
28. Change in provision for reinsurance (Page 3, Line 16, Column 2 minus Column 1).............................................................................. (11,000).......... 124,000...........
29. Change in surplus notes......................................................................................................................................................................... 0.................... 0......................
30. Surplus (contributed to) withdrawn from protected cells......................................................................................................................... 0.................... 0......................
31. Cumulative effect of changes in accounting principles........................................................................................................................... 0.................... 0......................
32. Capital changes:
32.1 Paid in........................................................................................................................................................................................... 0.................... 0......................
32.2 Transferred from surplus (Stock dividend).................................................................................................................................... 0.................... 0......................
32.3 Transferred to surplus................................................................................................................................................................... 0.................... 0......................
33. Surplus Adjustments:
33.1 Paid in........................................................................................................................................................................................... 0.................... 361,000...........
33.2 Transferred to capital (Stock Dividend)......................................................................................................................................... 0.................... 0......................
33.3 Transferred from Capital............................................................................................................................................................... 0.................... 0......................
34. Net remittances from or (to) Home Office............................................................................................................................................... 0.................... 0......................
35. Dividends to stockholders....................................................................................................................................................................... (2,617,000)..... (10,023,000).....
36. Change in treasury stock (Page 3, Line 36.1 and 36.2, Column 2 minus Column 1)............................................................................. 0.................... 0......................
37. Aggregate write-ins for gains and losses in surplus................................................................................................................................ (96,000).......... (42,000)............
38. Change in surplus as regards policyholders for the year (Lines 22 through 37)..................................................................................... (585,000)........ (4,185,000).......
39. Surplus as regards policyholders, December 31 current year (Line 21 plus Line 38) (Page 3, Line 37)................................................ 31,024,000.... 31,608,000......
ANNUAL STATEMENT FOR THE YEAR 2018 OF THE FICTITIOUS INSURANCE COMPANY
4
STATEMENT OF INCOME

1 2
Current Year Prior Year
CASH FROM OPERATIONS
1. Premiums collected net of Reinsurance......................................................................................................................................... 26,881,000........ 25,228,000......
2. Net Investment Income.................................................................................................................................................................. 4,618,000.......... 5,442,000........
3. Miscellaneous Income.................................................................................................................................................................... 33,000............... 48,000.............
4. Total (Lines 1 through 3)................................................................................................................................................................ 31,532,000........ 30,718,000......
5. Benefit and loss related payments................................................................................................................................................. 15,952,000........ 13,249,000......
6. Net transfers to Separate Accounts, Segregated Accounts and Proteced Cell Accounts.............................................................. 0........................ 0......................
7. Commissions, expenses paid and aggregate write-ins for deductions.......................................................................................... 11,710,000........ 11,647,000......
8. Dividends Paid to Policyholders..................................................................................................................................................... 58,000............... 32,000.............
9. Federal and foreign income taxes paid (recovered) net of $.......... tax on capital gains (losses).................................................. 423,000............. 757,000...........
10. Total (Lines 5 though 9)................................................................................................................................................................. 28,143,000........ 25,685,000......
11. Net cash from operations (Line 4 minus Line 10)......................................................................................................................... 3,389,000.......... 5,033,000........
CASH FROM INVESTMENTS
12. Proceeds from Investments sold, matured or repaid:
12.1 Bonds.................................................................................................................................................................................... 3,627,000.......... 11,371,000......
12.2 Stocks................................................................................................................................................................................... 241,000............. 596,000...........
12.3 Mortgage Loans.................................................................................................................................................................... 5,000................. 16,000.............
12.4 Real Estate............................................................................................................................................................................ 0........................ 49,000.............
12.5 Other invested assets............................................................................................................................................................ 786,000............. 363,000...........
12.6 Net gains or (losses) on cash, cash equivalents and short-term investments..................................................................... 0........................ 0......................
12.7 Miscellaneous proceeds........................................................................................................................................................ 104,000............. 7,000...............
12.8 Total investment proceeds (Lines 12.1 to 12.7).................................................................................................................... 4,763,000.......... 12,402,000......
13. Cost of investments acquired (long-term only):
13.1 Bonds.................................................................................................................................................................................... 9,661,000.......... 5,845,000........
13.2 Stocks................................................................................................................................................................................... 386,000............. 1,230,000........
13.3 Mortgage Loans.................................................................................................................................................................... 14,000............... 4,000...............
13.4 Real Estate............................................................................................................................................................................ 277,000............. 77,000.............
13.5 Other invested assets............................................................................................................................................................ 965,000............. 1,213,000........
13.6 Miscellaneous applications................................................................................................................................................... (284,000)............ 0......................
13.7 Total investments acquired (Lines 13.1 to 13.6)................................................................................................................... 11,019,000........ 8,369,000........
14. Net increase (decrease) in contract loans and premium notes...................................................................................................... 0........................ 0......................
15. Net cash from investments (Line 12.8 minus Lines 13.7 minus Line 14)....................................................................................... (6,256,000)......... 4,033,000........
CASH FROM FINANCING AND MISCELLANEOUS SOURCES
16. Cash provided (applied):
16.1 Surplus notes, capital notes.................................................................................................................................................. 0........................ 0......................
16.2 Capital and paid in surplus, less treasury stock.................................................................................................................... 0........................ 362,000...........
16.3 Borrowed funds..................................................................................................................................................................... 0........................ 0......................
16.4 Net deposits on deposit-type contracts and other insurance liabilities.................................................................................. 0........................ 0......................
16.5 Dividends to stockholders.................................................................................................................................................... (2,617,000)......... 10,025,000......
16.6 Other cash provided (applied)............................................................................................................................................... 0........................ 0......................
17. Net cash from financing and miscellaneous source (Line 16.1 to 16.4 minus line 16.5 plus line 16.6)......................................... 2,617,000.......... (9,663,000).......
RECONCILIATION OF CASH, CASH EQUIVALENTS AND SHORT TERM INVESTMENTS
18. Net change in cash, cash equivalents and short-term investments (Line 11 plus line 15 plus line 17)......................................... (250,000)............ (597,000)..........
19. Cash, cash equivalents and short-term investments:
19. Beginning of year.................................................................................................................................................................... 1,233,000.......... 1,830,000........
19.2 End of year (line 18 plus line 19.1)........................................................................................................................................ 983,000............. 1,233,000........
Note: supplemental disclosures of cash flow information for non-cash transactions
20.0001 Exchange of stock..................................................................................................................................................................... 10,000............... 0......................
20.0002 Bonds converted to stock.......................................................................................................................................................... 0........................ 0......................
20.0003 Capital contribution.................................................................................................................................................................... 0........................ 362,000...........
ANNUAL STATEMENT FOR THE YEAR 2018 OF THE FICTITIOUS INSURANCE COMPANY
CASH FLOW
5

1 2
3
4
Line of Business
Net Premiums
Written per Column
6, Part 1B
Unearned Premiums
Dec. 31 Prior Year -
per Col 3, Last Year's
Part 1
Unearned Premiums
Dec 31. Current Year
- per Col. 5 Part 1A
Premiums Earned
During Year
(Cols. 1 + 2 -3)
1. Fire........................................................................................................... 2,484,000............... 1,158,000................... 1,133,000................. 2,509,000.............
2. Allied Lines.............................................................................................. 0............................. 0.................................. 0................................ 0...........................
3. Farmowners multiple peril....................................................................... 0............................. 0.................................. 0................................ 0...........................
4. Homeowners multiple peril...................................................................... 4,555,000............... 2,290,000................... 2,400,000................. 4,445,000.............
5. Commercial multiple peril........................................................................ 4,677,000............... 2,139,000................... 2,123,000................. 4,693,000.............
6. Mortgage guaranty.................................................................................. 0............................. 0.................................. 0................................ 0...........................
8. Ocean marine.......................................................................................... 0............................. 0.................................. 0................................ 0...........................
9. Inland marine........................................................................................... 0............................. 0.................................. 0................................ 0...........................
10. Financial guaranty................................................................................... 0............................. 0.................................. 0................................ 0...........................
11.1 Medical professionial liability - occurrence............................................. 0............................. 0.................................. 0................................ 0...........................
11.2 Medical professionial liability - claims-made.......................................... 0............................. 0.................................. 0................................ 0...........................
12. Earthquake.............................................................................................. 0............................. 0.................................. 0................................ 0...........................
13. Group accident and health...................................................................... 0............................. 0.................................. 0................................ 0...........................
14. Credit accident and health (group and individual).................................. 0............................. 0.................................. 0................................ 0...........................
15. Other accident and health....................................................................... 0............................. 0.................................. 0................................ 0...........................
16. Workers' compensation.......................................................................... 4,022,000............... 1,441,000................... 1,520,000................. 3,943,000.............
17.1 Other liability - occurrence...................................................................... 3,502,000............... 1,695,000................... 1,649,000................. 3,548,000.............
17.2 Other liability - claims-made.................................................................... 0............................. 0.................................. 0................................ 0...........................
17.3 Excess workers' compensation.............................................................. 0............................. 0.................................. 0................................ 0...........................
18.1 Products liability - occurrence................................................................. 0............................. 0.................................. 0................................ 0...........................
18.2 Products liability- claims-made............................................................... 0............................. 0.................................. 0................................ 0...........................
19.1, 19.2 Private passage auto liability.................................................................. 2,804,000............... 882,000...................... 954,000.................... 2,732,000.............
19.3, 19.4 Commercial auto liability......................................................................... 2,250,000............... 987,000...................... 1,014,000................. 2,223,000.............
21. Auto physical damage............................................................................. 2,312,000............... 811,000...................... 845,000.................... 2,278,000.............
22. Aircraft (all perils).................................................................................... 0............................. 0.................................. 0................................ 0...........................
23. Fidelity...................................................................................................... 146,000.................. 48,000........................ 53,000...................... 141,000................
24. Surety....................................................................................................... 0............................. 0.................................. 0................................ 0...........................
26. Burglary and theft.................................................................................... 0............................. 0.................................. 0................................ 0...........................
27. Boiler and machinery.............................................................................. 0............................. 0.................................. 0................................ 0...........................
28. Credit ..................................................................................................... 0............................. 0.................................. 0................................ 0...........................
29. International............................................................................................. 0............................. 0.................................. 0................................ 0...........................
30. Warranty.................................................................................................. 0............................. 0.................................. 0................................ 0...........................
31. Reinsurance - nonproportional assumed property................................. 0............................. 0.................................. 0................................ 0...........................
32. Reinsurance - nonproportional assumed liability................................... 0............................. 0.................................. 0................................ 0...........................
33. Reinsurance - nonproportional assumed financial lines........................ 0............................. 0.................................. 0................................ 0...........................
34. Aggregate write-ins for other lines of business...................................... 0............................. 0.................................. 0................................ 0...........................
35. TOTALS 26,752,000 11,451,000 11,691,000 26,512,000
DETAILS OF WRITE-INS
3401. ................................................................................................................. 0............................. 0.................................. 0................................ 0...........................
3402. ................................................................................................................. 0............................. 0.................................. 0................................ 0...........................
3403. ................................................................................................................. 0............................. 0.................................. 0................................ 0...........................
3498. Summary of remaining write-ins for line 34 from overflow page........... 0............................. 0.................................. 0................................ 0...........................
3499. Totals (Lines 3401 through 3403 plus 3498) (Line 34 above)............... 0............................. 0.................................. 0................................ 0...........................
ANNUAL STATEMENT FOR THE YEAR 2018 OF THE FICTITIOUS INSURANCE COMPANY
UNDERWRITING AND INVESTMENT EXHIBIT
PART 1- PREMIUMS EARNED
6

1 2 3 4 5
Line of Business
Amount Unearned
(Running One Year or
Less from Date of
Policy)
(a)
Amount Unearned
(Running More Than
One Year from Date of
Policy
(a)
Earned but
Unbilled Premium
Reserve for Rate
Credits and
Retrospective
Adjustments Based
on Experience
Total Reserve for
Unearned Premiums
Cols 1 + 2 + 3 + 4
1. Fire.......................................................................................................... 1,026,000..................... 116,000....................... (9,000)................... 0............................... 1,133,000..................
2. Allied Lines............................................................................................. 0................................... 0.................................. 0............................ 0............................... 0................................
3. Farmowners multiple peril...................................................................... 0................................... 0.................................. 0............................ 0............................... 0................................
4. Homeowners multiple peril..................................................................... 2,400,000..................... 0.................................. 0............................ 0............................... 2,400,000..................
5. Commercial multiple peril....................................................................... 2,111,000..................... 22,000......................... (10,000)................. 0............................... 2,123,000..................
6. Mortgage guaranty................................................................................. 0................................... 0.................................. 0............................ 0............................... 0................................
8. Ocean Marine......................................................................................... 0................................... 0.................................. 0............................ 0............................... 0................................
9. Inland Marine.......................................................................................... 0................................... 0.................................. 0............................ 0............................... 0................................
10. Financial guaranty.................................................................................. 0................................... 0.................................. 0............................ 0............................... 0................................
11.1 Medical professionial liability - occurrence............................................. 0................................... 0.................................. 0............................ 0............................... 0................................
11.2 Medical professionial liability - claims made........................................... 0................................... 0.................................. 0............................ 0............................... 0................................
12. Earthquake............................................................................................. 0................................... 0.................................. 0............................ 0............................... 0................................
13. Group accident and health..................................................................... 0................................... 0.................................. 0............................ 0............................... 0................................
14. Credit accident and health...................................................................... 0................................... 0.................................. 0............................ 0............................... 0................................
15. Other accident and health...................................................................... 0................................... 0.................................. 0............................ 0............................... 0................................
16. Worker's Compensation......................................................................... 1,689,000..................... 1,000........................... (32,000)................. (138,000)................... 1,520,000..................
17.1 Other liability - occurrence...................................................................... 1,546,000..................... 104,000....................... 0............................ (1,000)....................... 1,649,000..................
17.2 Other liability - claim made..................................................................... 0................................... 0.................................. 0............................ 0............................... 0................................
17.3 Excess workers' compensation.............................................................. 0................................... 0.................................. 0............................ 0............................... 0................................
18.1 Products liability- occurrence................................................................. 0................................... 0.................................. 0............................ 0............................... 0................................
18.2 Products liability- claims made............................................................... 0................................... 0.................................. 0............................ 0............................... 0................................
19.1, 19.2 Private passage auto liability.................................................................. 954,000........................ 0.................................. 0............................ 0............................... 954,000.....................
19.3, 19.4 Commercial auto liability......................................................................... 996,000........................ 23,000......................... 0............................ (5,000)....................... 1,014,000..................
21. Auto physical damage............................................................................ 841,000........................ 4,000........................... 0............................ 0............................... 845,000.....................
22. Aircraft (all perils).................................................................................... 0................................... 0.................................. 0............................ 0............................... 0................................
23. Fidelity.................................................................................................... 41,000.......................... 22,000......................... (10,000)................. 0............................... 53,000.......................
24. Surety..................................................................................................... 0................................... 0.................................. 0............................ 0............................... 0................................
26. Burglary and theft................................................................................... 0................................... 0.................................. 0............................ 0............................... 0................................
27. Boiler and machinery.............................................................................. 0................................... 0.................................. 0............................ 0............................... 0................................
28. Credit .................................................................................................... 0................................... 0.................................. 0............................ 0............................... 0................................
29. International............................................................................................ 0................................... 0.................................. 0............................ 0............................... 0................................
30. Warranty................................................................................................. 0................................... 0.................................. 0............................ 0............................... 0................................
31. Reinsurance- nonproportional assumed property.................................. 0................................... 0.................................. 0............................ 0............................... 0................................
32. Reinsurance- nonproportional assumed liability..................................... 0................................... 0.................................. 0............................ 0............................... 0................................
33. Reinsurance - nonproportional assumed financial lines......................... 0................................... 0.................................. 0............................ 0............................... 0................................
34. Aggregate write-ins for other lines of business...................................... 0................................... 0.................................. 0............................ 0............................... 0................................
35. TOTALS 11,609,000 287,000 (61,000) (144,000) 11,691,000
36. 144,000.....................
37. 60,000.......................
38. 11,895,000................
DETAILS OF WRITE-INS
3401. ................................................................................................................ 0................................... 0.................................. 0............................ 0............................... 0................................
3402. ................................................................................................................ 0................................... 0.................................. 0............................ 0............................... 0................................
3403. ................................................................................................................ 0................................... 0.................................. 0............................ 0............................... 0................................
3498. Summary of remaining write-ins for Line 34 from overflow page........... 0................................... 0.................................. 0............................ 0............................... 0................................
3499. Totals (Lines 3401 through 3403 plus 3498) (Line 34 above)................ 0................................... 0.................................. 0............................ 0............................... 0................................
(a) State here basis of computation used in each case: Daily pro rata; pools and associations as submitted
7
ANNUAL STATEMENT FOR THE YEAR 2018 OF THE FICTITIOUS INSURANCE COMPANY
UNDERWRITING AND INVESTMENT EXHIBIT
PART 1A - RECAPITULATION OF ALL PREMIUMS
Accrued retrospective premiums based on experience............................................................................................................................................................................
Earned but unbilled premiums...................................................................................................................................................................................................................
Balance (Sum of Lines 35 through 37)......................................................................................................................................................................................................

1 6
Direct 2 3 4 5 Net Premiums
Business From From To To Written Cols.
Line of Business
(a)
Affiliates
Non-Affiliates
Affiliates
Non-Affiliates
1 + 2 + 3 - 4 - 5
1. Fire............................................................................................................... 3,254,000............ 0............................ 0............................ 0............................ 770,000................. 2,484,000.........
2. Allied Lines................................................................................................... 0........................... 0............................ 0............................ 0............................ 0............................ 0.......................
3. Farmowners multiple peril............................................................................ 0........................... 0............................ 0............................ 0............................ 0............................ 0.......................
4. Homeowners multiple peril........................................................................... 4,646,000............ 0............................ 0............................ 0............................ 91,000................... 4,555,000.........
5. Commercial multiple peril............................................................................. 5,003,000............ 0............................ 0............................ 0............................ 326,000................. 4,677,000.........
6. Mortgage guaranty....................................................................................... 0........................... 0............................ 0............................ 0............................ 0............................ 0.......................
8. Ocean Marine............................................................................................... 0........................... 0............................ 0............................ 0............................ 0............................ 0.......................
9. Inland Marine................................................................................................ 0........................... 0............................ 0............................ 0............................ 0............................ 0.......................
10. Financial guaranty........................................................................................ 0........................... 0............................ 0............................ 0............................ 0............................ 0.......................
11.1 Medical professionial liability - occurrence.................................................. 0........................... 0............................ 0............................ 0............................ 0............................ 0.......................
11.2 Medical professionial liability - claims made................................................ 0........................... 0............................ 0............................ 0............................ 0............................ 0.......................
12. Earthquake................................................................................................... 0........................... 0............................ 0............................ 0............................ 0............................ 0.......................
13. Group accident and health........................................................................... 0........................... 0............................ 0............................ 0............................ 0............................ 0.......................
14. Credit accident and health........................................................................... 0........................... 0............................ 0............................ 0............................ 0............................ 0.......................
15. Other accident and health............................................................................ 0........................... 0............................ 0............................ 0............................ 0............................ 0.......................
16. Worker's Compensation.............................................................................. 4,394,000............ 0............................ 0............................ 0............................ 372,000................. 4,022,000.........
17.1 Other liability - occurrence........................................................................... 3,749,000............ 0............................ 0............................ 0............................ 247,000................. 3,502,000.........
17.2 Other liability - claim made........................................................................... 0........................... 0............................ 0............................ 0............................ 0............................ 0.......................
17.3 Excess workers' compensation................................................................... 0........................... 0............................ 0............................ 0............................ 0............................ 0.......................
18.1 Products liability- occurrence....................................................................... 0........................... 0............................ 0............................ 0............................ 0............................ 0.......................
18.2 Products liability- claims made.................................................................... 0........................... 0............................ 0............................ 0............................ 0............................ 0.......................
19.1, 19.2 Private passage auto liability....................................................................... 2,804,000............ 0............................ 0............................ 0............................ 0............................ 2,804,000.........
19.3, 19.4 Commercial auto liability.............................................................................. 2,334,000............ 0............................ 0............................ 0............................ 84,000................... 2,250,000.........
21. Auto physical damage.................................................................................. 2,312,000............ 0............................ 0............................ 0............................ 0............................ 2,312,000.........
22. Aircraft (all perils)......................................................................................... 0........................... 0............................ 0............................ 0............................ 0............................ 0.......................
23. Fidelity.......................................................................................................... 138,000............... 0............................ 0............................ 0............................ (8,000).................... 146,000............
24. Surety........................................................................................................... 0........................... 0............................ 0............................ 0............................ 0............................ 0.......................
26. Burglary and theft......................................................................................... 0........................... 0............................ 0............................ 0............................ 0............................ 0.......................
27. Boiler and machinery................................................................................... 0........................... 0............................ 0............................ 0............................ 0............................ 0.......................
28. Credit .......................................................................................................... 0........................... 0............................ 0............................ 0............................ 0............................ 0.......................
29. International.................................................................................................. 0........................... 0............................ 0............................ 0............................ 0............................ 0.......................
30. Warranty....................................................................................................... 0........................... 0............................ 0............................ 0............................ 0............................ 0.......................
31. Reinsurance- nonproportional assumed property....................................... 0........................... 0............................ 0............................ 0............................ 0............................ 0.......................
32. Reinsurance- nonproportional assumed liability.......................................... 0........................... 0............................ 0............................ 0............................ 0............................ 0.......................
33. Reinsurance - nonproportional assumed financial lines.............................. 0........................... 0............................ 0............................ 0............................ 0............................ 0.......................
34. Aggregate write-ins for other lines of business........................................... 0........................... 0............................ 0............................ 0............................ 0............................ 0.......................
35. TOTALS 28,634,000 0 0 0 1,882,000 26,752,000
DETAILS OF WRITE-INS
3401. ...................................................................................................................... 0........................... 0............................ 0............................ 0............................ 0............................ 0.......................
3402. ...................................................................................................................... 0........................... 0............................ 0............................ 0............................ 0............................ 0.......................
3403. ...................................................................................................................... 0........................... 0............................ 0............................ 0............................ 0............................ 0.......................
3498. Summary of remaining write-ins for line 34 from overflow page................. 0........................... 0............................ 0............................ 0............................ 0............................ 0.......................
3499. Totals (Lines 3401 through 3403 plus 3498) (Line 34 above).................... 0........................... 0............................ 0............................ 0............................ 0............................ 0.......................
8
ANNUAL STATEMENT FOR THE YEAR 2018 OF THE FICTITIOUS INSURANCE COMPANY
UNDERWRITING AND INVESTMENT EXHIBIT
PART 1B - PREMIUMS WRITTEN
Reinsurance Assumed
Reinsurance Ceded

5 6 7
8
1 2
3 4
Percentage of
Net Losses Losses
Losses Incurred
Unpaid Net Losses Incurred
(Col 7, Part 2)
Direct Reinsurance Reinsurance
Net Payments Current Year Unpaid Current Year
to Premiums Earned
Line of Business
Business
Assumed
Recovered
(Cols. 1 + 2 - 3)
(Part 2A, Col. 8)
Prior Year
(Col 4 + 5 - 6)
(Col 4, Part 1)
1. Fire................................................................................................... 1,560,000........ 0...................... 158,000......... 1,402,000........ 1,402,000............ 1,250,000........ 1,554,000............ 62.............................
2. Allied Lines........................................................................................ 0...................... 0...................... 0................... 0...................... 0......................... 0...................... 0......................... 0...............................
3. Farmowners multiple peril................................................................. 0...................... 0...................... 0................... 0...................... 0......................... 0...................... 0......................... 0...............................
4. Homeowners multiple peril................................................................ 3,645,000........ 0...................... 6,000............. 3,639,000........ 1,311,000............ 1,161,000........ 3,789,000............ 85.............................
5. Commercial multiple peril.................................................................. 2,594,000........ 0...................... 242,000......... 2,352,000........ 3,311,000............ 3,539,000........ 2,124,000............ 45.............................
6. Mortgage guaranty............................................................................ 0...................... 0...................... 0................... 0...................... 0......................... 0...................... 0......................... 0...............................
8. Ocean Marine.................................................................................... 0...................... 0...................... 0................... 0...................... 0......................... 0...................... 0......................... 0...............................
9. Inland Marine.................................................................................... 0...................... 0...................... 0................... 0...................... 0......................... 0...................... 0......................... 0...............................
10. Financial guaranty............................................................................. 0...................... 0...................... 0................... 0...................... 0......................... 0...................... 0......................... 0...............................
11.1 Medical professionial liability - occurrence......................................... 0...................... 0...................... 0................... 0...................... 0......................... 0...................... 0......................... 0...............................
11.2 Medical professionial liability - claims made....................................... 0...................... 0...................... 0................... 0...................... 0......................... 0...................... 0......................... 0...............................
12. Earthquake........................................................................................ 0...................... 0...................... 0................... 0...................... 0......................... 0...................... 0......................... 0...............................
13. Group accident and health................................................................ 0...................... 0...................... 0................... 0...................... 0......................... 0...................... 0......................... 0...............................
14. Credit accident and health................................................................. 0...................... 0...................... 0................... 0...................... 0......................... 0...................... 0......................... 0...............................
15. Other accident and health................................................................. 0...................... 0...................... 0................... 0...................... 0......................... 0...................... 0......................... 0...............................
16. Worker's Compensation.................................................................... 1,745,000........ 0...................... 142,000......... 1,603,000........ 13,833,000.......... 15,118,000...... 318,000............... 8...............................
17.1 Other liability - occurrence................................................................. 3,565,000........ 0...................... 1,136,000...... 2,429,000........ 16,050,000.......... 14,369,000...... 4,110,000............ 116............................
17.2 Other liability - claim made................................................................ 0...................... 0...................... 0................... 0...................... 0......................... 0...................... 0......................... 0...............................
17.3 Excess workers' compensation.......................................................... 0...................... 0...................... 0................... 0...................... 0......................... 0...................... 0......................... 0...............................
18.1 Products liability- occurrence............................................................. 0...................... 0...................... 0................... 0...................... 0......................... 0...................... 0......................... 0...............................
18.2 Products liability- claims made.......................................................... 0...................... 0...................... 0................... 0...................... 0......................... 0...................... 0......................... 0...............................
19.1, 19.2 Private passage auto liability............................................................. 1,696,000........ 0...................... 27,000........... 1,669,000........ 2,083,000............ 1,961,000........ 1,791,000............ 66.............................
19.3, 19.4 Commercial auto liability.................................................................... 1,328,000........ 0...................... 103,000......... 1,225,000........ 2,974,000............ 2,767,000........ 1,432,000............ 64.............................
21. Auto physical damage....................................................................... 1,512,000........ 0...................... 3,000............. 1,509,000........ 214,000............... 195,000........... 1,528,000............ 67.............................
22. Aircraft (all perils).............................................................................. 0...................... 0...................... 0................... 0...................... 0......................... 0...................... 0......................... 0...............................
23. Fidelity.............................................................................................. 167,000........... 0...................... 49,000........... 118,000........... 716,000............... 573,000........... 261,000............... 185............................
24. Surety............................................................................................... 0...................... 0...................... 0................... 0...................... 0......................... 0...................... 0......................... 0...............................
26. Burglary and theft.............................................................................. 0...................... 0...................... 0................... 0...................... 0......................... 0...................... 0......................... 0...............................
27. Boiler and machinery......................................................................... 0...................... 0...................... 0................... 0...................... 0......................... 0...................... 0......................... 0...............................
28. Credit .............................................................................................. 0...................... 0...................... 0................... 0...................... 0......................... 0...................... 0......................... 0...............................
29. International...................................................................................... 0...................... 0...................... 0................... 0...................... 0......................... 0...................... 0......................... 0...............................
30. Warranty........................................................................................... 0...................... 0...................... 0................... 0...................... 0......................... 0...................... 0......................... 0...............................
31. Reinsurance- nonproportional assumed property............................... ………....XXX.... 0...................... 0................... 0...................... 0......................... 0...................... 0......................... 0...............................
32. Reinsurance- nonproportional assumed liability................................. ………....XXX.... 0...................... 0................... 0...................... 0......................... 0...................... 0......................... 0...............................
33. Reinsurance - nonproportional assumed financial lines...................... ………....XXX.... 0...................... 0................... 0...................... 0......................... 0...................... 0......................... 0...............................
34. Aggregate write-ins for other lines of business.................................. 0...................... 0...................... 0................... 0...................... 0......................... 0...................... 0......................... 0...............................
35. TOTALS............................................................................................ 17,812,000...... 0...................... 1,866,000...... 15,946,000...... 41,894,000.......... 40,933,000...... 16,907,000.......... 64.............................
DETAILS OF WRITE-INS
3401. ......................................................................................................... 0...................... 0...................... 0................... 0...................... 0......................... 0...................... 0......................... 0...............................
3402. ......................................................................................................... 0...................... 0...................... 0................... 0...................... 0......................... 0...................... 0......................... 0...............................
3403. ......................................................................................................... 0...................... 0...................... 0................... 0...................... 0......................... 0...................... 0......................... 0...............................
3498. Summary of remaining write-ins for line 34 from overflow page......... 0...................... 0...................... 0................... 0...................... 0......................... 0...................... 0......................... 0...............................
3499. Totals................................................................................................ 0...................... 0...................... 0................... 0...................... 0......................... 0...................... 0......................... 0...............................
ANNUAL STATEMENT FOR THE YEAR 2018 OF THE FICTITIOUS INSURANCE COMPANY
UNDERWRITING AND INVESTMENT EXHIBIT
PART 2 LOSSES PAID AND INCURRED
Losses Paid Less Salvage
9

8
9
1 2
3 4 5 6 7
Deduct Reinsurance Net Losses Excluding
Net
Recoverable from Incurred but Net Losses
Unpaid Loss
Direct Reinsurance Authorized and
not Reported Reinsurance Reinsurance Unpaid
Adjustment
Business Assumed Unauthorized Companies
(Cols 1 + 2 - 3) Direct Assumed Ceded (Col 4 + 5 + 6 - 7)
Expenses
1. Fire....................................................................................................... 1,105,000..... 0.................... 140,000.............................. 965,000....................... 522,000........ 0................... 85,000.......... 1,402,000............. 222,000........
2. Allied Lines.......................................................................................... 0................... 0.................... 0......................................... 0.................................. 0................... 0................... 0................... 0........................... 0...................
3. Farmowners multiple peril.................................................................... 0................... 0.................... 0......................................... 0.................................. 0................... 0................... 0................... 0........................... 0...................
4. Homeowners multiple peril.................................................................. 592,000........ 0.................... 3,000.................................. 589,000....................... 734,000........ 0................... 12,000.......... 1,311,000............. 144,000........
5. Commercial multiple peril.................................................................... 2,323,000..... 0.................... 360,000.............................. 1,963,000.................... 1,498,000..... 0................... 150,000........ 3,311,000............. 1,471,000.....
6. Mortgage guaranty............................................................................... 0................... 0.................... 0......................................... 0.................................. 0................... 0................... 0................... 0........................... 0...................
8. Ocean Marine...................................................................................... 0................... 0.................... 0......................................... 0.................................. 0................... 0................... 0................... 0........................... 0...................
9. Inland Marine....................................................................................... 0................... 0.................... 0......................................... 0.................................. 0................... 0................... 0................... 0........................... 0...................
10. Financial guaranty............................................................................... 0................... 0.................... 0......................................... 0.................................. 0................... 0................... 0................... 0........................... 0...................
11.1 Medical professionial liability - occurrence.......................................... 0................... 0.................... 0......................................... 0.................................. 0................... 0................... 0................... 0........................... 0...................
11.2 Medical professionial liability - claims made....................................... 0................... 0.................... 0......................................... 0.................................. 0................... 0................... 0................... 0........................... 0...................
12. Earthquake.......................................................................................... 0................... 0.................... 0......................................... 0.................................. 0................... 0................... 0................... 0........................... 0...................
13. Group accident and health.................................................................. 0................... 0.................... 0......................................... 0.................................. 0................... 0................... 0................... 0........................... 0...................
14. Credit accident and health................................................................... 0................... 0.................... 0......................................... 0.................................. 0................... 0................... 0................... 0........................... 0...................
15. Other accident and health................................................................... 0................... 0.................... 0......................................... 0.................................. 0................... 0................... 0................... 0........................... 0...................
16. Worker's Compensation...................................................................... 9,343,000..... 0.................... 1,604,000........................... 7,739,000.................... 6,652,000..... 0................... 558,000........ 13,833,000........... 2,113,000.....
17.1 Other liability - occurrence................................................................... 6,868,000..... 0.................... 2,122,000........................... 4,746,000.................... 14,189,000... 0................... 2,885,000..... 16,050,000........... 4,641,000.....
17.2 Other liability - claim made.................................................................. 0................... 0.................... 0......................................... 0.................................. 0................... 0................... 0................... 0........................... 0...................
17.3 Excess workers' compensation........................................................... 0................... 0.................... 0......................................... 0.................................. 0................... 0................... 0................... 0........................... 0...................
18.1 Products liability- occurrence............................................................... 0................... 0.................... 0......................................... 0.................................. 0................... 0................... 0................... 0........................... 0...................
18.2 Products liability- claims made............................................................ 0................... 0.................... 0......................................... 0.................................. 0................... 0................... 0................... 0........................... 0...................
19.1, 19.2 Private passage auto liability............................................................... 2,116,000..... 0.................... 633,000.............................. 1,483,000.................... 628,000........ 0................... 28,000.......... 2,083,000............. 399,000........
19.3, 19.4 Commercial auto liability...................................................................... 2,020,000..... 0.................... 285,000.............................. 1,735,000.................... 1,389,000..... 0................... 150,000........ 2,974,000............. 476,000........
21. Auto physical damage......................................................................... 112,000........ 0.................... 5,000.................................. 107,000....................... 137,000........ 0................... 30,000.......... 214,000................ 96,000..........
22. Aircraft (all perils)................................................................................. 0................... 0.................... 0......................................... 0.................................. 0................... 0................... 0................... 0........................... 0...................
23. Fidelity................................................................................................. 466,000........ 0.................... 191,000.............................. 275,000....................... 581,000........ 0................... 140,000........ 716,000................ 101,000........
24. Surety.................................................................................................. 0................... 0.................... 0......................................... 0.................................. 0................... 0................... 0................... 0........................... 0...................
26. Burglary and theft................................................................................ 0................... 0.................... 0......................................... 0.................................. 0................... 0................... 0................... 0........................... 0...................
27. Boiler and machinery........................................................................... 0................... 0.................... 0......................................... 0.................................. 0................... 0................... 0................... 0........................... 0...................
28. Credit ................................................................................................. 0................... 0.................... 0......................................... 0.................................. 0................... 0................... 0................... 0........................... 0...................
29. International......................................................................................... 0................... 0.................... 0......................................... 0.................................. 0................... 0................... 0................... 0........................... 0...................
30. Warranty.............................................................................................. 0................... 0.................... 0......................................... 0.................................. 0................... 0................... 0................... 0........................... 0...................
31. Reinsurance- nonproportional assumed property................................ ………....XXX 0.................... 0......................................... 0.................................. ………....XXX 0................... 0................... 0........................... 0...................
32. Reinsurance- nonproportional assumed liability.................................. ………....XXX 0.................... 0......................................... 0.................................. ………....XXX 0................... 0................... 0........................... 0...................
33. Reinsurance - nonproportional assumed financial lines...................... ………....XXX 0.................... 0......................................... 0.................................. ………....XXX 0................... 0................... 0........................... 0...................
34. Aggregate write-ins for other lines of business.................................... 0................... 0.................... 0......................................... 0.................................. 0................... 0................... 0................... 0........................... 0...................
35. TOTALS............................................................................................... 24,945,000... 0.................... 5,343,000........................... 19,602,000.................. 26,330,000... 0................... 4,038,000..... 41,894,000........... 9,663,000.....
DETAILS OF WRITE-INS
3401. ............................................................................................................. 0................... 0.................... 0......................................... 0.................................. 0................... 0................... 0................... 0........................... 0...................
3402. ............................................................................................................. 0................... 0.................... 0......................................... 0.................................. 0................... 0................... 0................... 0........................... 0...................
3403. ............................................................................................................. 0................... 0.................... 0......................................... 0.................................. 0................... 0................... 0................... 0........................... 0...................
3498. Summary of remaining write-ins for line 34 from overflow page.......... 0................... 0.................... 0......................................... 0.................................. 0................... 0................... 0................... 0........................... 0...................
3499. Totals (Lines 3401 through 3403 plus 3498) (Line 34 above)............. 0................... 0.................... 0......................................... 0.................................. 0................... 0................... 0................... 0........................... 0...................
10
ANNUAL STATEMENT FOR THE YEAR 2018 OF THE FICTITIOUS INSURANCE COMPANY
UNDERWRITING AND INVESTMENT EXHIBIT
PART 2A - UNPAID LOSSES AND LOSS ADJUSTMENT EXPENSES
Reported Losses
Incurred But Not Reported

1 2 3 4
Loss Adjustment
Expenses
Other
Underwriting
Expenses
Investment
Expenses
Total
1. Claims Adjustment Services:
1.1 Direct......................................................................................................... 1,881,000........... 0......................... 0......................... 1,881,000...........
1.2 Reinsurance Assumed............................................................................... 0......................... 0......................... 0......................... 0.........................
1.3 Reinsurance Ceded.................................................................................... 210,000.............. 0......................... 0......................... 210,000..............
1.4 Net claims adjusment services ( 1.1 + 1.2 - 1.3)......................................... 1,671,000........... 0......................... 0......................... 1,671,000...........
2. Commission and Brokerage:
2.1 Direct, excluding contingent....................................................................... 0......................... 4,759,000........... 0......................... 4,759,000...........
2.2 Reinsurance assumed, excluding contingent.............................................. 0......................... 0......................... 0......................... 0.........................
2.3 Reinsurance ceded, excluding contingent.................................................. 0......................... 816,000.............. 0......................... 816,000..............
2.4 Contingent - direct...................................................................................... 0......................... 121,000.............. 0......................... 121,000..............
2.5 Contingent - reinsurance assumed............................................................. 0......................... 0......................... 0.........................
2.6 Contingent - reinsurance ceded.................................................................. 0......................... 9,000.................. 0......................... 9,000..................
2.7 Policy and membership fees...................................................................... 0......................... 0......................... 0......................... 0.........................
2.8 Net commission and brokerage (2.1 + 2.2 - 2.3 + 2.4 + 2.5 - 2.6 + 2.7)...... 0......................... 4,055,000........... 0......................... 4,055,000...........
3. Allowances to managers and agents.................................................................. 0......................... 4,000.................. .........................0 4,000..................
4. Advertising......................................................................................................... 0......................... 208,000.............. 0......................... 208,000..............
5. Boards, bureaus and associations..................................................................... 7,000.................. 106,000.............. 0......................... 113,000..............
6. Surveys and underwriting reports....................................................................... 0......................... 99,000................ 0......................... 99,000................
7. Audit of assureds' records.................................................................................. 0......................... 0......................... 0......................... 0.........................
8. Salary and related items:
8.1 Salaries...................................................................................................... 949,000.............. 1,845,000........... 32,000................ 2,826,000...........
8.2 Payroll taxes............................................................................................... 69,000................ 115,000.............. 0......................... 184,000..............
9. Employee relations and welfare.......................................................................... 182,000.............. 293,000.............. 3,000.................. 478,000..............
10.
Insurance...........................................................................................................
117,000.............. 23,000................ 0......................... 140,000..............
11. Directors' fees.................................................................................................... 0......................... 0......................... 0......................... 0.........................
12. Travel and travel items....................................................................................... 64,000................ 95,000................ 0......................... 159,000..............
13. Rent and rent items............................................................................................ 62,000................ 133,000.............. 1,000.................. 196,000..............
14. Equipment.......................................................................................................... 11,000................ 42,000................ 3,000.................. 56,000................
15. Cost or depreciation of EDP equipment and software......................................... 30,000................ 330,000.............. 0......................... 360,000..............
16. Printing and stationery........................................................................................ 5,000.................. 19,000................ 0......................... 24,000................
17. Postage, telephone and telegraph, exchange and express................................ 19,000................ 112,000.............. 0......................... 131,000..............
18. Legal and auditing.............................................................................................. 44,000................ 14,000................ 2,000.................. 60,000................
19. Total (Lines 3 to 18)........................................................................................... 1,559,000........... 3,438,000........... 41,000................ 5,038,000...........
20. Taxes, Licenses and Fees:
20.1 State and local insurance taxes deducting guaranty association credits
of $ 1,103…………………………………………………………………………..
0......................... 791,000.............. 0......................... 791,000..............
20.2 Insurance department licenses and fees.................................................. 0......................... 53,000................ 0......................... 53,000................
20.3 Gross guaranty association assessments................................................ 0......................... (2,000)................. 0......................... (2,000).................
20.4 All other (excluding federal and foreign income and real estate)............... 0......................... 18,000................ 0......................... 18,000................
20.5 Total taxes, licenses and fees (20.1 + 20.2 + 20.3 + 20.4)....................... 0......................... 860,000.............. 0......................... 860,000..............
21. Real estate expenses......................................................................................... 0......................... 0......................... 332,000.............. 332,000..............
22. Real estate taxes............................................................................................... 0......................... 0......................... 14,000................ 14,000................
23. Reimbursement by uninsured plans................................................................... 0......................... 0......................... 0......................... 0.........................
24. Aggregate write-ins for miscellaneous expenses................................................ 25,000................ 130,000.............. 6,000.................. 161,000..............
25. Total expenses incurred..................................................................................... 3,255,000........... 8,483,000........... 393,000.............. 12,131,000.........
26. Less unpaid expenses - current year.................................................................. 9,663,000........... 1,918,000........... 14,000................ 11,595,000.........
27. Add unpaid expenses - prior year....................................................................... 9,664,000........... 1,886,000........... 17,000................ 11,567,000.........
28. Amounts receivable relating to uninsured plans, prior year................................. 0......................... 0......................... 0......................... 0.........................
29. Amounts receivable relating to uninsured plans, current year............................. 0......................... 0......................... 0......................... 0.........................
30. TOTAL EXPENSES PAID (Lines 25 - 26 + 27 - 28 + 29).................................... 3,256,000........... 8,451,000........... 396,000.............. 12,103,000.........
ANNUAL STATEMENT FOR THE YEAR 2018 OF THE FICTITIOUS INSURANCE COMPANY
UNDERWRITING AND INVESTMENT EXHIBIT
PART 3 - EXPENSES
11

1 2
Collected
During Year
Earned During
Year
1. (a).. 248,000.......... 249,000..............
1.1 (a).. 1,275,000....... 1,280,000...........
1.2 (a).. 1,051,000....... 1,026,000...........
1.3 (a).. 0..................... 0.........................
2.1 (b).. 2,000.............. 2,000..................
2.11 (b) 0..................... 0.........................
2.2 951,000.......... 951,000..............
2.21 0..................... 0.........................
3. (c) 13,000............ 13,000................
4. (d).. 696,000.......... 696,000..............
5. ....... 0..................... 0.........................
6. (e).. 6,000.............. 6,000..................
7. (f) 0..................... 0.........................
8. 649,000.......... 645,000..............
9. 1,000.............. 1,000..................
10. 4,879,000 4,869,000
11. (g) 399,000..............
12.
(g)
0.........................
13. (h) 0.........................
14.
(i)
179,000..............
15. ....... 1,000..................
16. ....... 579,000..............
17. 4,290,000...........
0901. ....... 1,000.............. ....... 1,000..................
0902 ....... 0..................... ....... 0.........................
0903 ....... 0..................... ....... 0.........................
0998 ....... 0..................... ....... 0.........................
0999 ....... 1,000.............. ....... 1,000..................
1501.
....... 1,000..................
1502.
....... 0.........................
1503.
....... 0.........................
1598.
....... 0.........................
1599.
....... 1,000..................
(a)
Includes $..... 36,000 accrual of discount less $... 288,000 amoritzation of premium and less $... 26,000 paid for accrued interest on purchases.
(b)
Includes $..... 0 accrual of discount less $... 0 amoritzation of premium and less $... 0 paid for accrued dividend on purchases.
(c)
Includes $..... 0 accrual of discount less $... 0 amoritzation of premium and less $... 0 paid for accrued interest on purchases.
(d)
Includes $.....81,000 for company's occupancy of its own buildings, and excludes $... 0 interest on encumrances.
(e)
Includes $..... 200 accrual of discount less $... 0 amoritzation of premium and less $... 0 paid for accrued interest on purchases.
(f)
Includes $..... 0 accrual of discount less $... 0 amoritzation of premium.
(g)
Includes $..... 0 investment expenses and $... 0 investment taxes, licenses and fees, excluding federal income taxes attributable to Segregated and Separate Accounts.
(h)
Includes $..... 0 interest on surplus notes and $... 0 interest on capital notes.
(i)
Includes $..... 177,000 depreciation on real estate and $...0 depreciation on other invested assets.
1 2 3
Realized
Gain (Loss)
on Sales or
Maturity
Other Realized
Adjustments
Total Realized Capital
Gain (Loss)
(Columns 1 + 2)
1.
U. S. government bonds.......................................................................... 0............................ 0........................... 0...........................................
.......
0.......................
.......
0...........................
1.1
Bonds exempt from U.S. Tax................................................................... 12,000................... (2,000).................. 10,000..................................
.......
2,000................
.......
0...........................
1.2
Other bonds (unaffiliated)........................................................................ 81,000................... 42,000.................. 123,000................................
.......
22,000..............
.......
(70,000).................
1.3
Bonds of affiliates.................................................................................... 0............................ 0........................... 0...........................................
.......
0.......................
.......
0...........................
2.1
Preferred stocks (unaffiliated).................................................................. 0............................ 0........................... 0...........................................
.......
(1,000)...............
.......
0...........................
2.11
Preferred stocks of affiliates.................................................................... 0............................ 0........................... 0...........................................
.......
0.......................
.......
0...........................
2.2
Common stocks (unaffiliated).................................................................. 167,000................. (14,000)................ 153,000................................
.......
54,000..............
.......
0...........................
2.21
Common stocks of affiliates..................................................................... 0............................ 0........................... 0...........................................
.......
(95,000).............
.......
0...........................
3.
Mortgage loans........................................................................................ 0............................ (9,000).................. (9,000)...................................
.......
0.......................
.......
0...........................
4.
Real Estate.............................................................................................. 0............................ 0........................... 0...........................................
.......
0.......................
.......
0...........................
.5
Contract Loans......................................................................................... 0............................ 0........................... 0...........................................
.......
0.......................
.......
0...........................
6.
Cash, cash equivalents and short term investments................................ 0............................ 9,000.................... 9,000....................................
.......
0.......................
.......
(2,000)...................
7.
Derivative instruments............................................................................. (137,000)................ 0........................... (137,000)...............................
.......
(76,000).............
.......
0...........................
8.
Othe invested assets............................................................................... 19,000................... (67,000)................ (48,000).................................
.......
145,000............
.......
(6,000)...................
9.
Aggregate write-in for capital gains (losses0........................................... 0............................ 13,000.................. 13,000..................................
.......
38,000..............
.......
(45,000).................
10.
Total capital gains (losses)...................................................................... 142,000................. (28,000)................ 114,000................................ 89,000.............. (123,000)...............
12
4
Change in
Unrealized Captial
Gain (Loss)
5
Change in
Unrealized Foreign
Exchange Capital
Gain (Loss)
Total gross invested income....................................................................................................................................................................
DETAILS OF WRITE-INS
Property and wind plans..........................................................................................................................................................................
..................................................................................................................................................................................................................
..................................................................................................................................................................................................................
EXHIBIT OF CAPITAL GAINS (LOSSES)
Management Fees......................................................................................................................................................................................................................
.....................................................................................................................................................................................................................................................
.....................................................................................................................................................................................................................................................
Summary of remaining write-ins for Line 15 from overflow page..............................................................................................................................................
Totals (Line 1501 thur 1503) (Line 15 above)............................................................................................................................................................................
Summary of remaining write-ins for Line 9 from overflow page..............................................................................................................
Totals (Lines 0901 thru 0903 plus 0988) (Line 9 above)........................................................................................................................
Aggregate write-ins for invested assets..................................................................................................................................................
Derivative Instruments.............................................................................................................................................................................
Other Invested Assets.............................................................................................................................................................................
Interest Expense.........................................................................................................................................................................................................................
Depreciation on real estate and other invested assets..............................................................................................................................................................
Aggregate write-ins for deductions from investment income.....................................................................................................................................................
Total deductions (Lines 11 through 15)......................................................................................................................................................................................
Net Investment Income (Line 10 minus Line 16).......................................................................................................................................................................
Cash, cash equivalents and short-term investments..............................................................................................................................
Common stocks of affiliates.....................................................................................................................................................................
Mortgage loans........................................................................................................................................................................................
Real Estate...............................................................................................................................................................................................
Contract Loans.........................................................................................................................................................................................
ANNUAL STATEMENT FOR THE YEAR 2018 OF THE FICTITIOUS INSURANCE COMPANY
EXHIBIT OF NET INVESTMENT INCOME
Investment expenses..................................................................................................................................................................................................................
Investment Taxes, licenses and fees, excluding federal income tax.........................................................................................................................................
U. S. Government bonds.........................................................................................................................................................................
Bonds exempt from U.S. tax....................................................................................................................................................................
Other Bonds (unaffiliated)........................................................................................................................................................................
Bonds of Affiliates....................................................................................................................................................................................
Preferred stocks (unaffliliated).................................................................................................................................................................
Preferred stocks of affiliates....................................................................................................................................................................
Common stocks (unaffiliated)..................................................................................................................................................................

ANNUAL STATEMENT FOR THE YEAR 2018 OF THE FICTITIOUS INSURANCE COMPANY
1. Summary of Significant Accounting Policies and Going Concern
A. Accounting Policies
22. Events Subsequent
23. Reinsurance
A. Unsecured Reinsurance Recoverable
B.
C.
Total
Direct Unearned Premium Reserve: $12,610,000
Direct Business $200,000
Reinsurance Assumed -
Reinsurance Ceded 11,000
Net $189,000
D. Uncollectible Reinsurance
E. Commutation of Ceded Reinsurance
F. Retroactive Reinsurance
Assumed Ceded
a. Reserves Transferred
(1) Initial Reserves 676,613$
(2) Adjustments - Prior Years 261,792
(3) Adjustments - Current Year (5,791)
(4) Current Total 932,614$
b. Consideration Paid or Received
(1) Initial Consideration 602,314$
(2) Adjustments - Prior Years 72,120
(3) Adjustments - Current Year -
(4) Current Total 674,434$
c. Paid Losses Reimbursed or Recovered
(1) Prior Years 755,052$
(2) Current Year 25,485
(3) Current Total 780,537$
d. Special Surplus from Retroactive Reinsurance
(1) Initial Surplus Gain or Loss 74,299$
(2) Adjustments - Prior Years 189,673
(3) Adjustments - Current Year (5,791)
(4) Current Year Restricted Surplus 135,715
(5) Cumulative Total Transferred to Unassigned Surplus 122,270$
e. All cedents and reinsurers included in the above transactions:
Company Assumed Ceded
Good Reinsurer 532,613$
Foreign Authorized 400,000$
f. Paid loss/LAE recoverable
Collateral Held
-$
-$Foreign Authorized
Paid Loss & ALAE Recoverable
302,000$
34,000$
Over 90 days overdue
-$
-$
Selected NOTES TO FINANCIAL STATEMENTS
Not applicable.
920,000$
(2) Accruals for contingent, sliding scale adjustment and other profit sharing commissions, net of reinsurance assumed and ceded,
amounted to $188,000 at December 31, 2018:
Reinsurance Assumed and Ceded
Reinsurance Recoverable in Dispute
1,595,000$124,000$ 11,691,000$
Fictitious Insurance Company prepares its statutory financial statements in conformity with accounting practices prescribed or permitted by the state of Florida. The state
of Florida requires that insurance companies domiciled in Florida prepare their statutory basis financial statements in accordance with the National Association of
Insurance Commissioners (NAIC) Accounting Practices and Procedures Manual, subject to any deviations prescribed or permitted by the Florida Insurance Commissioner.
The impact of any permitted accounting practices on policyholder surplus of the Company is not material.
The company had no material subsequent events through February 15, 2019.
The company had one reinsurer whose aggregate recoverable for ceded losses, loss adjustment expenses and unearned premiums recoverable as of December 31, 2018
exceeded 3% of the Company’s Surplus. The company was Good Reinsurer, F.E.I.N. xxxxxx. Its net recoverable was $4,189.000 or 14% of Surplus. Good Reinsurer has
always been current in its payments and is an A+ rated company by A.M. Best and is financially sound.
The company has a few recoverable in dispute, but they are not material.
(1) The following table sets forth the maximum return premium and commission equity due the reinsurers or the Company if all of the Company’s ceded reinsurance was
canceled as of December 31, 2018:
Not applicable.
Ceded Reinsurance Net Reinsurance
Unearned Premium Reserve Commission Equity Unearned Premium Reserve Commission Equity
14
Company
Good Reinsurer

ANNUAL STATEMENT FOR THE YEAR 2018 OF THE FICTITIOUS INSURANCE COMPANY
25. Changes in Incurred Losses and Loss Adjustment Expenses
26. Intercompany Pooling Arrangements
27. Structured Settlements
30. Premium Deficiency Reserves
31. High Deductibles
32. Discounting of Liabilities for Unpaid Losses or Unpaid Loss Adjustment Expenses
33. Asbestos/Environmental Reserves
A.
1. Direct - Asbestos: 2014 2015 2016 2017 2018
a. Beginning Reserves (including Case, Bulk +
IBNR Loss & LAE)
$ 6,268,000 $ 5,717,000 $ 4,439,000 $ 4,166,000 $ 3,957,000
b Incurred Losses and LAE - 49,000 249,000 353,000 262,000
c. Calendar Year Payments for Losses and LAE 551,000 1,328,000 522,000 561,000 478,000
d. Ending Reserves (including Case, Bulk +
IBNR Loss & LAE)
$
5,717,000 $ 4,438,000 $ 4,166,000 $ 3,958,000 $ 3,741,000
2. Assumed Reinsurance - Asbestos 2014 2015 2016 2017 2018
a. Beginning Reserves (including Case, Bulk +
IBNR Loss & LAE)
$ - $ - $ - $ - $ -
b Incurred Losses and LAE - - - - -
c. Calendar Year Payments for Losses and LAE - - - - -
d. Ending Reserves (including Case, Bulk +
IBNR Loss & LAE)
$
- $ - $ - $ - $ -
3. Net of Ceded Reinsurance - Asbestos 2014 2015 2016 2017 2018
a. Beginning Reserves (including Case, Bulk +
IBNR Loss & LAE)
$ 5,450,000 $ 5,023,000 $ 3,920,000 $ 3,709,000 $ 3,426,000
b Incurred Losses and LAE - 49,000 249,000 188,000 236,000
c. Calendar Year Payments for Losses and LAE 427,000 1,153,000 459,000 471,000 382,000
d. Ending Reserves (including Case, Bulk +
IBNR Loss & LAE)
$ 5,023,000 $ 3,919,000 $ 3,710,000 $ 3,426,000 $ 3,280,000
B. State the amount of ending reserves for Bulk and IBNR included in Part A (Loss and LAE)
a. Direct basis $ 3,116,000
b. Assumed Reinsurance basis -
c. Net of Ceded Reinsurance basis $ 2,782,000
C. State the amount of ending reserves for loss adjustment expenses included in A above (Case, Bulk and IBNR)
a. Direct basis $ 962,000
b. Assumed Reinsurance basis -
c. Net of Ceded Reinsurance basis $ 907,000
Selected NOTES TO FINANCIAL STATEMENTS
14
During the period from January 1, 2018 to December 31, 2018, the prior year-end total loss and loss adjustment expense reserves for The Company developed
favorably by $875,000. This development was driven mainly by better than expected loss and DCC development in the other liability, workers compensation and
homeowners segments. The deterioration in the commercial auto liability and commercial multi-peril segments offset some of this positive development.
Homeowners showed positive development in the 2017 accident year which was driven by better than expected loss development primarily related to catastrophe
losses. The deterioration in Commercial Auto was driven by worse than expected severity for 2008 through 2017. Asbestos and Environmental reserves developed
unfavorably and drove the large development for prior years.
The Company does not participate in any intercompany pooling.
The Company has purchased annuities from XYZ Life Insurance Company, under which the claimant is the payee and the Company is the owner of the annuity
contract, to fund structured settlements. The statement value of these annuities is $ 4,304,000. The annuities are treated as closed claims, but in the event that XYZ
Life Insurance Company fails to make the required annuity payments, the Company would be required to make such payments as not covered by state guaranty
associations.
The Company does not issue any policies with high deductible plans.
For Workers Compensation, the Company discounts its reserves for unpaid losses on a tabular basis with a discount rate of 3.5% based on United States Life
Tables. Reserves for other liability structured settlements are discounted at a rate of 4.5% and reflect the Individual Annuity Mortality table.
The amount of tabular discount reserves for Workers Compensation is $1,159,000 of which $495,000 is the discount on case reserves and $664,000 is the discount
on IBNR.
Does the Company have on the books or has it ever written an insured for which you have identified potential for the existence of a liability due to asbestos losses?
Yes (X) No ( )
Exposures for asbestos and environmental losses arise from liability coverage written many years ago. The methods of determining estimates for reported and
unreported losses and establishing resulting reserves and related reinsurance recoverables are periodically reviewed and updated. Conventional actuarial methods
are not utilized to establish these reserves. Reserve methods used include an analysis of exposure and claim payment patterns and recent settlements, judicial
Due to the uncertainties of legal issues such as coverage, potential liability etc. for these asbestos and environmental related claims the Company believes that these
claims could result in a liability that materially differs from current reserves.
The following tables summarize the activity for these asbestos and environmental claims for the past five years.
The Company has no premium deficiency reserves and investment income was considered in determining premium deficiency reserves.
The amount of tabular discount for Other Liability is $206,000 of which $21,000 is the discount on case reserves, $15,000 is the discount on IBNR and $170,000 is
the discount on structure settlements. The total amount of discount for Workers Compensation and Other Liability is $1,365,000.

ANNUAL STATEMENT FOR THE YEAR 2018 OF THE FICTITIOUS INSURANCE COMPANY
D.
1. Direct- Environmental:
2014
2015
2016
2017
2018
a. Beginning Reserves (including Case, Bulk
+ IBNR Loss & LAE)
$ 562,000 $ 659,000 $ 565,000 $ 551,000 $ 503,000
b
Incurred Losses and LAE
249,000
108,000
114,000
60,000
108,000
c.
Calendar Year Payments for Losses and LAE
152,000
202,000
128,000
108,000
118,000
d. Ending Reserves (including Case, Bulk +
IBNR Loss & LAE)
$ 659,000 $ 565,000 $ 551,000 $ 503,000 $ 493,000
2. Assumed Reinsurance - Environmental
2014
2015
2016
2017
2018
a. Beginning Reserves (including Case, Bulk
+ IBNR Loss & LAE)
$ - $ - $ - $ - $ -
b
Incurred Losses and LAE
-
-
-
-
-
c.
Calendar Year Payments for Losses and LAE
-
-
-
-
-
d. Ending Reserves (including Case, Bulk +
IBNR Loss & LAE)
$ - $ - $ - $ - $ -
3. Net of Ceded Reinsurance - Environmental
2014
2015
2016
2017
2018
a. Beginning Reserves (including Case, Bulk
+ IBNR Loss & LAE)
$ 558,000 $ 650,000 $ 556,000 $ 528,000 $ 471,000
b
Incurred Losses and LAE
248,000
108,000
94,000
47,000
102,000
c.
Calendar Year Payments for Losses and LAE
156,000
202,000
122,000
104,000
114,000
d. Ending Reserves (including Case, Bulk +
IBNR Loss & LAE)
$ 650,000 $ 556,000 $ 528,000 $ 471,000 $ 459,000
E. State the amount of ending reserves for Bulk and IBNR included in Part D (Loss and LAE)
a.
Direct Basis
$
428,000
b.
Assumed Reinsurance Basis:
-
c.
Net of Ceded Reinsurance Basis
$
425,000
F. State the amount of ending reserves for loss adjustment expenses included in D above (Case, Bulk and IBNR)
a.
Direct Basis
$
112,000
b.
Assumed Reinsurance Basis:
-
c.
Net of Ceded Reinsurance Basis
$
110,000
14
Does the Company have on the books, or has it ever written an insured for which you have identified a potential for the existence of a liability due to
environmental losses? Yes (X) No ( ).
Exposure for environmental losses arises from liability coverage written many years ago. The exposures include bodily injury and property damage losses.
Selected NOTES TO FINANCIAL STATEMENTS

1 2 3 4 5
2018 2017 2016 2015 2014
Gross Premiums Written (Page 8, Part 1B, Cols 1, 2 & 3)
1.
Liability lines (Lines 11.1,11.2,16,17.1,17.2,17.3,18.1,18.2,19.1,19.2,19.3, & 19.4)........... 13,281,000........ 13,843,000... 15,075,000..... 16,422,000..... 16,815,000.....
2.
Property lines (Lines 1, 2, 9, 12, 21, & 26)........................................................................... 5,566,000.......... 4,990,000..... 5,436,000....... 5,925,000....... 6,155,000.......
3.
Property and liability combined lines (Lines 3, 4, 5, 8, 22 & 27).......................................... 9,649,000.......... 8,936,000..... 8,651,000....... 8,544,000....... 8,355,000.......
4.
All other lines (Lines 6, 10, 13, 14, 15, 23, 24, 28, 29, 30 & 34).......................................... 138,000............. 316,000........ 357,000.......... 347,000.......... 345,000..........
5.
Nonproportional reinsurance lines (Lines 31, 32 & 33)........................................................ 0........................ 0................... 0..................... 0..................... 0.....................
6.
Total (Line 35)...................................................................................................................... 28,634,000........ 28,085,000... 29,519,000..... 31,238,000..... 31,670,000.....
Net Premiums Written (Page 8, Part 1B, Col 6)
7.
Liability lines (Lines 11.1,11.2,16,17.1,17.2,17.3,18.1,18.2,19.1,19.2,19.3, & 19.4)........... 12,578,000........ 12,020,000... 11,964,000..... 12,031,000..... 11,944,000.....
8.
Property lines (Lines 1, 2, 9, 12, 21, & 26)........................................................................... 4,796,000.......... 4,881,000..... 4,935,000....... 5,120,000....... 5,258,000.......
9.
Property and liability combined lines (Lines 3, 4, 5, 8, 22 & 27).......................................... 9,232,000.......... 8,880,000..... 8,470,000....... 8,290,000....... 8,077,000.......
10.
All other lines (Lines 6, 10, 13, 14, 15, 23, 24, 28, 29, 30 & 34).......................................... 146,000............. 155,000........ 152,000.......... 142,000.......... 84,000............
11.
Nonproportional reinsurance lines (Lines 31, 32 & 33)........................................................ 0........................ 0................... 0..................... 0..................... 0.....................
12.
Total (Line 35)...................................................................................................................... 26,752,000........ 25,936,000... 25,521,000..... 25,583,000..... 25,363,000.....
Statement of Income (Page 4)
13.
Net underwriting gain (loss) (Line 8).................................................................................... (2,142,000)......... 1,487,000..... 2,544,000....... 1,883,000....... 2,773,000.......
14.
Net investment gain (loss) (Line 11)..................................................................................... 4,305,000.......... 4,414,000..... 2,850,000....... 3,993,000....... 4,747,000.......
15.
Total other income (Line 15)................................................................................................ 32,000............... 48,000.......... 38,000............ 143,000.......... 47,000............
16.
Dividends to policyholders (Line 17).................................................................................... 46,000............... 32,000.......... 23,000............ 29,000............ 31,000............
17.
Federal and foreign income taxes incurred (Line 19)........................................................... (30,000).............. 963,000........ 1,489,000....... 1,378,000....... 1,304,000.......
18.
Net income (Line 20)............................................................................................................ 2,179,000.......... 4,954,000..... 3,920,000....... 4,612,000....... 6,232,000.......
Balance Sheet Lines (Pages 2 and 3)
19.
Total admitted assets excluding protected cell business (Page 2, Line 26, Col. 3)............. 100,000,000...... 99,686,000... 104,389,000... 104,063,000... 107,754,000...
20.
Premiums and considerations (Page 2, Col. 3):
20.1 In course of collection (Line 15.1).............................................................................. 2,626,000.......... 2,866,000..... 2,069,000....... 1,335,000....... 1,575,000.......
20.2 Deferred and not yet due (Line 15.2).......................................................................... 5,114,000.......... 4,927,000..... 4,811,000....... 5,229,000....... 5,344,000.......
20.3 Accrued retrospective premiums (Line 15.3).............................................................. 250,000............. 263,000........ 650,000.......... 433,000.......... 305,000..........
21.
Total liabilities excluding protected cell business (Page 3, line 26)..................................... 68,976,000........ 68,068,000... 68,595,000..... 69,490,000..... 70,387,000.....
22.
Losses (Page 3, Line 1)....................................................................................................... 41,894,000........ 40,933,000... 41,642,000..... 42,689,000..... 43,743,000.....
23.
Loss adjustment expenses (Page 3, Line 3)........................................................................ 9,663,000.......... 9,664,000..... 9,955,000....... 9,919,000....... 9,807,000.......
24.
Unearned premiums (Page 3, Line 9).................................................................................. 11,895,000........ 11,557,000... 11,207,000..... 11,397,000..... 11,403,000.....
25.
Capital paid up (Page 3, Lines 30 & 31).............................................................................. 108,000............. 108,000........ 108,000.......... 108,000.......... 108,000..........
26.
Surplus as regards policyholders (Page 3, Line 37)............................................................ 31,024,000........ 31,608,000... 35,793,000..... 32,572,000..... 34,567,000.....
Cash Flow (Page 5)
27.
Net cash from operations (Line 11)...................................................................................... 3,411,000.......... 5,017,000..... 3,942,000....... 3,906,000....... 5,298,000.......
Risk Based Capital Analysis
28.
Total adjusted capital........................................................................................................... 31,024,000........ 31,608,000... 35,793,000..... 32,572,000..... 34,567,000.....
29.
Authorized control level risk-based capital........................................................................... 5,588,000.......... 6,097,300..... 5,854,000....... 5,685,000....... 6,517,000.......
Percentage Distribution of Cash, Cash Equivalents and Invested Assets
(Page 2, Col3) (Item divided by Page 2, Line 12, Col. 3) x 100.0
30.
Bonds (Line 1)...................................................................................................................... 68...................... 66................. 68................... 70................... 72...................
31.
Stocks (Lines 2.1 & 2.2)....................................................................................................... 22...................... 22................. 21................... 18................... 18...................
32.
Mortgage loans on real estate (Lines 3.1 & 3.2).................................................................. 0........................ 0................... 0..................... 0..................... 0.....................
33.
Real Estate (Lines 4.1, 4.2 & 4.3)........................................................................................ 4........................ 4................... 4..................... 4..................... 4.....................
34.
Cash, cash equivalents and short term investments (Line 5)............................................... 2........................ 2................... 2..................... 4..................... 2.....................
35.
Contract loans (Line 6)......................................................................................................... 0........................ 0................... 0..................... 0..................... 0.....................
36.
Derivatives (Line 7).............................................................................................................. 0........................ 0................... 0..................... 0..................... 0.....................
37.
Other invested assets (Line 8)............................................................................................. 4........................ 5................... 4..................... 4..................... 4.....................
38.
Receivable for securities (Line 9)......................................................................................... 0........................ 0................... 0..................... 0..................... 0.....................
39.
Securities lending reinvested collateral assets (Line 10)..................................................... 0........................ 0................... 0..................... 0..................... 0.....................
40.
Aggregate write-ins for invested assets (Line 11)................................................................ (0)....................... (0).................. 0..................... 0..................... 0.....................
41.
Cash, cash equivalents and invested assets (Line 12)........................................................ 100.................... 100............... 100................. 100................. 100.................
Investments in Parent, Subsidiaries and Affiliates
42.
Affiliated bonds (Sch. D, Summary, Line 12, Col. 1)............................................................ 0........................ 0................... 0..................... 0..................... 0.....................
43.
Affiliated preferred stocks (Sch. D, Summary, Line 18, Col. 1)............................................ 0........................ 0................... 0..................... 0..................... 0.....................
44.
Affiliated common stocks (Sch. D, Summary, Line 24, Col. 1)............................................. 0........................ 0................... 0..................... 0..................... 0.....................
45.
Affiliated short-term investments (Schedule DA, Verification, Col 5, Line 10)..................... 0........................ 0................... 0..................... 0..................... 0.....................
46.
Affiliated mortgage loans on real estate............................................................................... 0........................ 0................... 0..................... 0..................... 0.....................
47.
All other affiliated................................................................................................................. 0........................ 0................... 0..................... 0..................... 0.....................
48.
Total of above lines 42 to 47................................................................................................ 0........................ 0................... 0..................... 0..................... 0.....................
49.
Total investment in parent included in Lines 42 to 47 above............................................... 0........................ 0................... 0..................... 0..................... 0.....................
50.
Percentage of investments in parent, subsidiaries and affiliates to surplus
as regard policyholders (Line 48 above divided by Page 3, Col. 1, Line 37 x 100.0)......... 0........................ 0................... 0..................... 0..................... 0.....................
17
ANNUAL STATEMENT FOR THE YEAR 2018 OF THE FICTITIOUS INSURANCE COMPANY
FIVE YEAR HISTORICAL DATA

1 2 3 4 5
2018 2017 2016 2015 2014
Capital and Surplus Accounts (Page 4)
51.
Net unrealized capital gains (losses) (Line 24)........................................................................... 81,000............ 119,000.......... 3,250,000....... 373,000.......... 1,743,000.......
52.
Dividends to stockholders (Line 35)............................................................................................ (2,617,000)...... (10,024,000).... (7,327,000)...... (5,973,000)...... (7,754,000)......
53.
Change in surplus as regards policyholders for the year (Line 38)............................................. (585,000)......... (4,185,000)...... 3,221,000....... (1,995,000)...... (753,000).........
Gross Losses Paid (Page 9, Part 2, Cols. 1 & 2)
54.
Liability lines (lines 11.1,11.2,16,17.1,17.2,17.3,18.1,18.2,19.1,19.2,19.3, & 19.4)................... 8,335,000....... 8,961,000....... 8,829,000....... 9,280,000....... 9,610,000.......
55.
Property lines (lines 1, 2, 9, 12, 21, & 26)................................................................................... 3,072,000....... 2,799,000....... 3,077,000....... 3,144,000....... 2,835,000.......
56.
Property and liability combined lines (Lines 3, 4, 5, 8, 22 & 27)................................................. 6,239,000....... 4,456,000....... 3,951,000....... 3,906,000....... 3,437,000.......
57.
All other lines (Lines 6, 10, 13, 14, 15, 23, 24, 28, 29, 30 & 34)................................................. 167,000.......... 161,000.......... 173,000.......... 327,000.......... 905,000..........
58.
Nonproportional reinsurance lines (Lines 31, 32 & 33)............................................................... 0..................... 0..................... 0..................... 0..................... 0.....................
59.
Total (Line 35)............................................................................................................................. 17,813,000..... 16,377,000..... 16,030,000..... 16,657,000..... 16,787,000.....
Net Losses Paid (Page 9, Part 2, Col 4)
60.
Liability lines (lines 11.1,11.2,16,17.1,17.2,17.3,18.1,18.2,19.1,19.2,19.3, & 19.4)................... 6,926,000....... 6,510,000....... 6,047,000....... 6,804,000....... 6,500,000.......
61.
Property lines (lines 1, 2, 9, 12, 21, & 26)................................................................................... 2,911,000....... 2,582,000....... 2,663,000....... 2,655,000....... 2,344,000.......
62.
Property and liability combined lines (Lines 3, 4, 5, 8, 22 & 27)................................................. 5,991,000....... 4,328,000....... 3,932,000....... 3,905,000....... 3,259,000.......
63.
All other lines (Lines 6, 10, 13, 14, 15, 23, 24, 28, 29, 30 & 34)................................................. 118,000.......... 86,000............ 102,000.......... 89,000............ 270,000..........
64.
Nonproportional reinsurance lines (Lines 31, 32 & 33)............................................................... 0..................... 0..................... 0..................... 0..................... 0.....................
65.
Total (Line 35)............................................................................................................................. 15,946,000..... 13,506,000..... 12,744,000..... 13,453,000..... 12,373,000.....
Operating Percentages
(Page 4) (Item divided by Page 4, Line1) x 100.0
66.
Premiums earned (Line 1)........................................................................................................... 100.0.............. 100.0.............. 100.0.............. 100.0.............. 100.0..............
67.
Losses incurred (Line 2).............................................................................................................. 63.8................ 50.1................ 45.7................ 48.6................ 46.4................
68.
Loss expenses incurred (Line 3)................................................................................................. 12.3................ 11.8................ 12.4................ 12.8................ 12.2................
69.
Other underwriting expenses incurred (Line 4)........................................................................... 32.0................ 32.3................ 32.0................ 31.2................ 30.4................
70.
Net underwriting gain (loss) (Line 8)........................................................................................... (8.1)................. 5.8.................. 9.9.................. 7.4.................. 10.9................
Other Percentages
71.
Other underwriting expenses to net premiums written (Page 4, Lines 4 + 5 - 15
divided by Page 8, Part 1B, Col. 6, Line 35 x 100.0)................................................................. 31.6................ 31.6................ 32.0................ 30.6................ 30.3................
72.
Losses and loss expense incurred to premiums earned
(Page 4, Lines 2 + 3 divided by Page 4, Line 1 x 100.0)............................................................ 76.0................ 61.9................ 58.1................ 61.4................ 58.6................
73.
Net premiums written to policyholders' surplus (Page 8, Part 1B,
Col. 6, Line 35, divided by Page 3, Line 37, Col.1 x 100.0)....................................................... 86.2................ 82.1................ 71.3................ 74.0................ 67.9................
One Year Loss Development (000 omitted)
74.
Development in estimated losses and loss expenses incurred prior
to current year (Schedule P, Part 2-Summary, Line 12, Col.11)................................................. (875)................ (1,354)............. (1,618)............. (1,935)............. (918)................
75.
Percent development of losses and loss expenses incurred to policyholders' surplus
of prior year end (Line 73 above divided by Page 4, Line 21, Col. 1 x 100).............................. (2.8)................. (3.8)................. (5.0)................. (5.6)................. (2.6).................
Two Year Loss Development (000 omitted)
76.
Development in estimated losses and loss expenses incurred 2 years before the
current year and prior year (Schedule P, Part 2-Summary, Line 12, Col.12)............................. (2,602)............. (2,906)............. (3,680)............. (2,544)............. (1,059).............
77.
Percent of development of losses and loss expenses incurred to
reported policyholders' surplus of second prior year end
(Line 75 above divided by Page 4, Line 21, Col. 2 x 100.0)........................................................ (7.3)................. (8.9)................. (10.6)............... (7.3)................. (3.0).................
18
ANNUAL STATEMENT FOR THE YEAR 2018 OF THE FICTITIOUS INSURANCE COMPANY
FIVE YEAR HISTORICAL DATA

1 2 3 4 5 9 10 11 12 13 14 15
6 7 8
Federal ID
Number
NAIC
Company
Code Name of Reinsured
Domicillary
Jurisdition
Assumed
Premium
Paid
Losses and Loss
Adjustment
Expenses
Known Case
Losses and
LAE Col. 6 + 7
Contingent
Commissions
Payable
Assumed
Premiums
Receivable
Unearned
Premium
Funds Held by
or Depostied
With
Reinsured
Companies
Letters of Credit
Posted
Amount of Assets
Pledged or
Compensating
Balances to
Secure Letters of
Credit
Amount of
Assets
Pledged or
Collateral
Held in Trust
Affiliates - U.S. Intercompany Pooling:
0199999 Affiliates - U.S. Intercompany Pooling: 0................... 0....................... 0......................... 0..................... 0..................... 0..................... 0..................... 0..................... 0..................... 0...................... 0......................... 0...................
Affiliates U.S. Non-Pool:
0299999 Affiliates U.S. Non-Pool - Captive: 0................... 0....................... 0......................... 0..................... 0..................... 0..................... 0..................... 0..................... 0..................... 0...................... 0......................... 0...................
0399999 Affiliates U.S. Non-Pool - Other: 0................... 0....................... 0......................... 0..................... 0..................... 0..................... 0..................... 0..................... 0..................... 0...................... 0......................... 0...................
0499999 Affiliates U.S. Non-Pool - Total: 0................... 0....................... 0......................... 0..................... 0..................... 0..................... 0..................... 0..................... 0..................... 0...................... 0......................... 0...................
Affiliates Other (Non - U.S.):
0599999 Affiliates - Other (Non - U.S.) - Captive: 0................... 0....................... 0......................... 0..................... 0..................... 0..................... 0..................... 0..................... 0..................... 0...................... 0......................... 0...................
0699999 Affiliates - Other (Non - U.S.) - Other: 0................... 0....................... 0......................... 0..................... 0..................... 0..................... 0..................... 0..................... 0..................... 0...................... 0......................... 0...................
0799999 Affiliates - Other (Non - U.S.) - Total: 0................... 0....................... 0......................... 0..................... 0..................... 0..................... 0..................... 0..................... 0..................... 0...................... 0......................... 0...................
0899999 Total Affiliates 0................... 0....................... 0......................... 0..................... 0..................... 0..................... 0..................... 0..................... 0..................... 0...................... 0......................... 0...................
Other U.S. Unaffiliated Insurers
0999999 Other U. S. Unaffiliated Insurers 0................... 0....................... 0......................... 0..................... 0..................... 0..................... 0..................... 0..................... 0..................... 0...................... 0......................... 0...................
Pools and Associations - Mandatory Pools, Associations or Other Similar Facilities
1099999 Pools and Associations - Mandatory Pools, Associations or Other Similar Facilities 0................... 0....................... 0......................... 0..................... 0..................... 0..................... 0..................... 0..................... 0..................... 0...................... 0......................... 0...................
Pools and Associations - Voluntary Pools, Associations or Other Similar Facilities
1199999 Pools and Associations - Voluntary Pools, Associations or Other Similar Facilities 0................... 0....................... 0......................... 0..................... 0..................... 0..................... 0..................... 0..................... 0..................... 0...................... 0......................... 0...................
1299999 Total Pools and Associations 0................... 0....................... 0......................... 0..................... 0..................... 0..................... 0..................... 0..................... 0..................... 0...................... 0......................... 0...................
Other Non-US Insurers
0999999 Other Non-US Insurers 0................... 0....................... 0......................... 0..................... 0..................... 0..................... 0..................... 0..................... 0..................... 0...................... 0......................... 0...................
9999999 Totals 0................... 0....................... 0......................... 0..................... 0..................... 0..................... 0..................... 0..................... 0..................... 0...................... 0......................... 0...................
ANNUAL STATEMENT FOR THE YEAR 2018 OF THE FICTITIOUS INSURANCE COMPANY
SCHEDULE F Part 1
Assumed Reinsurance as of December 31, Current Year (000 Omitted)
20
Reinsurance Recoverable on

1 2
3 4
5
6
ID Number
NAIC Company
Code Name of Company Date of Contract Original Premium Reinsurance Premium
21
ANNUAL STATEMENT FOR THE YEAR 2018 OF THE FICTITIOUS INSURANCE COMPANY
SCHEDULE F - PART 2
NONE
Premium Portfolio Reinsurance Effected of (Canceled) during Current Year

ANNUAL STATEMENT FOR THE YEAR December 31, 2018 OF THE Fictitious Insurance Co.
SCHEDULE F - PART 3
Ceded Reinsurance as of December 31, Current Year (000 Omitted)
1 2 3 4 5 6 7 8 9 10 11 12 13 14 15 16 17 18 19 20
ID Number
NAIC Company
Code Name of Reinsurer
Domiciliary
Jurisdiction Special Code
Reinsurance
Premiums
Ceded Paid Losses Paid LAE
Known Case
Loss Reserves
Known Case
LAE Reserves
IBNR Loss
Reserves
IBNR LAE
Reserves
Unearned
Premiums
Contingent
Commissions
Cols. 7
through 14
Totals
Amount in
Dispute
Included in
Column 15
Ceded
Balances
Payable
Other Amounts
Due to
Reinsurers
Net Amount
Recoverable
From
Reinsurers
Cols. 15 - [17
+ 18]
Funds Held by
Company
Under
Reinsurance
Treaties
Authorized
Authorized - Affiliates - U.S. Intercompany Pooling:
199999 Total Authorized - Affiliates - U.S. Intercompany Pooling 0 0 0 0 0 0 0 0 0 0 0 0 0 0 0
Authorized - Affiliates - U.S. Non-Pool:
11-111 233333 Affiliated Non-Pool 0 0 0 0 0 0 0 0 0 0 0 0 0 0 0
499999 Total Authorized - Affiliates - U.S. Non-Pool 0 0 0 0 0 0 0 0 0 0 0 0 0 0 0
899999 Authorized - Affiliates 0 0 0 0 0 0 0 0 0 0 0 0 0 0 0
Authorized - Other U.S. Unaffiliated Insurers:
31-123 11111 Good Reinsurer AL 379 258 0 2,329 116 1,000 174 191 6 4,074 0 0 0 4,074 0
43-145 22222 Overdue Reinsurer TX 130 10 0 237 12 376 51 59 0 745 4 13 0 732 0
76-345 33333 Slightly Overdue Reinsurer NY 529 64 0 1,525 75 803 119 282 5 2,873 0 94 0 2,779 0
999999 Authorized - Other U.S. Unaffiliated Insurers 1,038 332 0 4,091 203 2,179 344 532 11 7,692 4 107 0 7,585 0
Authorized - Pools - Voluntary Pools:
AA-44111 555555 Pooling Company NY 111 0 0 203 4 322 49 50 0 628 0 11 0 617 0
1199999 Authorized - Pools - Voluntary Pools 111 0 0 203 4 322 49 50 0 628 0 11 0 617 0
Authorized - Other Non - U.S. Insurers:
AA-331234 544445 Foreign Authorized GB 444 34 0 813 40 1,287 36 201 0 2,411 0 255 0 2,156 0
1299999 Authorized - Other Non - U.S. Insurers 444 34 0 813 40 1,287 36 201 0 2,411 0 255 0 2,156 0
1399999 Authorized - Protected Cells 0 0 0 0 0 0 0 0 0 0 0 0 0 0 0
1499999 Authorized 1,593 366 0 5,107 247 3,788 429 783 11 10,731 4 373 0 10,358 0
Unauthorized
Unauthorized Affiliates:
2299999 Unauthorized - Affiliates 0 0 0 0 0 0 0 0 0 0 0 0 0 0 0
Unauthorized - Other U.S. Unaffiliated Insurers:
13-1063 333 Reinsurer A NY 6 8 0 10 1 16 4 3 0 42 0 1 0 41 20
11-0002 444 Reinsurer B KS 28 2 0 51 3 80 22 13 0 171 0 3 0 168 0
11-0000 555 Reinsurer C CA 28 2 0 51 3 58 22 13 0 149 50 3 0 146 20
2399999 Unauthorized - Other U.S. Unaffiliated Insurers 62 12 0 112 7 154 48 29 0 362 50 7 0 355 40
Unauthorized -Other Non - U.S Insurers:
12-00001 66666 Reinsurer D GBR 4 6 1 0 10 1 16 4 3 0 35 0 1 0 34 30
12-00002 77777 Reinsurer E GBR 20 2 0 51 3 80 22 13 0 171 0 2 0 169 100
2699999 Unauthorized -Other Non - U.S Insurers 26 3 0 61 4 96 26 16 0 206 0 3 0 203 130
2799999 Unauthorized -Protected Cells 0 0 0 0 0 0 0 0 0 0 0 0 0 0 0
2899999 Unauthorized 88 15 0 173 11 250 74 45 0 568 50 10 0 558 170
Certified
Certified - Other Non - U.S. Insurers:
CR-1234567
00000 ABC Reinsurance LTD BMU 137 15 0 39 0 0 0 67 0 121 0 37 0 84 0
CR-2345678
00000 DEF Reinsurance LTD DEU 53 30 0 24 0 0 0 22 0 76 0 11 0 65 0
CR-3456789
00000 GHI Reinsurance LTD CHE 11 0 0 0 0 0 0 3 0 3 0 9 0 (6) 0
4099999 Certified - Other Non - U.S. Insurers 201 45 0 63 0 0 0 92 0 200 0 57 0 143 0
4199999 Certified - Protected Cells 0 0 0 0 0 0 0 0 0 0 0 0 0 0 0
4299999 Certified 201 45 0 63 0 0 0 92 0 200 0 57 0 143 0
4399999 Total Authorized, Unauthorized & Certified Excluding Protected Cell 1,882 426 0 5,343 258 4,038 503 920 11 11,499 54 440 0 11,059 170
4499999 Total Protected Cell 0 0 0 0 0 0 0 0 0 0 0 0 0 0 0
9999999 Totals - Schedule F, Part 3 1,882 426 0 5,343 258 4,038 503 920 11 11,499 54 440 0 11,059 170
22.1
Reinsurance Recoverable On Reinsurance Payable

ANNUAL STATEMENT FOR THE YEAR December 31, 2018 OF THE Fictitious Insurance Co.
25 26 27
21 22 23 24 28 29 30 31 32 33 34 35 36
Multiple
Beneficiary
Trusts
Letters of
Credit
Issuing or
Confirming
Bank
Reference
Number
Single
Beneficiary
Trusts & Other
Allowable
Collateral
Total Amount
Recoverable
From
Reinsurers
Less Penalty
(Cols. 15 - 27)
Stressed
Recoverable
(Col. 28 *
120%)
Reinsurance
Payable & Funds
Held (Cols.
17+18+20; but not
in excess of Col.
29)
Stressed Net
Recoverable
(Cols. 29- 30)
Total
Collateral
(Cols. 21 + 22
+ 24, not in
Excess of Col.
31)
Stressed Net
Recoverable
Net of
Collateral
Offsets (Cols.
31 - 32)
Reinsurer
Designation
Equivalent
Credit Risk on
Collateralized
Recoverables (Col. 32 *
Factor Applicable to
Reinsurer Designation
Equivalent in Col. 34)
Credit Risk on
Uncollateralized
Recoverables (Col. 33 *
Factor Applicable to
Reinsurer Designation
Equivalent in Col. 34)
Authorized
Authorized - Affiliates - U.S. Intercompany Pooling:
199999 Total Authorized - Affiliates - U.S. Intercompany Pooling 0 0 0 0 0 0 0 0 0 0 0 0 - -
Authorized - Affiliates - U.S. Non-Pool:
11-111 Affiliated Non-Pool 0 0 0 0 0 0 0 0 0 0 0 0 - -
499999 Total Authorized - Affiliates - U.S. Non-Pool 0 0 0 0 0 0 0 0 0 0 0 0 0 0
899999 Authorized - Affiliates 0 0 0 0 0 0 0 0 0 0 0 0 0 0
Authorized - Other U.S. Unaffiliated Insurers:
31-123 Good Reinsurer 0 0 0 0 4,074 0 4,074 4,889 0 4,889 0 4,889 1 - 176
43-145 Overdue Reinsurer 0 515 0004 0 528 217 43 702 842 13 829 515 314 1 19 11
76-345 Slightly Overdue Reinsurer 0 0 0 94 2,779 1 2,872 3,446 94 3,352 0 3,352 2 - 137
999999 Authorized - Other U.S. Unaffiliated Insurers 0 515 0 622 7,070 44 7,648 9,177 107 9,070 515 8,555 19 325
Authorized - Pools - Voluntary Pools:
AA-44111 Pooling Company 0 0 0 11 617 0 628 754 11 743 0 743 7 - 74
1199999 Authorized - Pools - Voluntary Pools 0 0 0 11 617 0 628 754 11 743 0 743 0 74
Authorized - Other Non - U.S. Insurers:
AA-331234 Foreign Authorized 0 2,500 0008 0 2,411 0 2 2,409 2,891 255 2,636 2,500 136 2 103 6
1299999 Authorized - Other Non - U.S. Insurers 0 2,500 0 2,411 0 2 2,409 2,891 255 2,636 2,500 136 103 6
1399999 Authorized - Protected Cells 0 0 0 0 0 0 0 0 0 0 0 0 - -
1499999 Authorized 0 3,015 0 3,044 7,687 46 10,685 12,822 373 12,449 3,015 9,434 121 405
Unauthorized
Unauthorized Affiliates:
2299999 Unauthorized - Affiliates 0 0 0 0 0 0 0 0 0 0 0 0 - -
Unauthorized - Other U.S. Unaffiliated Insurers:
13-1063 Reinsurer A 0 0 0 21 21 22 20 24 21 3 0 3 6 - 0
11-0002 Reinsurer B 0 93 0001 0 96 75 75 96 115 3 112 93 19 6 5 3
11-0000 Reinsurer C 10 0 0 33 116 126 23 28 23 5 5 0 6 0 -
2399999 Unauthorized - Other U.S. Unaffiliated Insurers 10 93 0 150 212 223 139 167 47 120 98 22 5 3
Unauthorized -Other Non - U.S Insurers:
12-00001 Reinsurer D 0 0 0 15 0 0 35 42 31 11 0 11 6 - 2
12-00002 Reinsurer E 0 68 0003 0 170 1 1 170 204 102 102 68 34 3 3 2
2699999 Unauthorized -Other Non - U.S Insurers 0 68 0 185 1 1 205 246 133 113 68 45 3 3
2799999 Unauthorized -Protected Cells 0 0 0 0 0 0 0 0 0 0 0 0 - -
2899999 Unauthorized 10 161 0 335 213 224 344 413 180 233 166 67 8 6
Certified
Certified - Other Non - U.S. Insurers:
CR-1234567
ABC Reinsurance LTD 0 15 0094 0 52 69 9 112 134 37 97 15 82 2 1 3
CR-2345678
DEF Reinsurance LTD 40 22 0045 0 73 3 4 72 86 11 75 62 13 2 3 1
CR-3456789
GHI Reinsurance LTD 0 0 0 3 0 0 3 4 4 0 0 0 2 - -
4099999 Certified - Other Non - U.S. Insurers 40 37 0 128 72 13 187 224 52 173 77 96 3 4
4199999 Certified - Protected Cells 0 0 0 0 0 0 0 0 0 0 0 0 - -
4299999 Certified 40 37 0 128 72 13 187 224 52 173 77 96 3 4
4399999 Total Authorized, Unauthorized & Certified 50 3,213 0 3,507 7,972 283 11,216 13,459 605 12,854 3,258 9,597 132 415
4499999 Total Protected Cell 0 0 0 0 0 0 0 0 0 0 0 0 0 0
9999999 Totals - Schedule F, Part 3 50 3,213 0 3,507 7,972 283 11,216 13,459 605 12,854 3,258 9,597 132 415
ID Number
Collateral Ceded Reinsurance Credit Risk
Total Funds
Held,
Payables &
Collateral
SCHEDULE F - PART 3
Ceded Reinsurance as of December 31, Current Year (000 Omitted)
Net
Recoverable
Net of Funds
Held &
Collateral
Applicable
Sch. F
Penalty
(Col. 78)
22.2
Name of Reinsurer From Col. 3

ANNUAL STATEMENT FOR THE YEAR December 31, 2018 OF THE Fictitious Insurance Co.
44 45 46 47 48 49 50 51 52 53
37 43
38 39 40 41 42
1 - 29 Days 30 - 90 Days 91 - 120 Days
Over 120
Days
Total Overdue
Cols. 38 + 39
+ 40 + 41
Total Due Cols.
37 + 42 (In total
should equal
Cols. 7 + 8)
Authorized
Authorized - Affiliates - U.S. Intercompany Pooling:
199999 Total Authorized - Affiliates - U.S. Intercompany Pooling 0 0 0 0 0 0 0 0 0 0 0 0 0.0% 0.0% 0.0% YES 0
Authorized - Affiliates - U.S. Non-Pool:
11-111 Affiliated Non-Pool 0 0 0 0 0 0 0 0 0 0 0 0 0.0% 0.0% 0.0% YES 0
499999 Total Authorized - Affiliates - U.S. Non-Pool 0 0 0 0 0 0 0 0 0 0 0 0 0.0% 0.0% 0.0% 0
899999 Authorized - Affiliates 0 0 0 0 0 0 0 0 0 0 0 0 0.0% 0.0% 0.0% 0
Authorized - Other U.S. Unaffiliated Insurers:
31-123 Good Reinsurer 248 10 0 0 0 10 258 0 0 258 0 0 3.9% 0.0% 0.0% YES 0
43-145 Overdue Reinsurer 0 0 0 0 10 10 10 0 0 10 10 0 100.0% 100.0% 100.0% NO 0
76-345 Slightly Overdue Reinsurer 54 0 5 5 0 10 64 4 0 60 5 0 15.6% 8.3% 0.0% YES 5
999999 Authorized - Other U.S. Unaffiliated Insurers 302 10 5 5 10 30 332 4 0 328 15 0 9.0% 4.6% 3.0% 5
Authorized - Pools - Voluntary Pools:
AA-44111 Pooling Company 0 0 0 0 0 0 0 0 0 0 0 0 0.0% 0.0% 0.0% YES 0
1199999 Authorized - Pools - Voluntary Pools 0 0 0 0 0 0 0 0 0 0 0 0 0.0% 0.0% 0.0% 0
Authorized - Other Non - U.S. Insurers:
AA-331234 Foreign Authorized 26 0 0 8 0 8 34 0 0 34 8 0 23.5% 23.5% 0.0% NO 0
1299999 Authorized - Other Non - U.S. Insurers 26 0 0 8 0 8 34 0 0 34 8 0 23.5% 23.5% 0.0% 0
1399999 Authorized - Protected Cells 0 0 0 0 0 0 0 0 0 0 0 0 0.0% 0.0% 0.0% YES 0
1499999 Authorized 328 10 5 13 10 38 366 4 0 362 23 0 10.4% 6.4% 2.7% 5
Unauthorized
Unauthorized Affiliates:
2299999 Unauthorized - Affiliates 0 0 0 0 0 0 0 0 0 0 0 0 0.0% 0.0% 0.0% YES 0
Unauthorized - Other U.S. Unaffiliated Insurers:
13-1063 Reinsurer A 3 0 0 5 0 5 8 0 0 8 5 0 59.3% 59.3% 0.0% NO 0
11-0002 Reinsurer B 1 0 0 1 0 1 2 0 0 2 1 0 50.0% 50.0% 0.0% NO 0
11-0000 Reinsurer C 2 0 0 0 0 0 2 2 0 0 0 0 0.0% 0.0% 0.0% YES 0
2399999 Unauthorized - Other U.S. Unaffiliated Insurers 6 0 0 6 0 6 12 2 0 10 6 0 48.3% 57.6% 0.0% 0
Unauthorized -Other Non - U.S Insurers:
12-00001 Reinsurer D 0 1 0 0 0 1 1 0 0 1 0 0 100.0% 0.0% 0.0% YES 0
12-00002 Reinsurer E 2 0 0 0 0 0 2 0 0 2 0 0 0.0% 0.0% 0.0% YES 0
2699999 Unauthorized -Other Non - U.S Insurers 2 1 0 0 0 1 3 0 0 3 0 0 33.3% 0.0% 0.0% 0
2799999 Unauthorized -Protected Cells 0 0 0 0 0 0 0 0 0 0 0 0 0.0% 0.0% 0.0% YES 0
2899999 Unauthorized 8 1 0 6 0 7 15 2 0 13 6 0 45.4% 44.7% 0.0% 0
Certified
Certified - Other Non - U.S. Insurers:
CR-1234567
ABC Reinsurance LTD 15 0 0 0 0 0 15 0 0 15 0 9 0.0% 0.0% 0.0% YES 0
CR-2345678
DEF Reinsurance LTD 10 0 0 20 0 20 30 0 0 30 20 20 66.7% 40.0% 0.0% NO 0
CR-3456789
GHI Reinsurance LTD 0 0 0 0 0 0 0 0 0 0 0 0 0.0% 0.0% 0.0% YES 0
4099999 Certified - Other Non - U.S. Insurers 25 0 0 20 0 20 45 0 0 45 20 29 44.4% 27.0% 0.0% 0
4199999 Certified - Protected Cells 0 0 0 0 0 0 0 0 0 0 0 0 0.0% 0.0% 0.0% YES 0
4299999 Certified 25 0 0 20 0 20 45 0 0 45 20 29 44.4% 27.0% 0.0% 0
4399999 Total Authorized, Unauthorized & Certified 361 11 5 39 10 65 426 6 0 420 49 29 15.2% 10.9% 2.3% 5
4499999 Total Protected Cell 0 0 0 0 0 0 0 0 0 0 0 0 0.0% 0.0% 0.0% 0
9999999 Totals - Schedule F, Part 3 361 11 5 39 10 65 426 6 0 420 49 29 15.2% 10.9% 2.3% 5
SCHEDULE F - PART 3
Ceded Reinsurance as of December 31, Current Year (000 Omitted)
22.3
ID Number
From Col. 1 Name of Reinsurer From Col. 3
Reinsurance Recoverable on Paid Losses and Paid Loss Adjustment Expenses
Overdue
Total Recoverable
on Paid Losses &
LAE Amounts in
Dispute Included in
Col. 43
Recoverable on
Paid Losses & LAE
Over 90 Days Past
Due Amounts in
Dispute Included in
Cols. 40 & 41
Is the Amount in
Col. 50 Less
Than 20%? (Yes
or No)
Amounts in Col.
47 for Reinsurers
with Values Less
Than 20% in Col.
50Current
Total Recoverable
on Paid Losses &
LAE Amounts Not in
Dispute (Cols 43 -
44)
Recoverable on
Paid Losses & LAE
Over 90 Days Past
Due Amounts Not in
Dispute (Cols. 40 +
41 - 45)
Amounts
Received Prior
90 Days
Percentage
Overdue Col.
42/Col. 43
Percentage of
Amounts More
Than 90 Days
Overdue Not in
Dispute (Col.
47/[Cols. 46 +
48])
Percentage More
Than 120 Days
Overdue (Col.
41/Col. 43)

ANNUAL STATEMENT FOR THE YEAR December 31, 2018 OF THE Fictitious Insurance Co.
54 55 56 57 58 59 60 61 62 63 64 65 69
66 67 68
Total Collateral
Provided (Col. 20
+Col. 21+ Col. 22+
Col.24; not to
Exceed Col. 63)
Net Unsecured
Recoverable for
Which Credit is
Allowed (Col. 63 -
Col. 66)
20% of Amount in
Col. 67
Authorized
Authorized - Affiliates - U.S. Intercompany Pooling:
199999 Total Authorized - Affiliates - U.S. Intercompany Pooling
XXX XXX XXX XXX XXX XXX XXX XXX XXX XXX XXX XXX XXX XXX XXX XXX
Authorized - Affiliates - U.S. Non-Pool:
11-111 Affiliated Non-Pool
XXX XXX XXX XXX XXX XXX XXX XXX XXX XXX XXX XXX XXX XXX XXX XXX
499999 Total Authorized - Affiliates - U.S. Non-Pool
XXX XXX XXX XXX XXX XXX XXX XXX XXX XXX XXX XXX XXX XXX XXX XXX
899999 Authorized - Affiliates
XXX XXX XXX XXX XXX XXX XXX XXX XXX XXX XXX XXX XXX XXX XXX XXX
Authorized - Other U.S. Unaffiliated Insurers:
31-123 Good Reinsurer
XXX XXX XXX XXX XXX XXX XXX XXX XXX XXX XXX XXX XXX XXX XXX XXX
43-145 Overdue Reinsurer
XXX XXX XXX XXX XXX XXX XXX XXX XXX XXX XXX XXX XXX XXX XXX XXX
76-345 Slightly Overdue Reinsurer
XXX XXX XXX XXX XXX XXX XXX XXX XXX XXX XXX XXX XXX XXX XXX XXX
999999 Authorized - Other U.S. Unaffiliated Insurers
XXX XXX XXX XXX XXX XXX XXX XXX XXX XXX XXX XXX XXX XXX XXX XXX
Authorized - Pools - Voluntary Pools:
AA-44111 Pooling Company
XXX XXX XXX XXX XXX XXX XXX XXX XXX XXX XXX XXX XXX XXX XXX XXX
1199999 Authorized - Pools - Voluntary Pools
XXX XXX XXX XXX XXX XXX XXX XXX XXX XXX XXX XXX XXX XXX XXX XXX
Authorized - Other Non - U.S. Insurers:
AA-331234 Foreign Authorized
XXX XXX XXX XXX XXX XXX XXX XXX XXX XXX XXX XXX XXX XXX XXX XXX
1299999 Authorized - Other Non - U.S. Insurers
XXX XXX XXX XXX XXX XXX XXX XXX XXX XXX XXX XXX XXX XXX XXX XXX
1399999 Authorized - Protected Cells
XXX XXX XXX XXX XXX XXX XXX XXX XXX XXX XXX XXX XXX XXX XXX XXX
1499999 Authorized
XXX XXX XXX XXX XXX XXX XXX XXX XXX XXX XXX XXX XXX XXX XXX XXX
Unauthorized
Unauthorized Affiliates:
2299999 Unauthorized - Affiliates
XXX XXX XXX XXX XXX XXX XXX XXX XXX XXX XXX XXX XXX XXX XXX XXX
Unauthorized - Other U.S. Unaffiliated Insurers:
13-1063 Reinsurer A
XXX XXX XXX XXX XXX XXX XXX XXX XXX XXX XXX XXX XXX XXX XXX XXX
11-0002 Reinsurer B
XXX XXX XXX XXX XXX XXX XXX XXX XXX XXX XXX XXX XXX XXX XXX XXX
11-0000 Reinsurer C
XXX XXX XXX XXX XXX XXX XXX XXX XXX XXX XXX XXX XXX XXX XXX XXX
2399999 Unauthorized - Other U.S. Unaffiliated Insurers
XXX XXX XXX XXX XXX XXX XXX XXX XXX XXX XXX XXX XXX XXX XXX XXX
Unauthorized -Other Non - U.S Insurers:
12-00001 Reinsurer D
XXX XXX XXX XXX XXX XXX XXX XXX XXX XXX XXX XXX XXX XXX XXX XXX
12-00002 Reinsurer E
XXX XXX XXX XXX XXX XXX XXX XXX XXX XXX XXX XXX XXX XXX XXX XXX
2699999 Unauthorized -Other Non - U.S Insurers
XXX XXX XXX XXX XXX XXX XXX XXX XXX XXX XXX XXX XXX XXX XXX XXX
2799999 Unauthorized -Protected Cells
XXX XXX XXX XXX XXX XXX XXX XXX XXX XXX XXX XXX XXX XXX XXX XXX
2899999 Unauthorized
XXX XXX XXX XXX XXX XXX XXX XXX XXX XXX XXX XXX XXX XXX XXX XXX
Certified
Certified - Other Non - U.S. Insurers:
CR-1234567
ABC Reinsurance LTD 3 4/9/2015 20.0 0 84 17 17.9 89.3 0 75 9 0 0 0 0 0
CR-2345678
DEF Reinsurance LTD 2 4/13/2015 10.0 0 65 7 95.4 100.0 0 65 0 4 62 3 1 4
CR-3456789
GHI Reinsurance LTD 2 6/21/2016 10.0 0 (6) (1) - 0.0 0 0 0 0 0 0 0 0
4099999 Certified - Other Non - U.S. Insurers 0 143 23 53.8 0.0 0 140 9 4 62 3 1 4
4199999 Certified - Protected Cells 0 0 0 - 0.0 0 0 0 0 0 0 0 0
4299999 Certified 0 143 23 53.8 0.0 0 140 9 4 62 3 1 4
4399999 Total Authorized, Unauthorized & Certified
XXX XXX XXX XXX XXX XXX XXX XXX XXX XXX XXX XXX XXX XXX XXX XXX
4499999 Total Protected Cell
XXX XXX XXX XXX XXX XXX XXX XXX XXX XXX XXX XXX XXX XXX XXX XXX
9999999 Totals - Schedule F, Part 3
XXX XXX XXX XXX XXX XXX XXX XXX XXX XXX XXX XXX XXX XXX XXX XXX
SCHEDULE F - PART 3
Ceded Reinsurance as of December 31, Current Year (000 Omitted)
22.4
20% of
Recoverable on
Paid Losses & LAE
Over 90 Days Past
Due Amounts in
Dispute (Col. 45 *
20%)
ID Number
From Col. 1 Name of Reinsurer From Col. 3
Provision for Certified Reinsurance
Complete if Col. 52 = "No"; Otherwise Enter 0
Certified
Reinsurer Rating
(1 through 6)
Effective Date of
Certified
Reinsurer Rating
Percent
Collateral
Required for Full
Credit (0%
through 100%)
Amount of Credit
Allowed for Net
Recoverables (Col.
57 +[Col. 58 * Col.
61])
Provision for
Reinsurance with
Certified Reinsurers
Due to Collateral
Deficiency (Col. 19 -
Col. 63)
20% of
Recoverable on
Paid Losses & LAE
Over 90 Days Past
Due Amounts Not in
Dispute (Col. 47 *
20%)
Provision for
Overdue
Reinsurance Ceded
to Certified
Reinsurers (Greater
of [Col. 62 + Col.
65] or Col.68; not to
Exceed Col. 63)
Catastrophe
Recoverables
Qualifying for
Collateral
Deferral
Net Recoverables
Subject to
Collateral
Requirements for
Full Credit (Col. 19 -
Col. 57)
Dollar Amount of
Collateral
Required (Col.
56 * Col. 58)
Percent of
Collateral Provided
for Net
Recoverables
Subject to
Collateral
Requirements ([Col.
20+Col. 21+ Col.
22+ Col.24] / Col.
58)
Percent Credit
Allowed on Net
Recoverables
Subject to
Collateral
Requirements (Col.
60 / Col. 56, not to
exceed 100%)

ANNUAL STATEMENT FOR THE YEAR December 31, 2018 OF THE Fictitious Insurance Co.
70
71 72 73 74 75 76 77 78
Authorized
Authorized - Affiliates - U.S. Intercompany Pooling:
199999 Total Authorized - Affiliates - U.S. Intercompany Pooling 0
XXX XXX
0 0 0
XXX XXX -
Authorized - Affiliates - U.S. Non-Pool:
11-111 Affiliated Non-Pool 0
XXX XXX
0 0 0
XXX XXX -
499999 Total Authorized - Affiliates - U.S. Non-Pool 0
XXX XXX
0 0 0
XXX XXX -
899999 Authorized - Affiliates 0
XXX XXX
0 0 0
XXX XXX -
Authorized - Other U.S. Unaffiliated Insurers:
31-123 Good Reinsurer 0
XXX XXX
0 0 0
XXX XXX -
43-145 Overdue Reinsurer 2
XXX XXX
0 43 43
XXX XXX 43
76-345 Slightly Overdue Reinsurer 1
XXX XXX
1 0 1
XXX XXX 1
999999 Authorized - Other U.S. Unaffiliated Insurers 3
XXX XXX
1 43 44
XXX XXX 44
Authorized - Pools - Voluntary Pools:
AA-44111 Pooling Company 0
XXX XXX
0 0 0
XXX XXX -
1199999 Authorized - Pools - Voluntary Pools 0
XXX XXX
0 0 0
XXX XXX -
Authorized - Other Non - U.S. Insurers:
AA-331234 Foreign Authorized 2
XXX XXX
0 2 2
XXX XXX 2
1299999 Authorized - Other Non - U.S. Insurers 2
XXX XXX
0 2 2
XXX XXX 2
1399999 Authorized - Protected Cells 0
XXX XXX
0 0 0
XXX XXX -
1499999 Authorized 5
XXX XXX
1 45 46
XXX XXX 46
Unauthorized
Unauthorized Affiliates:
2299999 Unauthorized - Affiliates 0 0 0
XXX XXX XXX
0
XXX -
Unauthorized - Other U.S. Unaffiliated Insurers:
13-1063 Reinsurer A 1 21 1
XXX XXX XXX
22
XXX 22
11-0002 Reinsurer B 0 75 0
XXX XXX XXX
75
XXX 75
11-0000 Reinsurer C 0 116 10
XXX XXX XXX
126
XXX 126
2399999 Unauthorized - Other U.S. Unaffiliated Insurers 1 212 11
XXX XXX XXX
223
XXX 223
Unauthorized -Other Non - U.S Insurers:
12-00001 Reinsurer D 0 0 0
XXX XXX XXX
0
XXX -
12-00002 Reinsurer E 0 1 0
XXX XXX XXX
1
XXX 1
2699999 Unauthorized -Other Non - U.S Insurers 0 1 0
XXX XXX XXX
1
XXX 1
2799999 Unauthorized -Protected Cells 0 0 0
XXX XXX XXX
0
XXX -
2899999 Unauthorized 1 213 11
XXX XXX XXX
224
XXX 224
Certified
Certified - Other Non - U.S. Insurers:
CR-1234567
ABC Reinsurance LTD 0
XXX XXX XXX XXX XXX XXX
9 9
CR-2345678
DEF Reinsurance LTD 4
XXX XXX XXX XXX XXX XXX
4 4
CR-3456789
GHI Reinsurance LTD 0
XXX XXX XXX XXX XXX XXX
0 0
4099999 Certified - Other Non - U.S. Insurers 4
XXX XXX XXX XXX XXX XXX
13 13
4199999 Certified - Protected Cells 0
XXX XXX XXX XXX XXX XXX
0 0
4299999 Certified 4
XXX XXX XXX XXX XXX XXX
13 13
4399999
Total Authorized, Unauthorized & Certified
10
213
11
1
45
46
224
13
283
4499999
Total Protected Cell
0
0
0
0
0
0
0
0
0
9999999
Totals - Schedule F, Part 3
10
213
11
1
45
46
224
13
283
SCHEDULE F - PART 3
Ceded Reinsurance as of December 31, Current Year (000 Omitted)
22.5
ID Number
From Col. 1 Name of Reinsurer From Col. 3
Provision for Unauthorized Reinsurance Provision for Overdue Authorized Reinsurance Total Provision for Reinsurance
20% of Recoverable on
Paid Losses & LAE
Over 90 Days Past Due
Amounts Not in Dispute
(Col. 47 * 20%)
Provision for Amounts
Ceded to Certified
Reinsurers (Cols. 64 +
69)
Total Provision for
Reinsurance (Cols. 75 +
76 +77)
Provision for
Reinsurance with
Unauthorized Reinsurers
Due to Collateral
Deficiency (Col. 26)
Provision for Overdue
Reinsurance from
Unauthorized Reinsurers
and Amounts in Dispute
(Col. 70 + 20% of the
Amount in Col. 16)
Complete if Col. 52 =
"Yes"; Otherwise Enter 0
20% of Recoverable on
Paid Losses & LAE
Over 90 Days Past Due
Amounts Not in Dispute
+ 20% of Amounts in
Dispute ([Col. 47 * 20%]
+ [Col. 45 * 20%])
Complete if Col. 52 =
"No"; Otherwise Enter 0
Greater of 20% of Net
Recoverable Net of
Funds Held & Collateral,
or 20% of Recoverable
on Paid Losses & LAE
Over 90 Days Past Due
(Greater of Col 26 * 20%
or [Cols. 40 + 41] * 20%)
Provision for Amounts
Ceded to Authorized
Reinsurers (Cols. 73 +
74)
Provision for Amounts
Ceded to Unauthorized
Reinsurers (Cols. 71 +
72 Not in Excess of Col.
15)

12
1 2 3 10 11
4 5 6 7 8 9
Direct
and
Assumed
Ceded
Net
(Cols. 1 - 2)
Direct
and
Assumed Ceded
Direct
and
Assumed Ceded
Direct
and
Assumed Ceded
Salvage and
Subrogation
Received
Total Net
Paid
(Cols. 4 - 5
+ 6 - 7 + 8 -
Number of
Claims Reported
- Direct and
Assumed
1. Prior................ …..XXX....... …..XXX....... …..XXX....... 1,265......... 581............ 442............ 23.............. 198............ 2................ 42............... 1,299.......... …..XXX...............
2. 2009............... 27,202....... 5,678......... 21,524....... 14,055....... 3,356......... 1,745......... 242............ 827............ 84.............. 547............. 12,945........ …..XXX...............
3. 2010............... 29,689....... 6,266......... 23,422....... 13,058....... 2,121......... 1,490......... 189............ 837............ 79.............. 559............. 12,996........ …..XXX...............
4. 2011............... 29,397....... 5,032......... 24,364....... 11,877....... 2,011......... 1,220......... 153............ 912............ 84.............. 563............. 11,761........ …..XXX...............
5. 2012............... 28,326....... 4,049......... 24,276....... 13,535....... 3,577......... 1,120......... 158............ 936............ 61.............. 512............. 11,795........ …..XXX...............
6. 2013............... 27,863....... 3,423......... 24,440....... 10,182....... 1,252......... 965............ 91.............. 1,046......... 31.............. 523............. 10,819........ …..XXX...............
7. 2014............... 28,334....... 2,957......... 25,377....... 10,595....... 997............ 976............ 71.............. 1,127......... 25.............. 603............. 11,605........ …..XXX...............
8. 2015............... 28,461....... 2,945......... 25,515....... 12,605....... 1,320......... 909............ 64.............. 1,308......... 19.............. 592............. 13,419........ …..XXX...............
9. 2016............... 27,970....... 2,352......... 25,618....... 10,418....... 712............ 662............ 35.............. 1,258......... 13.............. 495............. 11,578........ …..XXX...............
10. 2017............... 27,678....... 2,143......... 25,535....... 9,834......... 525............ 490............ 25.............. 1,257......... 11.............. 499............. 11,020........ …..XXX...............
11. 2018............... 28,598....... 2,085......... 26,512....... 8,853......... 423............ 247............ 16.............. 1,124......... 8................ 348............. 9,777.......... …..XXX...............
12. Totals.............. …..XXX....... …..XXX....... …..XXX....... 116,277..... 16,875....... 10,266....... 1,067......... 10,830....... 417............ 5,283.......... 119,014...... …..XXX...............
23 24 25
13 14 15 16 17 18 19 20 21 22
Direct
and
Assumed
Ceded
Direct
and
Assumed
Ceded
Direct
and
Assumed
Ceded
Direct
and
Assumed
Ceded
Direct
and
Assumed
Ceded
Salvage and
Subrogation
Anticipated
Total Net Losses
and Expenses
Unpaid
Number of Claims
Outstanding - Direct
and Assumed
1. Prior................ 9,567......... 2,968......... 7,719......... 1,416......... 908............ 165............ 1,545......... 138............ 1,024......... 3................. 23............... 16,073............... …..XXX....................
2. 2009............... 665............ 219............ 645............ 139............ 57.............. 9................ 168............ 35.............. 43.............. 0................. 4................. 1,176................. …..XXX....................
3. 2010............... 617............ 110............ 779............ 235............ 70.............. 12.............. 160............ 29.............. 129............ 1................. 36............... 1,368................. …..XXX....................
4. 2011............... 601............ 162............ 686............ 200............ 61.............. 5................ 159............ 30.............. 47.............. 0................. 19............... 1,157................. …..XXX....................
5. 2012............... 664............ 208............ 956............ 271............ 65.............. 9................ 175............ 28.............. 46.............. 0................. 29............... 1,390................. …..XXX....................
6. 2013............... 834............ 176............ 1,141......... 249............ 92.............. 5................ 193............ 23.............. 65.............. 0................. 38............... 1,872................. …..XXX....................
7. 2014............... 924............ 128............ 1,427......... 290............ 135............ 7................ 298............ 25.............. 70.............. 0................. 72............... 2,404................. …..XXX....................
8. 2015............... 1,619......... 165............ 1,690......... 288............ 195............ 9................ 456............ 48.............. 135............ 0................. 144............. 3,585................. …..XXX....................
9. 2016............... 2,028......... 363............ 2,255......... 282............ 240............ 10.............. 539............ 50.............. 160............ 0................. 175............. 4,517................. …..XXX....................
10. 2017............... 2,827......... 219............ 3,224......... 287............ 283............ 12.............. 739............ 47.............. 231............ 0................. 269............. 6,739................. …..XXX....................
11. 2018............... 4,599......... 625............ 5,808......... 381............ 318............ 15.............. 969............ 46.............. 649............ 0................. 554............. 11,276............... …..XXX....................
12. Totals.............. 24,945....... 5,343......... 26,330....... 4,038......... 2,424......... 258............ 5,401......... 499............ 2,599......... 4................. 1,363.......... 51,557............... …..XXX....................
34
26
27
28
29
30
31
32
33
Inter-
35
36
Direct Direct Pooling Loss
and
Assumed
and
Assumed
Participation
Percentage
Losses
Unpaid
Expenses
Unpaid
1. Prior................ …..XXX....... …..XXX....... …..XXX....... …..XXX....... …..XXX....... …..XXX....... 0................ 0................ ….....XXX.... 12,902........ 3,171..........
2. 2009............... 18,205....... 4,084......... 14,121....... 66.9........... 71.9........... 65.6........... 0................ 0................ ….....XXX.... 952............. 224.............
3. 2010............... 17,140....... 2,776......... 14,364....... 57.7........... 44.3........... 61.3........... 0................ 0................ ….....XXX.... 1,051.......... 317.............
4. 2011............... 15,563....... 2,645......... 12,918....... 52.9........... 52.6........... 53.0........... 0................ 0................ ….....XXX.... 925............. 232.............
5. 2012............... 17,497....... 4,312......... 13,185....... 61.8........... 106.5......... 54.3........... 0................ 0................ ….....XXX.... 1,141.......... 249.............
6. 2013............... 14,518....... 1,827......... 12,691....... 52.1........... 53.4........... 51.9........... 0................ 0................ ….....XXX.... 1,550.......... 322.............
7. 2014............... 15,552....... 1,543......... 14,009....... 54.9........... 52.2........... 55.2........... 0................ 0................ ….....XXX.... 1,933.......... 471.............
8. 2015............... 18,917....... 1,913......... 17,004....... 66.5........... 65.0........... 66.6........... 0................ 0................ ….....XXX.... 2,856.......... 729.............
9. 2016............... 17,560....... 1,465......... 16,095....... 62.8........... 62.3........... 62.8........... 0................ 0................ ….....XXX.... 3,638.......... 879.............
10. 2017............... 18,885....... 1,126......... 17,759....... 68.2........... 52.5........... 69.5........... 0................ 0................ ….....XXX.... 5,545.......... 1,194..........
11. 2018............... 22,567....... 1,514......... 21,053....... 78.9........... 72.6........... 79.4........... 0................ 0................ ….....XXX.... 9,401.......... 1,875..........
12. Totals.............. …..XXX....... …..XXX....... …..XXX....... …..XXX....... …..XXX....... …..XXX....... …..XXX....... …..XXX....... ….....XXX.... 41,894........ 9,663..........
Total Losses and
Ceded
Net
(Cols. 26 -
27)
Loss and Loss Expense Percentage
33
Loss Expenses Incurred
Loss
Expense
(Incurred /Premiums Earned)
Ceded Net Loss
Were
Earned and Losses
Were Incurred
SCHEDULE P - ANALYSIS OF LOSSES AND LOSS EXPENSES
SCHEDULE P - PART 1 - SUMMARY
($000 Omitted)
Premiums Earned
Loss Payments
Defense and Cost
Containment Payments
Adjusting and Other
Payments
Years in Which
Premiums
Loss and Loss Expense Payments
Losses Unpaid
Case Basis Bulk + IBNR Case Basis
Defense and Cost Containment Unpaid
Unpaid
Adjusting and Other
Bulk + IBNR
Net Balance Sheet
Reserves after Discount
Nontabular
Discount

1 2 3 4 5 6 7 8 9 10 11 12
2009 2010 2011 2012 2013 2014 2015 2016 2017 2018 One Year Two Year
1. Prior......... 35,994........ 38,360........ 41,784........ 43,601........ 44,861........ 45,378........ 45,947........ 45,884........ 45,845........ 46,022........ 177............. 138.............
2. 2009......... 14,249........ 13,109........ 13,545........ 13,763........ 13,842........ 13,778........ 13,722........ 13,657........ 13,408........ 13,387........ (21)............. (270)...........
3. 2010......... …..XXX....... 14,434........ 13,651........ 14,040........ 13,994........ 14,032........ 14,042........ 13,748........ 13,617........ 13,540........ (77)............. (208)...........
4. 2011......... …..XXX....... …..XXX....... 15,733........ 14,265........ 13,630........ 13,209........ 12,726........ 12,485........ 12,288........ 12,099........ (189)........... (386)...........
5. 2012......... …..XXX....... …..XXX....... …..XXX....... 15,982........ 14,733........ 14,195........ 13,210........ 12,768........ 12,445........ 12,321........ (124)........... (447)...........
6. 2013......... …..XXX....... …..XXX....... …..XXX....... …..XXX....... 13,501........ 13,051........ 12,370........ 12,056........ 11,837........ 11,679........ (158)........... (377)...........
7. 2014......... …..XXX....... …..XXX....... …..XXX....... …..XXX....... …..XXX....... 13,938........ 13,629........ 13,303........ 13,265........ 12,895........ (370)........... (408)...........
8. 2015......... …..XXX....... …..XXX....... …..XXX....... …..XXX....... …..XXX....... …..XXX....... 15,980........ 16,106........ 16,015........ 15,635........ (380)........... (471)...........
9. 2016......... …..XXX....... …..XXX....... …..XXX....... …..XXX....... …..XXX....... …..XXX....... …..XXX....... 14,917........ 14,851........ 14,745........ (106)........... (172)...........
10. 2017......... …..XXX....... …..XXX....... …..XXX....... …..XXX....... …..XXX....... …..XXX....... …..XXX....... …..XXX....... 15,972........ 16,345........ 373............. …..XXX.......
11. 2018......... …..XXX....... …..XXX....... …..XXX....... …..XXX....... …..XXX....... …..XXX....... …..XXX....... …..XXX....... …..XXX....... 19,364........ …..XXX....... …..XXX.......
12. Totals.... (875)........... (2,601).........
11 12
1 2 3 4 5 6 7 8 9 10 Number of
2009 2010 2011 2012 2013 2014 2015 2016 2017 2018
Number of
Claims
Closed with
Loss
Payment
Claims
Closed
Without
Loss
Payment
1. Prior......... 0................. 9,061.......... 13,830........ 18,110........ 21,281........ 23,728........ 26,341........ 27,752........ 29,108........ 30,210........ …..XXX....... …..XXX.......
2. 2009......... 3,881.......... 6,637.......... 8,297.......... 9,620.......... 10,627........ 11,289........ 11,686........ 11,961........ 12,108........ 12,202........ …..XXX....... …..XXX.......
3. 2010......... …..XXX....... 4,121.......... 7,109.......... 9,011.......... 10,142........ 11,035........ 11,552........ 11,847........ 12,070........ 12,238........ …..XXX....... …..XXX.......
4. 2011......... …..XXX....... …..XXX....... 4,061.......... 6,981.......... 8,385.......... 9,439.......... 10,067........ 10,485........ 10,772........ 10,933........ …..XXX....... …..XXX.......
5. 2012......... …..XXX....... …..XXX....... …..XXX....... 4,376.......... 7,649.......... 8,904.......... 9,766.......... 10,329........ 10,724........ 10,919........ …..XXX....... …..XXX.......
6. 2013......... …..XXX....... …..XXX....... …..XXX....... …..XXX....... 4,208.......... 6,630.......... 7,898.......... 8,803.......... 9,481.......... 9,804.......... …..XXX....... …..XXX.......
7. 2014......... …..XXX....... …..XXX....... …..XXX....... …..XXX....... …..XXX....... 4,591.......... 7,325.......... 8,821.......... 9,846.......... 10,503........ …..XXX....... …..XXX.......
8. 2015......... …..XXX....... …..XXX....... …..XXX....... …..XXX....... …..XXX....... …..XXX....... 6,026.......... 9,265.......... 10,971........ 12,130........ …..XXX....... …..XXX.......
9. 2016......... …..XXX....... …..XXX....... …..XXX....... …..XXX....... …..XXX....... …..XXX....... …..XXX....... 5,626.......... 8,740.......... 10,332........ …..XXX....... …..XXX.......
10. 2017......... …..XXX....... …..XXX....... …..XXX....... …..XXX....... …..XXX....... …..XXX....... …..XXX....... …..XXX....... 6,278.......... 9,774.......... …..XXX....... …..XXX.......
11. 2018......... …..XXX....... …..XXX....... …..XXX....... …..XXX....... …..XXX....... …..XXX....... …..XXX....... …..XXX....... …..XXX....... 8,660.......... …..XXX....... …..XXX.......
1 2 3 4 5 6 7 8 9 10
2009 2010 2011 2012 2013 2014 2015 2016 2017 2018
1. Prior......... 17,126........ 14,330........ 13,764........ 12,807........ 12,285........ 11,632........ 10,529........ 9,752.......... 8,907.......... 8,088..........
2. 2009......... 7,093.......... 3,349.......... 2,393.......... 1,821.......... 1,445.......... 1,249.......... 1,121.......... 1,010.......... 728............. 677.............
3. 2010......... …..XXX....... 7,149.......... 3,583.......... 2,544.......... 1,799.......... 1,479.......... 1,370.......... 1,016.......... 814............. 713.............
4. 2011......... …..XXX....... …..XXX....... 8,512.......... 4,667.......... 3,068.......... 2,149.......... 1,505.......... 1,122.......... 864............. 651.............
5. 2012......... …..XXX....... …..XXX....... …..XXX....... 7,337.......... 4,644.......... 3,505.......... 2,131.......... 1,522.......... 1,030.......... 876.............
6. 2013......... …..XXX....... …..XXX....... …..XXX....... …..XXX....... 6,333.......... 4,175.......... 2,757.......... 1,959.......... 1,440.......... 1,114..........
7. 2014......... …..XXX....... …..XXX....... …..XXX....... …..XXX....... …..XXX....... 6,022.......... 3,756.......... 2,640.......... 2,018.......... 1,459..........
8. 2015......... …..XXX....... …..XXX....... …..XXX....... …..XXX....... …..XXX....... …..XXX....... 6,400.......... 3,932.......... 2,810.......... 1,850..........
9. 2016......... …..XXX....... …..XXX....... …..XXX....... …..XXX....... …..XXX....... …..XXX....... …..XXX....... 6,008.......... 3,544.......... 2,511..........
10. 2017......... …..XXX....... …..XXX....... …..XXX....... …..XXX....... …..XXX....... …..XXX....... …..XXX....... …..XXX....... 5,817.......... 3,682..........
11. 2018......... …..XXX....... …..XXX....... …..XXX....... …..XXX....... …..XXX....... …..XXX....... …..XXX....... …..XXX....... …..XXX....... 6,422..........
Years in
Which
Losses Were
Incurred
ANNUAL STATEMENT FOR THE YEAR 2018 OF THE FICTITIOUS INSURANCE COMPANY
SCHEDULE P -PART 2 - SUMMARY
Incurred Net Losses and Defense and Cost containment Expenses Reported at Year End ( $000 omitted) DEVELOPMENT
SCHEDULE P -PART 3 - SUMMARY
Cummulative Paid Net Losses and Defense and Cost Containment Expenses Reported at Year End ($000 omitted)
Years in
Which
Losses Were
Incurred
SCHEDULE P -PART 4 - SUMMARY
34
Bulk and IBNR Reserves on Net Losses and Defense Cost Containment Expenses Reported at Year End ('000 omitted)
Years in
Which
Losses Were
Incurred

12
1 2 3 10 11
Number
of
4 5 6 7 8 9 Salvage Total Claims
Direct
and
Assumed
Ceded
Net
(Cols. 1 - 2)
Direct
and
Assumed Ceded
Direct
and
Assumed
Ceded
Direct
and
Assumed
Ceded
and
Subrogation
Received
Net Paid
(Cols. 4 - 5 +
6 - 7 + 8 - 9)
Reported -
Direct and
Assumed
1.
Prior........... …..XXX...... …..XXX...... …..XXX............. 2..................... 0..................... 0..................... 0................ 0................ 0...................... 0................... 2.................... …..XXX.............
2.
2009........... 1,931......... 168............ 1,763............... 983................. 75................... 38................... 4................ 97.............. 4...................... 18................. 1,035............. 242..................
3.
2010........... 2,251......... 167............ 2,084............... 1,129.............. 59................... 40................... 4................ 114............ 0...................... 20................. 1,220............. 253..................
4.
2011........... 2,721......... 109............ 2,612............... 1,375.............. 65................... 73................... 4................ 130............ 0...................... 21................. 1,509............. 219..................
5.
2012........... 3,123......... 123............ 3,000............... 1,585.............. 272................. 56................... 1................ 162............ 0...................... 26................. 1,530............. 217..................
6.
2013........... 3,307......... 76.............. 3,231............... 1,302.............. 1..................... 40................... 0................ 193............ 0...................... 36................. 1,534............. 216..................
7.
2014........... 3,609......... 102............ 3,507............... 1,343.............. 2..................... 46................... 0................ 212............ 0...................... 63................. 1,599............. 194..................
8.
2015........... 3,816......... 103............ 3,713............... 2,093.............. 1..................... 53................... 0................ 268............ 0...................... 39................. 2,413............. 300..................
9.
2016........... 4,003......... 108............ 3,895............... 2,099.............. 6..................... 54................... 0................ 257............ 0...................... 37................. 2,404............. 296..................
10.
2017........... 4,294......... 116............ 4,178............... 2,249.............. 2..................... 48................... 0................ 294............ 0...................... 27................. 2,589............. 325..................
11.
2018........... 4,550......... 105............ 4,445............... 2,968.............. 3..................... 38................... 0................ 343............ 0...................... 10................. 3,346............. 427..................
12.
Totals......... …..XXX...... …..XXX...... …..XXX............. 17,128............ 486................. 486................. 13.............. 2,073......... 4...................... 297............... 19,184.......... …..XXX.............
23 24 25
Total
13 14 15 16 17 18 19 20 21 22 Net Number of
Direct
and
Assumed
Ceded
Direct
and
Assumed
Ceded
Direct
and
Assumed
Ceded
Direct
and
Assumed
Ceded
Direct
and
Assumed
Ceded
Salvage
and
Subrogation
Anticipated
Losses
and Expenses
Unpaid
Claims
Outstanding
Direct and
Assumed
1.
Prior........... 4................ 0................ 0...................... 0..................... 0..................... 0..................... 0................ 0................ 3...................... 0................... 0.................... 7...................... 1......................
2.
2009........... 0................ 0................ 0...................... 0..................... 0..................... 0..................... 0................ 0................ 3...................... 0................... 0.................... 3...................... 1......................
3.
2010........... 1................ 0................ 0...................... 0..................... 0..................... 0..................... 0................ 0................ 3...................... 0................... 0.................... 4...................... 1......................
4.
2011........... 2................ 0................ 0...................... 0..................... 0..................... 0..................... 0................ 0................ 3...................... 0................... 0.................... 5...................... 1......................
5.
2012........... 3................ 3................ 58.................... 13................... 0..................... 0..................... 0................ 0................ 3...................... 0................... 1.................... 48.................... 1......................
6.
2013........... 8................ 0................ 0...................... 1..................... 0..................... 0..................... 0................ 0................ 3...................... 0................... 2.................... 10.................... 1......................
7.
2014........... 16.............. 0................ 0...................... 0..................... 2..................... 0..................... 0................ 0................ 3...................... 0................... 4.................... 21.................... 1......................
8.
2015........... 37.............. 0................ 13.................... 1..................... 3..................... 0..................... 3................ 0................ 2...................... 0................... 8.................... 57.................... 1......................
9.
2016........... 55.............. 0................ 7...................... (3).................... 6..................... 0..................... 7................ 0................ 4...................... 0................... 13.................. 82.................... 1......................
10.
2017........... 115............ 0................ 69.................... 0..................... 9..................... 0..................... 8................ 0................ 9...................... 0................... 28.................. 210.................. 3......................
11.
2018........... 351............ 0................ 587.................. 0..................... 15................... 0..................... 4................ 0................ 56.................... 0................... 66.................. 1,013............... 21....................
12.
Totals......... 592............ 3................ 734.................. 12................... 35................... 0..................... 22.............. 0................ 89.................... 0................... 122................ 1,457............... 33....................
34
26 27 28 29 30 31 32 33
Inter-Company
35 36
Direct Direct Pooling Loss
and
Assumed
Ceded
Net
(Cols. 26 - 27)
and
Assumed
Ceded
Net Loss
Loss
Expense
Participation
Percentage
Losses
Unpaid
Expenses
Unpaid
1.
Prior........... …..XXX...... …..XXX...... …..XXX............. …..XXX............ …..XXX............ …..XXX............ 0................ 0................ ….....XXX......... 4................... 3....................
2.
2009........... 1,121......... 83.............. 1,038............... 58.1................ 49.4................ 58.9................ 0................ 0................ ….....XXX......... 0................... 3....................
3.
2010........... 1,287......... 63.............. 1,224............... 57.2................ 37.7................ 58.7................ 0................ 0................ ….....XXX......... 1................... 3....................
4.
2011........... 1,583......... 69.............. 1,514............... 58.2................ 63.3................ 58.0................ 0................ 0................ ….....XXX......... 2................... 3....................
5.
2012........... 1,867......... 289............ 1,578............... 59.8................ 235.0.............. 52.6................ 0................ 0................ ….....XXX......... 45................. 3....................
6.
2013........... 1,546......... 2................ 1,544............... 46.7................ 2.6.................. 47.8................ 0................ 0................ ….....XXX......... 7................... 3....................
7.
2014........... 1,622......... 2................ 1,620............... 44.9................ 2.0.................. 46.2................ 0................ 0................ ….....XXX......... 16................. 5....................
8.
2015........... 2,472......... 2................ 2,470............... 64.8................ 1.9.................. 66.5................ 0................ 0................ ….....XXX......... 49................. 8....................
9.
2016........... 2,489......... 3................ 2,486............... 62.2................ 2.8.................. 63.8................ 0................ 0................ ….....XXX......... 65................. 17..................
10.
2017........... 2,801......... 2................ 2,799............... 65.2................ 1.7.................. 67.0................ 0................ 0................ ….....XXX......... 184............... 26..................
11.
2018........... 4,362......... 3................ 4,359............... 95.9................ 2.9.................. 98.1................ 0................ 0................ ….....XXX......... 938............... 75..................
12.
Totals......... …..XXX...... …..XXX...... …..XXX............. …..XXX............ …..XXX............ …..XXX............ …..XXX...... …..XXX...... ….....XXX......... 1,311............ 146................
Years in Which
Premiums
Loss Payments
Defense and Cost
Containment Payments
Adjusting and Other
Payments
ANNUAL STATEMENT FOR THE YEAR 2018 OF THE FICTITIOUS INSURANCE COMPANY
SCHEDULE P - ANALYSIS OF LOSSES AND LOSS EXPENSES
SCHEDULE P - PART 1A - HOMEOWNERS/FARMOWNERS
($000 Omitted)
Premiums Earned Loss and Loss Expense Payments
Were
Earned and
Losses Were
Incurred
Losses Unpaid Defense and Cost Containment Unpaid Adjusting and Other
Unpaid
Total Losses and Loss and Loss Expense Percentage Nontabular
Case Basis Bulk + IBNR Case Basis Bulk + IBNR
35
Net Balance Sheet
Reserves after DiscountLoss Expenses Incurred (Incurred /Premiums Earned) Discount

12
1 2 3 10 11
Number
of
4 5 6 7 8 9 Salvage Total Claims
Direct
and
Assumed
Ceded
Net
(Cols. 1 - 2)
Direct
and
Assumed Ceded
Direct
and
Assumed Ceded
Direct
and
Assumed Ceded
and
Subrogation
Received
Net Paid
(Cols. 4 - 5 +
6 - 7 + 8 - 9)
Reported -
Direct and
Assumed
1. Prior........... …..XXX...... …..XXX...... …..XXX............... 17............. 6............... 3............... 0............... 15............. 0........................ (1)................ 29................. …..XXX.........
2. 2009........... 2,906........ 545........... 2,361................. 1,607........ 318........... 149........... 39............. 105........... 6........................ 20................ 1,498............ 219..............
3. 2010........... 3,128........ 507........... 2,620................. 1,555........ 254........... 141........... 29............. 99............. 4........................ 15................ 1,509............ 195..............
4. 2011........... 2,879........ 489........... 2,389................. 1,363........ 227........... 125........... 26............. 106........... 4........................ 15................ 1,336............ 177..............
5. 2012........... 2,904........ 388........... 2,515................. 1,175........ 152........... 120........... 24............. 104........... 3........................ 12................ 1,220............ 155..............
6. 2013........... 2,592........ 271........... 2,321................. 1,094........ 138........... 103........... 21............. 104........... 3........................ 16................ 1,140............ 143..............
7. 2014........... 2,476........ 150........... 2,326................. 1,134........ 102........... 110........... 18............. 116........... 2........................ 14................ 1,238............ 139..............
8. 2015........... 2,387........ 173........... 2,213................. 1,001........ 83............. 91............. 12............. 138........... 1........................ 12................ 1,133............ 149..............
9. 2016........... 2,374........ 142........... 2,232................. 794........... 39............. 55............. 5............... 107........... 1........................ 12................ 911............... 128..............
10. 2017........... 2,302........ 113........... 2,190................. 608........... 25............. 28............. 2............... 103........... 1........................ 12................ 711............... 132..............
11. 2018........... 2,305........ 83............. 2,222................. 307........... 8............... 7............... 1............... 73............. 1........................ 7.................. 378............... 134..............
12. Totals......... …..XXX...... …..XXX...... …..XXX............... 10,654...... 1,349........ 932........... 177........... 1,069........ 27...................... 134.............. 11,103.......... …..XXX.........
23 24 25
Total
13 14 15 16 17 18 19 20 21 22 Net Number of
Direct
and
Assumed
Ceded
Direct
and
Assumed
Ceded
Direct
and
Assumed
Ceded
Direct
and
Assumed
Ceded
Direct
and
Assumed
Ceded
Salvage
and
Subrogation
Anticipated
Losses
and
Expenses
Unpaid
Claims
Outstanding
Direct and
Assumed
1. Prior........... 186........... 136........... 71...................... 21............. 4............... 1............... 11............. 1............... 2........................ 0.................. 0................... 115.............. 1....................
2. 2009........... 7............... 2............... 18...................... 2............... 1............... 0............... 5............... 1............... 2........................ 0.................. 0................... 28................ 1....................
3. 2010........... 13............. 4............... 25...................... 5............... 4............... 2............... 4............... (1).............. 2........................ 0.................. 0................... 38................ 1....................
4. 2011........... 14............. 2............... 39...................... 14............. 2............... 0............... 5............... 1............... 2........................ 0.................. 0................... 45................ 1....................
5. 2012........... 90............. 27............. 45...................... 15............. 5............... (0).............. 17............. 4............... 2........................ 0.................. 0................... 114.............. 1....................
6. 2013........... 48............. 4............... 56...................... 7............... 7............... 1............... 8............... 0............... 2........................ 0.................. 0................... 109.............. 1....................
7. 2014........... 103........... 9............... 60...................... 15............. 12............. 2............... 6............... 1............... 4........................ 0.................. 1................... 158.............. 2....................
8. 2015........... 208........... 12............. 78...................... 25............. 22............. 2............... 9............... 1............... 8........................ 0.................. 1................... 284.............. 4....................
9. 2016........... 325........... 27............. 156.................... 10............. 31............. 2............... 22............. 3............... 15...................... 0.................. 2................... 506.............. 7....................
10. 2017........... 498........... 45............. 268.................... 18............. 37............. 3............... 41............. 2............... 27...................... 0.................. 4................... 804.............. 13..................
11. 2018........... 529........... 18............. 573.................... 17............. 35............. 2............... 62............. 1............... 89...................... 0.................. 8................... 1,250........... 42..................
12. Totals......... 2,020........ 285........... 1,389................. 150........... 159........... 15............. 190........... 13............. 156.................... 1.................. 18................. 3,451........... 74..................
34
26 27 28 29 30 31 32 33
Inter-Company
35 36
Direct Direct Pooling Loss
and
Assumed
Ceded
Net
(Cols. 26 - 27)
and
Assumed
Ceded
Net Loss
Loss
Expense
Participation
Percentage
Losses
Unpaid
Expenses
Unpaid
1. Prior........... …..XXX….. …..XXX….. …..XXX….. …..XXX….. …..XXX….. …..XXX….. 0............... 0............... ….....XXX............ 100.............. 15.................
2. 2009........... 1,894........ 368........... 1,526................. 65.2.......... 67.4.......... 64.6.......... 0............... 0............... ….....XXX............ 20................ 8...................
3. 2010........... 1,844........ 297........... 1,547................. 59.0.......... 58.5.......... 59.0.......... 0............... 0............... ….....XXX............ 29................ 9...................
4. 2011........... 1,654........ 274........... 1,381................. 57.5.......... 56.0.......... 57.8.......... 0............... 0............... ….....XXX............ 36................ 9...................
5. 2012........... 1,558........ 224........... 1,334................. 53.7.......... 57.8.......... 53.0.......... 0............... 0............... ….....XXX............ 94................ 20.................
6. 2013........... 1,422........ 173........... 1,249................. 54.9.......... 63.9.......... 53.8.......... 0............... 0............... ….....XXX............ 93................ 16.................
7. 2014........... 1,545........ 148........... 1,397................. 62.4.......... 98.6.......... 60.1.......... 0............... 0............... ….....XXX............ 139.............. 19.................
8. 2015........... 1,554........ 137........... 1,417................. 65.1.......... 78.9.......... 64.0.......... 0............... 0............... ….....XXX............ 249.............. 35.................
9. 2016........... 1,504........ 88............. 1,416................. 63.4.......... 61.8.......... 63.5.......... 0............... 0............... ….....XXX............ 443.............. 62.................
10. 2017........... 1,610........ 95............. 1,515................. 69.9.......... 84.4.......... 69.2.......... 0............... 0............... ….....XXX............ 704.............. 100...............
11. 2018........... 1,675........ 47............. 1,628................. 72.7.......... 57.1.......... 73.3.......... 0............... 0............... ….....XXX............ 1,068........... 182...............
12. Totals......... …..XXX...... …..XXX...... …..XXX............... …..XXX...... …..XXX...... …..XXX...... …..XXX...... …..XXX...... ….....XXX............ 2,975........... 476...............
Unpaid
Total Losses and Loss and Loss Expense Percentage Nontabular
Case Basis Bulk + IBNR Case Basis Bulk + IBNR
Earned and
Losses were
Incurred
Losses Unpaid Defense and Cost Containment Unpaid
Loss Expenses Incurred (Incurred /Premiums Earned) Discount
37
Net Balance Sheet
Reserves after Discount
ANNUAL STATEMENT FOR THE YEAR 2018 OF THE FICTITIOUS INSURANCE COMPANY
SCHEDULE P - ANALYSIS OF LOSSES AND LOSS EXPENSES
SCHEDULE P - PART 1C-COMMERCIAL AUTO
($000 Omitted)
Premiums Earned
Adjusting and Other
Years in Which
Premiums
Loss Payments
Defense and Cost
Containment Payments
Adjusting and Other
Payments
Loss and Loss Expense Payments
Were

1 2 3 4 5 6 7 8 9 10 11 12
2009 2010 2011 2012 2013 2014 2015 2016 2017 2018 One Year Two Year
1.
Prior......... 316............. 260............. 238............. 227............. 215............. 205............. 204............. 207............. 206............. 206............. 0................. (1)...............
2.
2009......... 1,152.......... 980............. 948............. 948............. 947............. 945............. 945............. 943............. 943............. 942............. (1)............... (1)...............
3.
2010......... …..XXX....... 1,349.......... 1,126.......... 1,138.......... 1,116.......... 1,113.......... 1,110.......... 1,109.......... 1,108.......... 1,107.......... (1)............... (2)...............
4.
2011......... …..XXX....... …..XXX....... 1,362.......... 1,387.......... 1,386.......... 1,379.......... 1,382.......... 1,377.......... 1,378.......... 1,381.......... 3................. 4.................
5.
2012......... …..XXX....... …..XXX....... …..XXX....... 1,850.......... 1,596.......... 1,608.......... 1,519.......... 1,418.......... 1,405.......... 1,413.......... 8................. (5)...............
6.
2013......... …..XXX....... …..XXX....... …..XXX....... …..XXX....... 1,369.......... 1,355.......... 1,342.......... 1,352.......... 1,354.......... 1,348.......... (6)............... (4)...............
7.
2014......... …..XXX....... …..XXX....... …..XXX....... …..XXX....... …..XXX....... 1,493.......... 1,471.......... 1,401.......... 1,406.......... 1,405.......... (1)............... 4.................
8.
2015......... …..XXX....... …..XXX....... …..XXX....... …..XXX....... …..XXX....... …..XXX....... 2,236.......... 2,234.......... 2,210.......... 2,200.......... (10)............. (34).............
9.
2016......... …..XXX....... …..XXX....... …..XXX....... …..XXX....... …..XXX....... …..XXX....... …..XXX....... 2,179.......... 2,239.......... 2,225.......... (14)............. 46...............
10.
2017......... …..XXX....... …..XXX....... …..XXX....... …..XXX....... …..XXX....... …..XXX....... …..XXX....... …..XXX....... 2,577.......... 2,496.......... (81)............. …..XXX.......
11.
2018......... …..XXX....... …..XXX....... …..XXX....... …..XXX....... …..XXX....... …..XXX....... …..XXX....... …..XXX....... …..XXX....... 3,960.......... …..XXX....... …..XXX.......
12. Totals (103)........... 7.................
1 2 3 4 5 6 7 8 9 10 11 12
2009 2010 2011 2012 2013 2014 2015 2016 2017 2018 One Year Two Year
1. Prior......... 1,852.......... 2,032.......... 1,994.......... 2,069.......... 2,041.......... 1,962.......... 1,968.......... 1,966.......... 1,957.......... 1,980.......... 23............... 14...............
2. 2009......... 1,551.......... 1,502.......... 1,527.......... 1,519.......... 1,514.......... 1,478.......... 1,467.......... 1,461.......... 1,426.......... 1,425.......... (1)............... (36).............
3. 2010......... …..XXX....... 1,672.......... 1,636.......... 1,594.......... 1,566.......... 1,535.......... 1,499.......... 1,483.......... 1,451.......... 1,449.......... (2)............... (34).............
4. 2011......... …..XXX....... …..XXX....... 1,649.......... 1,483.......... 1,393.......... 1,349.......... 1,325.......... 1,317.......... 1,292.......... 1,277.......... (15)............. (40).............
5. 2012......... …..XXX....... …..XXX....... …..XXX....... 1,462.......... 1,383.......... 1,314.......... 1,265.......... 1,267.......... 1,255.......... 1,230.......... (25)............. (37).............
6. 2013......... …..XXX....... …..XXX....... …..XXX....... …..XXX....... 1,331.......... 1,273.......... 1,208.......... 1,171.......... 1,163.......... 1,146.......... (17)............. (25).............
7. 2014......... …..XXX....... …..XXX....... …..XXX....... …..XXX....... …..XXX....... 1,403.......... 1,353.......... 1,235.......... 1,299.......... 1,279.......... (20)............. 44...............
8. 2015......... …..XXX....... …..XXX....... …..XXX....... …..XXX....... …..XXX....... …..XXX....... 1,368.......... 1,177.......... 1,264.......... 1,273.......... 9................. 96...............
9. 2016......... …..XXX....... …..XXX....... …..XXX....... …..XXX....... …..XXX....... …..XXX....... …..XXX....... 1,318.......... 1,240.......... 1,296.......... 56............... (22).............
10. 2017......... …..XXX....... …..XXX....... …..XXX....... …..XXX....... …..XXX....... …..XXX....... …..XXX....... …..XXX....... 1,294.......... 1,387.......... 93............... …..XXX.......
11. 2018......... …..XXX....... …..XXX....... …..XXX....... …..XXX....... …..XXX....... …..XXX....... …..XXX....... …..XXX....... …..XXX....... 1,467.......... …..XXX....... …..XXX.......
12. Totals 101............. (40).............
57
SCHEDULE P -PART 2C-COMMERCIAL AUTO/TRUCK LIABILITY/MEDICAL
Incurred Net Losses and Defense and Cost containment Expenses Reported at Year End ( $000 omitted)
Years in Which
Losses Were
DEVELOPMENT
Years in Which
Losses Were
Incurred
ANNUAL STATEMENT FOR THE YEAR 2018 OF THE FICTITIOUS INSURANCE COMPANY
SCHEDULE P -PART 2A-HOMEOWNERS/FARMOWNERS
Incurred Net Losses and Defense and Cost containment Expenses Reported at Year End ( $000 omitted) DEVELOPMENT

11 12
1 2 3 4 5 6 7 8 9 10 Number of
2009 2010 2011 2012 2013 2014 2015 2016 2017 2018
Number of
Claims
Closed with
Loss
Payment
Claims
Closed
Without
Loss
Payment
1.
Prior......... 0................. 96............... 146............. 168............. 183............. 189............. 195............. 198............. 200............. 202............. 0................. 0.................
2.
2009......... 634............. 865............. 902............. 922............. 933............. 937............. 940............. 941............. 941............. 942............. 203............. 38...............
3.
2010......... …..XXX....... 768............. 1,025.......... 1,070.......... 1,090.......... 1,099.......... 1,102.......... 1,103.......... 1,105.......... 1,106.......... 218............. 34...............
4.
2011......... …..XXX....... …..XXX....... 821............. 1,245.......... 1,321.......... 1,347.......... 1,360.......... 1,368.......... 1,373.......... 1,379.......... 184............. 34...............
5.
2012......... …..XXX....... …..XXX....... …..XXX....... 936............. 1,296.......... 1,318.......... 1,345.......... 1,348.......... 1,359.......... 1,368.......... 189............. 27...............
6.
2013......... …..XXX....... …..XXX....... …..XXX....... …..XXX....... 936............. 1,239.......... 1,299.......... 1,325.......... 1,339.......... 1,341.......... 195............. 19...............
7.
2014......... …..XXX....... …..XXX....... …..XXX....... …..XXX....... …..XXX....... 961............. 1,302.......... 1,342.......... 1,373.......... 1,387.......... 177............. 16...............
8.
2015......... …..XXX....... …..XXX....... …..XXX....... …..XXX....... …..XXX....... …..XXX....... 1,512.......... 2,009.......... 2,099.......... 2,145.......... 275............. 23...............
9.
2016......... …..XXX....... …..XXX....... …..XXX....... …..XXX....... …..XXX....... …..XXX....... …..XXX....... 1,556.......... 2,063.......... 2,147.......... 269............. 25...............
10.
2017......... …..XXX....... …..XXX....... …..XXX....... …..XXX....... …..XXX....... …..XXX....... …..XXX....... …..XXX....... 1,740.......... 2,295.......... 296............. 25...............
11.
2018......... …..XXX....... …..XXX....... …..XXX....... …..XXX....... …..XXX....... …..XXX....... …..XXX....... …..XXX....... …..XXX....... 3,003.......... 382............. 24...............
11 12
1 2 3 4 5 6 7 8 9 10 Number of
2009 2010 2011 2012 2013 2014 2015 2016 2017 2018
Number of
Claims
Closed with
Loss
Payment
Claims
Closed
Without
Loss
Payment
1. Prior......... 0................. 816............. 1,217.......... 1,512.......... 1,662.......... 1,743.......... 1,785.......... 1,837.......... 1,851.......... 1,865.......... 0................. 0.................
2. 2009......... 249............. 591............. 874............. 1,121.......... 1,256.......... 1,344.......... 1,372.......... 1,391.......... 1,397.......... 1,399.......... 139............. 78...............
3. 2010......... …..XXX....... 265............. 573............. 919............. 1,133.......... 1,295.......... 1,351.......... 1,380.......... 1,409.......... 1,413.......... 124............. 70...............
4. 2011......... …..XXX....... …..XXX....... 232............. 549............. 826............. 1,012.......... 1,145.......... 1,193.......... 1,223.......... 1,234.......... 112............. 64...............
5. 2012......... …..XXX....... …..XXX....... …..XXX....... 212............. 490............. 744............. 924............. 1,041.......... 1,092.......... 1,119.......... 94............... 60...............
6. 2013......... …..XXX....... …..XXX....... …..XXX....... …..XXX....... 212............. 494............. 716............. 887............. 1,000.......... 1,039.......... 84............... 57...............
7. 2014......... …..XXX....... …..XXX....... …..XXX....... …..XXX....... …..XXX....... 241............. 549............. 804............. 1,003.......... 1,125.......... 87............... 60...............
8. 2015......... …..XXX....... …..XXX....... …..XXX....... …..XXX....... …..XXX....... …..XXX....... 238............. 506............. 789............. 997............. 85............... 59...............
9. 2016......... …..XXX....... …..XXX....... …..XXX....... …..XXX....... …..XXX....... …..XXX....... …..XXX....... 234............. 529............. 805............. 70............... 50...............
10. 2017......... …..XXX....... …..XXX....... …..XXX....... …..XXX....... …..XXX....... …..XXX....... …..XXX....... …..XXX....... 270............. 610............. 66............... 51...............
11. 2018......... …..XXX....... …..XXX....... …..XXX....... …..XXX....... …..XXX....... …..XXX....... …..XXX....... …..XXX....... …..XXX....... 306............. 49............... 42...............
Cummulative Paid Net Losses and Defense and Cost Containment Expenses Reported at Year End ($000 omitted)
Years in
Which
Losses Were
Incurred
62
ANNUAL STATEMENT FOR THE YEAR 2018 OF THE FICTITIOUS INSURANCE COMPANY
SCHEDULE P -PART 3C - COMMERCIAL AUTO/TRUCK LIABILITY/MEDICAL
SCHEDULE P -PART 3A - HOMEOWNERS/FARMOWNERS
Cummulative Paid Net Losses and Defense and Cost Containment Expenses Reported at Year End ($000 omitted)
Years in Which
Losses Were
Incurred

1 2 3 4 5 6 7 8 9 10
2009 2010 2011 2012 2013 2014 2015 2016 2017 2018
1.
Prior.......... 167............. 72................ 34................ 26................ 13................ 4.................. 1.................. 1.................. 0.................. 0..................
2.
2009......... 371............. 61................ 14................ 8.................. 4.................. 1.................. 0.................. 0.................. 1.................. 0..................
3.
2010......... …..XXX........ 409............. 34................ 30................ 5.................. 2.................. 1.................. 1.................. 1.................. 0..................
4.
2011......... …..XXX........ …..XXX........ 351............. 49................ 18................ 7.................. 8.................. 0.................. 0.................. 0..................
5.
2012......... …..XXX........ …..XXX........ …..XXX........ 680............. 245............. 264............. 165............. 59................ 34................ 45................
6.
2013......... …..XXX........ …..XXX........ …..XXX........ …..XXX........ 229............. 25................ (2)................ 1.................. 0.................. (1)................
7.
2014......... …..XXX........ …..XXX........ …..XXX........ …..XXX........ …..XXX........ 257............. 58................ (2)................ (1)................ 0..................
8.
2015......... …..XXX........ …..XXX........ …..XXX........ …..XXX........ …..XXX........ …..XXX........ 445............. 96................ 36................ 15................
9.
2016......... …..XXX........ …..XXX........ …..XXX........ …..XXX........ …..XXX........ …..XXX........ …..XXX........ 323............. 50................ 17................
10.
2017......... …..XXX........ …..XXX........ …..XXX........ …..XXX........ …..XXX........ …..XXX........ …..XXX........ …..XXX........ 518............. 77................
11.
2018......... …..XXX........ …..XXX........ …..XXX........ …..XXX........ …..XXX........ …..XXX........ …..XXX........ …..XXX........ …..XXX........ 591.............
1 2 3 4 5 6 7 8 9 10
2009 2010 2011 2012 2013 2014 2015 2016 2017 2018
1. Prior.......... 452............. 453............. 283............. 265............. 199............. 106............. 117............. 88................ 71................ 60................
2. 2009......... 807............. 380............. 259............. 166............. 120............. 70................ 62................ 54................ 21................ 20................
3. 2010......... …..XXX........ 869............. 465............. 268............. 174............. 110............. 70................ 52................ 26................ 25................
4. 2011......... …..XXX........ …..XXX........ 906............. 430............. 227............. 126............. 75................ 80................ 44................ 30................
5. 2012......... …..XXX........ …..XXX........ …..XXX........ 725............. 411............. 221............. 89................ 73................ 43................ 44................
6. 2013......... …..XXX........ …..XXX........ …..XXX........ …..XXX........ 671............. 360............. 191............. 105............. 67................ 56................
7. 2014......... …..XXX........ …..XXX........ …..XXX........ …..XXX........ …..XXX........ 705............. 378............. 134............. 104............. 50................
8. 2015......... …..XXX........ …..XXX........ …..XXX........ …..XXX........ …..XXX........ …..XXX........ 654............. 229............. 134............. 60................
9. 2016......... …..XXX........ …..XXX........ …..XXX........ …..XXX........ …..XXX........ …..XXX........ …..XXX........ 663............. 265............. 164.............
10. 2017......... …..XXX........ …..XXX........ …..XXX........ …..XXX........ …..XXX........ …..XXX........ …..XXX........ …..XXX........ 519............. 290.............
11. 2018......... …..XXX........ …..XXX........ …..XXX........ …..XXX........ …..XXX........ …..XXX........ …..XXX........ …..XXX........ …..XXX........ 617.............
SCHEDULE P -PART 4C -COMMERCIAL AUTO/TRUCK LIABILITY/MEDICAL
Bulk and IBNR Reserves on Net Losses and Defense Cost Containment Expenses Reported at Year End ('000 omitted)
Years in Which
Losses Were
67
Years in Which
Losses Were
Incurred
ANNUAL STATEMENT FOR THE YEAR 2018 OF THE FICTITIOUS INSURANCE COMPANY
SCHEDULE P -PART 4A - HOMEOWNERS
Bulk and IBNR Reserves on Net Losses and Defense Cost Containment Expenses Reported at Year End ('000 omitted)

1 2 3 4 5 6 7 8 9 10
2009 2010 2011 2012 2013 2014 2015 2016 2017 2018
1.
51................ 7.................. 3.................. 1.................. 1.................. 0.................. 0.................. 0.................. 0.................. 0..................
2.
166............. 199............. 202............. 202............. 203............. 203............. 203............. 203............. 203............. 203.............
3.
…..XXX........ 186............. 214............. 216............. 217............. 218............. 218............. 218............. 218............. 218.............
4.
…..XXX........ …..XXX........ 149............. 180............. 182............. 183............. 184............. 184............. 184............. 184.............
5.
…..XXX........ …..XXX........ …..XXX........ 155............. 185............. 187............. 188............. 189............. 189............. 190.............
6.
…..XXX........ …..XXX........ …..XXX........ …..XXX........ 166............. 191............. 194............. 195............. 195............. 196.............
7.
…..XXX........ …..XXX........ …..XXX........ …..XXX........ …..XXX........ 147............. 173............. 176............. 177............. 177.............
8.
…..XXX........ …..XXX........ …..XXX........ …..XXX........ …..XXX........ …..XXX........ 225............. 270............. 274............. 275.............
9.
…..XXX........ …..XXX........ …..XXX........ …..XXX........ …..XXX........ …..XXX........ …..XXX........ 219............. 266............. 269.............
10.
…..XXX........ …..XXX........ …..XXX........ …..XXX........ …..XXX........ …..XXX........ …..XXX........ …..XXX........ 254............. 296.............
11.
…..XXX........ …..XXX........ …..XXX........ …..XXX........ …..XXX........ …..XXX........ …..XXX........ …..XXX........ …..XXX........ 382.............
1 2 3 4 5 6 7 8 9 10
2009 2010 2011 2012 2013 2014 2015 2016 2017 2018
1.
11................ 5.................. 3.................. 2.................. 1.................. 1.................. 1.................. 1.................. 1.................. 1..................
2.
20................ 5.................. 3.................. 3.................. 2.................. 1.................. 1.................. 1.................. 1.................. 1..................
3.
…..XXX........ 19................ 4.................. 2.................. 1.................. 1.................. 1.................. 1.................. 1.................. 1..................
4.
…..XXX........ …..XXX........ 22................ 5.................. 2.................. 1.................. 1.................. 1.................. 1.................. 1..................
5.
…..XXX........ …..XXX........ …..XXX........ 25................ 4.................. 3.................. 1.................. 1.................. 1.................. 1..................
6.
…..XXX........ …..XXX........ …..XXX........ …..XXX........ 14................ 3.................. 1.................. 1.................. 1.................. 1..................
7.
…..XXX........ …..XXX........ …..XXX........ …..XXX........ …..XXX........ 15................ 3.................. 2.................. 1.................. 1..................
8.
…..XXX........ …..XXX........ …..XXX........ …..XXX........ …..XXX........ …..XXX........ 19................ 4.................. 2.................. 1..................
9.
…..XXX........ …..XXX........ …..XXX........ …..XXX........ …..XXX........ …..XXX........ …..XXX........ 19................ 3.................. 1..................
10.
…..XXX........ …..XXX........ …..XXX........ …..XXX........ …..XXX........ …..XXX........ …..XXX........ …..XXX........ 19................ 3..................
11.
…..XXX........ …..XXX........ …..XXX........ …..XXX........ …..XXX........ …..XXX........ …..XXX........ …..XXX........ …..XXX........ 21................
1 2 3 4 5 6 7 8 9 10
2009 2010 2011 2012 2013 2014 2015 2016 2017 2018
1.
31................ 2.................. 1.................. 0.................. 0.................. 0.................. 0.................. 0.................. 0.................. 0..................
2.
215............. 241............. 241............. 241............. 241............. 241............. 242............. 242............. 242............. 242.............
3.
…..XXX........ 235............. 252............. 253............. 253............. 253............. 253............. 253............. 253............. 253.............
4.
…..XXX........ …..XXX........ 199............. 219............. 219............. 219............. 219............. 219............. 219............. 219.............
5.
…..XXX........ …..XXX........ …..XXX........ 203............. 216............. 217............. 217............. 217............. 217............. 217.............
6.
…..XXX........ …..XXX........ …..XXX........ …..XXX........ 197............. 214............. 215............. 215............. 216............. 216.............
7.
…..XXX........ …..XXX........ …..XXX........ …..XXX........ …..XXX........ 175............. 193............. 194............. 194............. 194.............
8.
…..XXX........ …..XXX........ …..XXX........ …..XXX........ …..XXX........ …..XXX........ 263............. 297............. 299............. 300.............
9.
…..XXX........ …..XXX........ …..XXX........ …..XXX........ …..XXX........ …..XXX........ …..XXX........ 260............. 295............. 296.............
10.
…..XXX........ …..XXX........ …..XXX........ …..XXX........ …..XXX........ …..XXX........ …..XXX........ …..XXX........ 295............. 325.............
11.
…..XXX........ …..XXX........ …..XXX........ …..XXX........ …..XXX........ …..XXX........ …..XXX........ …..XXX........ …..XXX........ 427.............2018..........................
2013..........................
2014..........................
2015..........................
2016..........................
2017..........................
Prior...........................
2009..........................
2010..........................
2011..........................
2012..........................
2018..........................
Prior...........................
2009..........................
2010..........................
2011..........................
2013..........................
2014..........................
2015..........................
2016..........................
2017..........................
Prior...........................
2009..........................
2010..........................
2011..........................
2012..........................
Premiums were Earned
and Losses were Incurred
ANNUAL STATEMENT FOR THE YEAR 2018 OF THE FICTITIOUS INSURANCE COMPANY
SCHEDULE P -PART 5A HOMEOWNERS/FARMOWNERS
SECTION 1
Cummulative Number of Claims Closed with Loss Payment Direct and Assumed at Year End
Years in Which
72
Years in Which
Premiums were Earned
and Losses were Incurred
SECTION 2
Number of Claims Outstanding Direct and Assumed at Year End
Years in Which
Premiums were Earned
and Losses were Incurred
SECTION 3
Cummulative Number of Claims Reported Direct and Assumed at Year End
2012..........................
2013..........................
2014..........................
2015..........................
2016..........................
2017..........................
2018..........................

1 2 3 4 5 6 7 8 9 10
2009 2010 2011 2012 2013 2014 2015 2016 2017 2018
1.
53.............. 23.............. 18.............. 7................ 3................ (1)............... 2................ 1................ 1................ 1................
2.
84.............. 118............ 133............ 138............ 139............ 139............ 139............ 140............ 140............ 140............
3.
…..XXX....... 77.............. 112............ 119............ 122............ 123............ 124............ 124............ 125............ 125............
4.
…..XXX....... …..XXX....... 75.............. 102............ 107............ 110............ 112............ 112............ 113............ 113............
5.
…..XXX....... …..XXX....... …..XXX....... 62.............. 84.............. 89.............. 92.............. 93.............. 94.............. 94..............
6.
…..XXX....... …..XXX....... …..XXX....... …..XXX....... 51.............. 74.............. 8................ 82.............. 83.............. 84..............
7.
…..XXX....... …..XXX....... …..XXX....... …..XXX....... …..XXX....... 52.............. 79.............. 84.............. 86.............. 88..............
8.
…..XXX....... …..XXX....... …..XXX....... …..XXX....... …..XXX....... …..XXX....... 58.............. 79.............. 83.............. 86..............
9.
…..XXX....... …..XXX....... …..XXX....... …..XXX....... …..XXX....... …..XXX....... …..XXX....... 45.............. 66.............. 71..............
10.
…..XXX....... …..XXX....... …..XXX....... …..XXX....... …..XXX....... …..XXX....... …..XXX....... …..XXX....... 47.............. 67..............
11.
…..XXX....... …..XXX....... …..XXX....... …..XXX....... …..XXX....... …..XXX....... …..XXX....... …..XXX....... …..XXX....... 49..............
1 2 3 4 5 6 7 8 9 10
2009 2010 2011 2012 2013 2014 2015 2016 2017 2018
1.
38.............. 20.............. 13.............. 7................ 6................ 4................ 3................ 3................ 2................ 1................
2.
34.............. 15.............. 9................ 4................ 3................ 1................ 1................ 1................ 1................ 1................
3.
…..XXX....... 31.............. 15.............. 6................ 5................ 2................ 1................ 1................ 1................ 1................
4.
…..XXX....... …..XXX....... 6,354......... 10.............. 8................ 4................ 2................ 1................ 1................ 1................
5.
…..XXX....... …..XXX....... …..XXX....... 26.............. 14.............. 7................ 4................ 2................ 1................ 1................
6.
…..XXX....... …..XXX....... …..XXX....... …..XXX....... 38.............. 13.............. 7................ 4................ 2................ 1................
7.
…..XXX....... …..XXX....... …..XXX....... …..XXX....... …..XXX....... 38.............. 13.............. 7................ 4................ 2................
8.
…..XXX....... …..XXX....... …..XXX....... …..XXX....... …..XXX....... …..XXX....... 37.............. 13.............. 7................ 4................
9.
…..XXX....... …..XXX....... …..XXX....... …..XXX....... …..XXX....... …..XXX....... …..XXX....... 38.............. 13.............. 7................
10.
…..XXX....... …..XXX....... …..XXX....... …..XXX....... …..XXX....... …..XXX....... …..XXX....... …..XXX....... 40.............. 13..............
11.
…..XXX....... …..XXX....... …..XXX....... …..XXX....... …..XXX....... …..XXX....... …..XXX....... …..XXX....... …..XXX....... 42..............
1 2 3 4 5 6 7 8 9 10
2009 2010 2011 2012 2013 2014 2015 2016 2017 2018
1.
40.............. 16.............. 18.............. 6................ 3................ (2)............... 2................ 1................ 1................ 0................
2.
168............ 202............ 217............ 218............ 220............ 218............ 218............ 219............ 219............ 219............
3.
…..XXX....... 153............ 193............ 193............ 196............ 196............ 196............ 195............ 195............ 195............
4.
…..XXX....... …..XXX....... 6,354......... 171............ 177............ 177............ 178............ 177............ 177............ 177............
5.
…..XXX....... …..XXX....... …..XXX....... 128............ 154............ 155............ 156............ 155............ 155............ 155............
6.
…..XXX....... …..XXX....... …..XXX....... …..XXX....... 124............ 141............ 143............ 143............ 143............ 143............
7.
…..XXX....... …..XXX....... …..XXX....... …..XXX....... …..XXX....... 13.............. 149............ 150............ 150............ 139............
8.
…..XXX....... …..XXX....... …..XXX....... …..XXX....... …..XXX....... …..XXX....... 141............ 149............ 149............ 149............
9.
…..XXX....... …..XXX....... …..XXX....... …..XXX....... …..XXX....... …..XXX....... …..XXX....... 121............ 127............ 128............
10.
…..XXX....... …..XXX....... …..XXX....... …..XXX....... …..XXX....... …..XXX....... …..XXX....... …..XXX....... 126............ 132............
11.
…..XXX....... …..XXX....... …..XXX....... …..XXX....... …..XXX....... …..XXX....... …..XXX....... …..XXX....... …..XXX....... 134............2018............................
2013............................
2014............................
2015............................
2016............................
2017............................
Prior.............................
2009............................
2010............................
2011............................
2012............................
2018............................
Prior.............................
2009............................
2010............................
2011............................
2013............................
2014............................
2015............................
2016............................
2017............................
Prior.............................
2009............................
2010............................
2011............................
2012............................
Premiums were Earned and
Losses were Incurred
ANNUAL STATEMENT FOR THE YEAR 2018 OF THE FICTITIOUS INSURANCE COMPANY
SCHEDULE P -PART 5C-COMMERCIAL AUTO/TRUCK LIABILITY/MEDICAL
SECTION 1
Cummulative Number of Claims Closed with Loss Payment Direct and Assumed at Year End
Years in Which
74
Cummulative Number of Claims Reported Direct and Assumed at Year End
Years in Which
Premiums were Earned and
Losses were Incurred
SECTION 2
Number of Claims Outstanding Direct and Assumed at Year End
Years in Which
Premiums were Earned and
Losses were Incurred
SECTION 3
2012............................
2013............................
2014............................
2015............................
2016............................
2017............................
2018............................

11
1 2 3 4 5 6 7 8 9 10
Current Year
2009 2010 2011 2012 2013 2014 2015 2016 2017 2018
Premiums
Earned
1.
Prior.................................... 256................ 16.................. 38.................. 6.................... (12)................. 16.................. (1)................... 0.................... 3.................... 3.................... 3....................
2.
2009.................................... 2,651............. 2,903............. 2,914............. 2,915............. 2,906............. 2,906............. 2,905............. 2,905............. 2,905............. 2,905............. 0....................
3.
2010.................................... …..XXX.......... 2,859............. 3,146............. 3,197............. 3,185............. 3,183............. 3,180............. 3,180............. 3,186............. 3,185............. (1)...................
4.
2011.................................... …..XXX.......... …..XXX.......... 2,544............. 2,897............. 2,930............. 2,922............. 2,917............. 2,916............. 2,919............. 2,919............. (0)...................
5.
2012.................................... …..XXX.......... …..XXX.......... …..XXX.......... 2,491............. 2,663............. 2,676............. 2,665............. 2,666............. 2,665............. 2,664............. (0)...................
6.
2013.................................... …..XXX.......... …..XXX.......... …..XXX.......... …..XXX.......... 2,421............. 2,484............. 2,480............. 2,481............. 2,477............. 2,476............. (1)...................
7.
2014.................................... …..XXX.......... …..XXX.......... …..XXX.......... …..XXX.......... …..XXX.......... 2,392............. 2,408............. 2,415............. 2,403............. 2,404............. 1....................
8.
2015.................................... …..XXX.......... …..XXX.......... …..XXX.......... …..XXX.......... …..XXX.......... …..XXX.......... 2,397............. 2,419............. 2,422............. 2,421............. (1)...................
9.
2016.................................... …..XXX.......... …..XXX.......... …..XXX.......... …..XXX.......... …..XXX.......... …..XXX.......... …..XXX.......... 2,344............. 2,346............. 2,340............. (5)...................
10.
2017.................................... …..XXX.......... …..XXX.......... …..XXX.......... …..XXX.......... …..XXX.......... …..XXX.......... …..XXX.......... …..XXX.......... 2,302............. 2,328............. 26..................
11.
2018.................................... …..XXX.......... …..XXX.......... …..XXX.......... …..XXX.......... …..XXX.......... …..XXX.......... …..XXX.......... …..XXX.......... …..XXX.......... 2,283............. 2,283.............
12.
Total.................................... …..XXX.......... …..XXX.......... …..XXX.......... …..XXX.......... …..XXX.......... …..XXX.......... …..XXX.......... …..XXX.......... …..XXX.......... …..XXX.......... 2,305.............
13.
Earned Premium P -Pt1..... 2,906............. 3,128............. 2,879............. 2,904............. 2,592............. 2,476............. 2,387............. 2,374............. 2,302............. 2,305............. …..XXX..........
11
1 2 3 4 5 6 7 8 9 10
Current Year
2009 2010 2011 2012 2013 2014 2015 2016 2017 2018
Premiums
Earned
1.
Prior.................................... 173................ 21.................. (7)................... (4)................... 0.................... (0)................... 1.................... (0)................... 0.................... 0.................... 0....................
2.
2009.................................... 373................ 498................ 507................ 510................ 508................ 508................ 508................ 508................ 508................ 508................ 0....................
3.
2010.................................... …..XXX.......... 361................ 502................ 530................ 526................ 525................ 526................ 526................ 527................ 527................ 0....................
4.
2011.................................... …..XXX.......... …..XXX.......... 345................ 479................ 513................ 511................ 513................ 513................ 513................ 513................ 0....................
5.
2012.................................... …..XXX.......... …..XXX.......... …..XXX.......... 228................ 248................ 246................ 248................ 248................ 248................ 248................ 0....................
6.
2013.................................... …..XXX.......... …..XXX.......... …..XXX.......... …..XXX.......... 223................ 238................ 242................ 244................ 247................ 248................ 0....................
7.
2014.................................... …..XXX.......... …..XXX.......... …..XXX.......... …..XXX.......... …..XXX.......... 140................ 134................ 142................ 150................ 150................ 0....................
8.
2015.................................... …..XXX.......... …..XXX.......... …..XXX.......... …..XXX.......... …..XXX.......... …..XXX.......... 170................ 117................ 117................ 118................ 0....................
9.
2016.................................... …..XXX.......... …..XXX.......... …..XXX.......... …..XXX.......... …..XXX.......... …..XXX.......... …..XXX.......... 184................ 199................ 200................ 1....................
10.
2017.................................... …..XXX.......... …..XXX.......... …..XXX.......... …..XXX.......... …..XXX.......... …..XXX.......... …..XXX.......... …..XXX.......... 87.................. 97.................. 10..................
11.
2018.................................... …..XXX.......... …..XXX.......... …..XXX.......... …..XXX.......... …..XXX.......... …..XXX.......... …..XXX.......... …..XXX.......... …..XXX.......... 71.................. 71..................
12.
Total.................................... …..XXX.......... …..XXX.......... …..XXX.......... …..XXX.......... …..XXX.......... …..XXX.......... …..XXX.......... …..XXX.......... …..XXX.......... …..XXX.......... 83..................
13.
Earned Premium P -Pt1..... 545................ 507................ 490................ 388................ 271................ 150................ 173................ 142................ 113................ 83.................. …..XXX..........
84
Cummulative Premiums Earned Ceded at Year End ($000 omitted)
Were Earned and Losses Were
Incurred
ANNUAL STATEMENT FOR THE YEAR 2018 OF THE FICTITIOUS INSURANCE COMPANY
SCHEDULE P -PART 6C-COMMERCIAL AUTO/TRUCK LIABILITY/MEDICAL
SECTION 1
Cummulative Premiums Earned Direct and Assumed at Year End ($000 omitted)
Were Earned and Losses Were
Incurred
SECTION 2
Years in Which Premiums
Years in Which Premiums

FINANCIAL REPORTING THROUGH THE LENS OF A PROPERTY/CASUALTY ACTUARY
Appendix I. Fictitious Insurance Company
EXCERPTS FROM THE 2018 INSURANCE EXPENSE EXHIBIT FOR FICTITIOUS
INSURANCE COMPANY

Supp 01
(To Be Filed by April 1)
OF THE Fictitious Insurance Company
ADDRESS
Contact Person _____________ Title _________ Telephone ____________________
ANNUAL STATEMENT FOR THE YEAR 2018 OF THE Fictitious Insurance Company
INSURANCE EXPENSE EXHIBIT
FOR THE YEAR ENDED DECEMBER, 31, 2018
NAIC Group Code _______ NAIC Company Code _______ Federal Employer's Identification Number (FEIN) _______

PART I - ALLOCATION TO EXPENSE GROUPS
(000 Omitted)
1 5 6
2 3 4
Operating Expense Classifications
Loss
Adjustment
Expense
Acquisition, Field
Supervision and
Collection
Expenses
General
Expenses
Taxes, Licenses
and Fees
Investment
Expenses Total Expenses
1.
Claim adjustment services:
1.1 Direct................................................................................................ 1,881................ 0......................... 0....................... 0........................ 0....................... 1,881...................
1.2 Reinsurance assumed..................................................................... 0....................... 0......................... 0....................... 0........................ 0....................... 0..........................
1.3 Reinsurance ceded.......................................................................... 210................... 0......................... 0....................... 0........................ 0....................... 210......................
1.4 Net claim adjustment services (1.1+1.2-1.3)................................... 1,671................ 0......................... 0....................... 0........................ 0....................... 1,671...................
2.
Commission and brokerage:
2.1 Direct excluding contingent ............................................................. 0....................... 4,759.................. 0....................... 0........................ 0....................... 4,759...................
2.2 Reinsurance assumed excluding contingent .................................. 0....................... 0......................... 0....................... 0........................ 0....................... 0..........................
2.3 Reinsurance ceded excluding contingent ....................................... 0....................... 816..................... 0....................... 0........................ 0....................... 816......................
2.4 Contingent - direct ........................................................................... 0....................... 121..................... 0....................... 0........................ 0....................... 121......................
2.5 Contingent - reinsurance assumed ................................................. 0....................... 0......................... 0....................... 0........................ 0....................... 0..........................
2.6 Contingent - reinsurance ceded ...................................................... 0....................... 9......................... 0....................... 0........................ 0....................... 9..........................
2.7 Policy and membership fees ........................................................... 0....................... 0......................... 0....................... 0........................ 0....................... 0..........................
2.8 Net commission and brokerage
(Lines 2.1+2.2-2.3+2.4+2.5-2.6+2.7)....................................................... 0....................... 4,055.................. 0....................... 0........................ 0....................... 4,055...................
3.
Allowances to managers and agents....................................................... 0....................... 1......................... 3....................... 0........................ 0....................... 4..........................
4.
Advertising............................................................................................... 0....................... 75....................... 133................... 0........................ 0....................... 208......................
5.
Boards, bureaus and associations........................................................... 7....................... 38....................... 68..................... 0........................ 0....................... 113......................
6.
Surveys and underwriting reports............................................................ 0....................... 36....................... 63..................... 0........................ 0....................... 99........................
7.
Audit of assureds' records....................................................................... 0....................... 0......................... 0....................... 0........................ 0....................... 0..........................
8.
Salary and related items:
8.1 Salaries ........................................................................................... 949................... 664..................... 1,181................ 0........................ 32..................... 2,826...................
8.2 Payroll taxes .................................................................................... 69..................... 41....................... 74..................... 0........................ 0....................... 184......................
9.
Employee relations and welfare............................................................... 182................... 105..................... 188................... 0........................ 3....................... 478......................
10.
Insurance................................................................................................. 117................... 8......................... 15..................... 0........................ 0....................... 140......................
11.
Directors' fees.......................................................................................... 0....................... 0......................... 0....................... 0........................ 0....................... 0..........................
12.
Travel and travel items............................................................................ 64..................... 34....................... 61..................... 0........................ 0....................... 159......................
13.
Rent and rent items.................................................................................. 62..................... 48....................... 85..................... 0........................ 1....................... 196......................
14.
Equipment................................................................................................ 11..................... 15....................... 27..................... 0........................ 3....................... 56........................
15.
Cost or depreciation of EDP equipment and software............................. 30..................... 119..................... 211................... 0........................ 0....................... 360......................
16.
Printing and stationery............................................................................. 5....................... 7......................... 12..................... 0........................ 0....................... 24........................
17.
Postage, telephone and telegraph, exchange and express..................... 19..................... 40....................... 72..................... 0........................ 0....................... 131......................
18.
Legal and auditing.................................................................................... 44..................... 5......................... 9....................... 0........................ 2....................... 60........................
19.
Totals (Lines 3 to 18)............................................................................... 1,559................ 1,236.................. 2,202................ 0........................ 41..................... 5,038...................
20.
Taxes, licenses and fees:
20.1 State and local insurance taxes deducting guaranty association
credit of $ 1,103...................................................................................... 0....................... 0......................... 0....................... 791.................... 0....................... 791......................
20.2 Insurance department licenses and fees ...................................... 0....................... 0......................... 0....................... 53...................... 0....................... 53........................
20.3 Gross guaranty association assessments..................................... 0....................... 0......................... 0....................... (2)....................... 0....................... (2)........................
20.4 All other (excluding federal and foreign income and real 0......................... 0....................... 0........................ 0..........................
estate)...................................................................................................... 0....................... 0......................... 0....................... 18...................... 0....................... 18........................
20.5 Total taxes, licenses and fees (Lines
20.1+20.2+20.3+20.4).............................................................................. 0....................... 0......................... 0....................... 860.................... 0....................... 860......................
21.
Real estate expenses.............................................................................. 0....................... 0......................... 0....................... 0........................ 332................... 332......................
22.
Real estate taxes..................................................................................... 0....................... 0......................... 0....................... 0........................ 14..................... 14........................
23.
Reimbursements by uninsured plans...................................................... …….XXX.......... …….XXX............. …….XXX.......... …….XXX............ …….XXX.......... …….XXX..............
24.
Aggregate write-ins for miscellaneous operating expenses.................... 25..................... 47....................... 83..................... 0........................ 6....................... 161......................
25.
TOTAL EXPENSES INCURRED 3,255................ 5,338.................. 2,285................ 860.................... 393................... 12,131.................
INSURANCE EXPENSE EXHIBIT FOR THE YEAR December 31, 2018 OF THE FICTITIOUS INSURANCE COMPANY
Other Underwriting Expenses
Supp 02

Premiums Written
(Pg. 8, Pt. 1B, Col. 6)
Premiums Earned
(Pg. 6, Pt. 1, Col. 4)
Dividends to
Policyholders
(Pg. 4, Line 17)
Incurred Loss
(Pg. 9, Pt. 2, Col. 7)
Adjusting and Other
Expenses Incurred
Unpaid Losses
(Pg. 10, Pt. 2A, Col. 8)
Defense and Cost
Containment Expenses
Unpaid
Adjusting and Other
Expenses Unpaid
Unearned Premium
Reserves
(Pg. 7, Pt. 1A, Col. 5)
1
2 3 4 5 6 7 8 9 10 11 12 13 14 15 16 17 18 19 20 21 22
Amount
%
Amount
%
Amount
%
Amount
%
Amount
%
Amount
%
Amount
%
Amount
%
Amount
%
Amount
%
Amount
%
1.
Fire............................................................................................. 2,484......... ….XXX....... 2,509......... 100.0....... 1................ 0.0........... 1,554......... 61.9.......... 51.............. 2.0........... 129............ 5.1........ 1,402............. 55.9........... 92.................. 3.7........ 130.............. 5.2........ 1,133........... 45.1......... 385......... 15.3........
2.1 Allied Lines................................................................................. 0................ ….XXX....... 0................ 0.0........... 0................ 0.0........... 0................ 0.0............ 0................ 0.0........... 0................ 0.0........ 0.................... 0.0............. 0.................... 0.0........ 0.................. 0.0........ 0.................. 0.0........... 0............. 0.0..........
2.2 Multiple Peril Crop...................................................................... 0................ ….XXX....... 0................ 0.0........... 0................ 0.0........... 0................ 0.0............ 0................ 0.0........... 0................ 0.0........ 0.................... 0.0............. 0.................... 0.0........ 0.................. 0.0........ 0.................. 0.0........... 0............. 0.0..........
2.3 Federal Flood............................................................................. 0................ ….XXX....... 0................ 0.0........... 0................ 0.0........... 0................ 0.0............ 0................ 0.0........... 0................ 0.0........ 0.................... 0.0............. 0.................... 0.0........ 0.................. 0.0........ 0.................. 0.0........... 0............. 0.0..........
3.
Farmowners Multiple Peril.......................................................... 0................ ….XXX....... 0................ 0.0........... 0................ 0.0........... 0................ 0.0............ 0................ 0.0........... 0................ 0.0........ 0.................... 0.0............. 0.................... 0.0........ 0.................. 0.0........ 0.................. 0.0........... 0............. 0.0..........
4.
Homeowners Multiple Peril........................................................ 4,555......... ….XXX....... 4,445......... 100.0....... 0................ 0.0........... 3,789......... 85.2.......... 74.............. 1.7........... 360............ 8.1........ 1,311............. 29.5........... 55.................. 1.2........ 89................ 2.0........ 2,401........... 54.0......... 1,901...... 42.8........
5.1 Commercial Multiple Peril (Non-Liability Portion)....................... 3,032......... ….XXX....... 3,034......... 100.0....... (0)............... (0.0).......... 1,155......... 38.1.......... 82.............. 2.7........... 119............ 3.9........ 672................ 22.1........... 83.................. 2.7........ 106.............. 3.5........ 1,377........... 45.1......... 606......... 19.9........
5.2 Commercial Multiple Peril (Liability Portion).............................. 1,645......... ….XXX....... 1,659......... 100.0....... 0................ 0.0........... 969............ 58.4.......... 314............ 18.9......... 41.............. 2.5........ 2,639............. 159.1......... 1,024............. 61.7...... 258.............. 15.6...... 746.............. 45.0......... 447......... 26.9........
6.
Mortgage Guaranty.................................................................... 0................ ….XXX....... 0................ 0.0........... 0................ 0.0........... 0................ 0.0............ 0................ 0.0........... 0................ 0.0........ 0.................... 0.0............. 0.................... 0.0........ 0.................. 0.0........ 0.................. 0.0........... 0............. 0.0..........
8.
Ocean Marine............................................................................. 0................ ….XXX....... 0................ 0.0........... 0................ 0.0........... 0................ 0.0............ 0................ 0.0........... 0................ 0.0........ 0.................... 0.0............. 0.................... 0.0........ 0.................. 0.0........ 0.................. 0.0........... 0............. 0.0..........
9.
Inland Marine............................................................................. 0................ ….XXX....... 0................ 0.0........... 0................ 0.0........... 0................ 0.0............ 0................ 0.0........... 0................ 0.0........ 0.................... 0.0............. 0.................... 0.0........ 0.................. 0.0........ 0.................. 0.0........... 0............. 0.0..........
10.
Financial Guaranty..................................................................... 0................ ….XXX....... 0................ 0.0........... 0................ 0.0........... 0................ 0.0............ 0................ 0.0........... 0................ 0.0........ 0.................... 0.0............. 0.................... 0.0........ 0.................. 0.0........ 0.................. 0.0........... 0............. 0.0..........
11.
Medical Professional Liability..................................................... 0................ ….XXX....... 0................ 0.0........... 0................ 0.0........... 0................ 0.0............ 0................ 0.0........... 0................ 0.0........ 0.................... 0.0............. 0.................... 0.0........ 0.................. 0.0........ 0.................. 0.0........... 0............. 0.0..........
12.
Earthquake................................................................................. 0................ ….XXX....... 0................ 0.0........... 0................ 0.0........... 0................ 0.0............ 0................ 0.0........... 0................ 0.0........ 0.................... 0.0............. 0.................... 0.0........ 0.................. 0.0........ 0.................. 0.0........... 0............. 0.0..........
13.
Group A&H (See Interrogatory 1)............................................... 0................ ….XXX....... 0................ 0.0........... 0................ 0.0........... 0................ 0.0............ 0................ 0.0........... 0................ 0.0........ 0.................... 0.0............. 0.................... 0.0........ 0.................. 0.0........ 0.................. 0.0........... 0............. 0.0..........
14.
Credit A & H............................................................................... 0................ ….XXX....... 0................ 0.0........... 0................ 0.0........... 0................ 0.0............ 0................ 0.0........... 0................ 0.0........ 0.................... 0.0............. 0.................... 0.0........ 0.................. 0.0........ 0.................. 0.0........... 0............. 0.0..........
15.
Other A&H (See Interrogatory 1)................................................ 0................ ….XXX....... 0................ 0.0........... 0................ 0.0........... 0................ 0.0............ 0................ 0.0........... 0................ 0.0........ 0.................... 0.0............. 0.................... 0.0........ 0.................. 0.0........ 0.................. 0.0........... 0............. 0.0..........
16.
Workers' Compensation............................................................. 4,022......... ….XXX....... 3,943......... 100.0....... 42.............. 1.1........... 318............ 8.1............ 426............ 10.8......... (31)............. (0.8)....... 13,833........... 350.8......... 1,639............. 41.6...... 474.............. 12.0...... 1,520........... 38.5......... 1,282...... 32.5........
17.1 Other Liability - Occurrence....................................................... 3,502......... ….XXX....... 3,548......... 100.0....... 1................ 0.0........... 4,110......... 115.8........ 483............ 13.6......... 299............ 8.4........ 16,050........... 452.4......... 3,466............. 97.3...... 1,175........... 33.1...... 1,648........... 46.4......... 785......... 22.1........
17.2 Other Liability - Claims-made..................................................... 0................ ….XXX....... 0................ 0.0........... 0................ 0.0........... 0................ 0.0............ 0................ 0.0........... 0................ 0.0........ 0.................... 0.0............. 0.................... 0.0........ 0.................. 0.0........ 0.................. 0.0........... 0............. 0.0..........
17.3 Excess Workers' Compensation................................................ 0................ ….XXX....... 0................ 0.0........... 0................ 0.0........... 0................ 0.0............ 0................ 0.0........... 0................ 0.0........ 0.................... 0.0............. 0.................... 0.0........ 0.................. 0.0........ 0.................. 0.0........... 0............. 0.0..........
18.
Products Liability........................................................................ 0................ ….XXX....... 0................ 0.0........... 0................ 0.0........... 0................ 0.0............ 0................ 0.0........... 0................ 0.0........ 0.................... 0.0............. 0.................... 0.0........ 0.................. 0.0........ 0.................. 0.0........... 0............. 0.0..........
19.1,19.2 Private Passenger Auto Liability................................................ 2,804......... ….XXX....... 2,732......... 100.0....... 0................ 0.0........... 1,791......... 65.6.......... 81.............. 3.0........... 244............ 8.9........ 2,083............. 76.2........... 238................ 8.7........ 161.............. 5.9........ 954.............. 34.9......... 475......... 17.4........
19.3,19.4 Commercial Auto Liability........................................................... 2,250......... ….XXX....... 2,223......... 100.0....... 1................ 0.0........... 1,432......... 64.4.......... 130............ 5.9........... 144............ 6.5........ 2,974............. 133.8......... 321................ 14.4...... 155.............. 7.0........ 1,014........... 45.6......... 758......... 34.1........
21.1 Private Passenger Auto Physical Damage................................. 1,665......... ….XXX....... 1,632......... 100.0....... 0................ 0.0........... 1,072......... 65.7.......... 2................ 0.1........... 222............ 13.7...... 37.................. 2.3............. 2.................... 0.1........ 20................ 1.2........ 554.............. 34.3......... 283......... 17.5........
21.2 Commercial Auto Physical Damage........................................... 647............ ….XXX....... 646............ 100.0....... 0................ 0.1........... 456............ 70.6.......... 15.............. 2.3........... 54.............. 8.4........ 177................ 27.4........... 51.................. 7.9........ 23................ 3.6........ 291.............. 45.0......... 213......... 33.0........
22.
Aircraft (all perils)....................................................................... 0................ ….XXX....... 0................ 0.0........... 0................ 0.0........... 0................ 0.0............ 0................ 0.0........... 0................ 0.0........ 0.................... 0.0............. 0.................... 0.0........ 0.................. 0.0........ 0.................. 0.0........... 0............. 0.0..........
23.
Fidelity........................................................................................ 146............ ….XXX....... 141............ 100.0....... 0................ 0.3........... 261............ 185.1........ 13.............. 9.2........... 4................ 2.8........ 716................ 336.9......... 97.................. 68.8...... 4.................. 2.8........ 53................ 37.6......... 37........... 26.2........
24.
Surety......................................................................................... 0................ ….XXX....... 0................ 0.0........... 0................ 0.0........... 0................ 0.0............ 0................ 0.0........... 0................ 0.0........ 0.................... 0.0............. 0.................... 0.0........ 0.................. 0.0........ 0.................. 0.0........... 0............. 0.0..........
26.
Burglary and Theft...................................................................... 0................ ….XXX....... 0................ 0.0........... 0................ 0.0........... 0................ 0.0............ 0................ 0.0........... 0................ 0.0........ 0.................... 0.0............. 0.................... 0.0........ 0.................. 0.0........ 0.................. 0.0........... 0............. 0.0..........
27.
Boiler and Machinery................................................................. 0................ ….XXX....... 0................ 0.0........... 0................ 0.0........... 0................ 0.0............ 0................ 0.0........... 0................ 0.0........ 0.................... 0.0............. 0.................... 0.0........ 0.................. 0.0........ 0.................. 0.0........... 0............. 0.0..........
28.
Credit.......................................................................................... 0................ ….XXX....... 0................ 0.0........... 0................ 0.0........... 0................ 0.0............ 0................ 0.0........... 0................ 0.0........ 0.................... 0.0............. 0.................... 0.0........ 0.................. 0.0........ 0.................. 0.0........... 0............. 0.0..........
29.
International............................................................................... 0................ ….XXX....... 0................ 0.0........... 0................ 0.0........... 0................ 0.0............ 0................ 0.0........... 0................ 0.0........ 0.................... 0.0............. 0.................... 0.0........ 0.................. 0.0........ 0.................. 0.0........... 0............. 0.0..........
30.
Warranty.................................................................................... 0................ ….XXX....... 0................ 0.0........... 0................ 0.0........... 0................ 0.0............ 0................ 0.0........... 0................ 0.0........ 0.................... 0.0............. 0.................... 0.0........ 0.................. 0.0........ 0.................. 0.0........... 0............. 0.0..........
31, 32, 33 Reinsurance-Nonproportional Assumed.................................... 0................ ….XXX....... 0................ 0.0........... 0................ 0.0........... 0................ 0.0............ 0................ 0.0........... 0................ 0.0........ 0.................... 0.0............. 0.................... 0.0........ 0.................. 0.0........ 0.................. 0.0........... 0............. 0.0..........
34.
Aggregate write-ins for
Other Lines of Business............................................................. 0................ ….XXX....... 0................ 0.0........... 0................ 0.0........... 0................ 0.0............ 0................ 0.0........... 0................ 0.0........ 0.................... 0.0............. 0.................... 0.0........ 0.................. 0.0........ 0.................. 0.0........... 0............. 0.0..........
35.
TOTALS (Lines 1 through 34) 26,752 XXX 26,512 100.0....... 46 0.2........... 16,907 63.8.......... 1,671 6.3........... 1,585 6.0........ 41,894 158.0......... 7,068 26.6...... 2,595 9.8........ 11,691 44.1......... 7,172 27.1........
INSURANCE EXPENSE EXHIBIT FOR THE YEAR 2018 OF THE FICTITIOUS INSURANCE COMPANY
Supp 03
Agents' Balances
PART II - ALLOCATION TO LINES OF BUSINESS NET OF REINSURANCE
PREMIUMS, LOSSES, EXPENSES, RESERVES AND PROFITS AND PERCENTAGES TO PREMIUMS EARNED FOR BUSINESS NET OF REINSURANCE (000 Omitted)
Loss Adjustment Expense Loss Adjustment Expense
Defense and Cost
Containment Expenses
Incurred

1.
Fire.............................................................................................
2.1 Allied Lines.................................................................................
2.2 Multiple Peril Crop......................................................................
2.3 Federal Flood.............................................................................
3.
Farmowners Multiple Peril..........................................................
4.
Homeowners Multiple Peril........................................................
5.1 Commercial Multiple Peril (Non-Liability Portion).......................
5.2 Commercial Multiple Peril (Liability Portion)..............................
6.
Mortgage Guaranty....................................................................
8.
Ocean Marine.............................................................................
9.
Inland Marine.............................................................................
10.
Financial Guaranty.....................................................................
11.
Medical Professional Liability.....................................................
12.
Earthquake.................................................................................
13.
Group A&H (See Interrogatory 1)...............................................
14.
Credit A & H...............................................................................
15.
Other A&H (See Interrogatory 1)................................................
16.
Workers' Compensation.............................................................
17.1 Other Liability - Occurrence.......................................................
17.2 Other Liability - Claims-made.....................................................
17.3 Excess Workers' Compensation................................................
18.
Products Liability........................................................................
19.1,19.2 Private Passenger Auto Liability................................................
19.3,19.4 Commercial Auto Liability...........................................................
21.1 Private Passenger Auto Physical Damage.................................
21.2 Commercial Auto Physical Damage...........................................
22.
Aircraft (all perils).......................................................................
23.
Fidelity........................................................................................
24.
Surety.........................................................................................
26.
Burglary and Theft......................................................................
27.
Boiler and Machinery.................................................................
28.
Credit..........................................................................................
29.
International...............................................................................
30.
Warranty....................................................................................
31, 32, 33 Reinsurance-Nonproportional Assumed....................................
34.
Aggregate write-ins for
Other Lines of Business.............................................................
35.
TOTALS (Lines 1 through 34)
Commission and
Brokerage Expenses
Incurred
(IEE Pt. 1, Line 2.8, Col. 2)
Taxes, Licenses & Fees
Incurred
(IEE Pt. 1, Line 20.5,
Col. 4)
Other Acquisitions, Field
Supervision, and Collection
Expenses Incurred
(IEE Pt. 1, Line 25 minus
2.8 Col. 2)
General Expenses Incurred
(IEE Pt. 1, Line 25, Col. 3)
Other Income Less
Other Expenses
(Pg. 4, Line 15 minus
Line 5)
Pre-Tax Profit or Loss
Excluding All Investment
Gain
Investment Gain on Funds
Attributable to Insurance
Transactions
Profit or Loss Excluding
Investment Gain
Attributable to Capital and
Surplus
Investment Gain
Attributable to Capital and
Surplus Total Profit or Loss
23 24 25 26 27 28 29 30 31 32 33 34 35 36 37 38 39 40 41 42
Amount
%
Amount
%
Amount
%
Amount
%
Amount
%
Amount
%
Amount
%
Amount
%
Amount
%
Amount
%
445............... 17.7.......... 81................. 3.2....... 105.............. 4.2............... 190.............. 7.6............... 9................. 0.4........ (38)............. (1.5)............ 110.............. 4.4............. 72................. 2.9................ 109............. 4.3.............. 181.............. 7.2........
0................... 0.0............ 0................... 0.0....... 0.................. 0.0............... 0.................. 0.0............... 0................. 0.0........ 0................ 0.0............. 0.................. 0.0............. 0................... 0.0................ 0................. 0.0.............. 0.................. 0.0........
0................... 0.0............ 0................... 0.0....... 0.................. 0.0............... 0.................. 0.0............... 0................. 0.0........ 0................ 0.0............. 0.................. 0.0............. 0................... 0.0................ 0................. 0.0.............. 0.................. 0.0........
0................... 0.0............ 0................... 0.0....... 0.................. 0.0............... 0.................. 0.0............... 0................. 0.0........ 0................ 0.0............. 0.................. 0.0............. 0................... 0.0................ 0................. 0.0.............. 0.................. 0.0........
0................... 0.0............ 0................... 0.0....... 0.................. 0.0............... 0.................. 0.0............... 0................. 0.0........ 0................ 0.0............. 0.................. 0.0............. 0................... 0.0................ 0................. 0.0.............. 0.................. 0.0........
867............... 19.5.......... 130............... 2.9....... 169.............. 3.8............... 298.............. 6.7............... 1................. 0.0........ (1,241)........ (27.9).......... 53................ 1.2............. (1,188)........... (26.7)............. 179............. 4.0.............. (1,009)......... (22.7).....
527............... 17.3.......... 85................. 2.8....... 193.............. 6.3............... 347.............. 11.4............. 2................. 0.1........ 528............ 17.4........... 78................ 2.6............. 607............... 20.0.............. 121............. 4.0.............. 728.............. 24.0......
283............... 17.1.......... 45................. 2.7....... 62................ 3.7............... 110.............. 6.6............... 0................. 0.0........ (165)........... (9.9)............ 196.............. 11.8........... 31................. 1.9................ 119............. 7.2.............. 150.............. 9.1........
0................... 0.0............ 0................... 0.0....... 0.................. 0.0............... 0.................. 0.0............... 0................. 0.0........ 0................ 0.0............. 0.................. 0.0............. 0................... 0.0................ 0................. 0.0.............. 0.................. 0.0........
0................... 0.0............ 0................... 0.0....... 0.................. 0.0............... 0.................. 0.0............... 0................. 0.0........ 0................ 0.0............. 0.................. 0.0............. 0................... 0.0................ 0................. 0.0.............. 0.................. 0.0........
0................... 0.0............ 0................... 0.0....... 0.................. 0.0............... 0.................. 0.0............... 0................. 0.0........ 0................ 0.0............. 0.................. 0.0............. 0................... 0.0................ 0................. 0.0.............. 0.................. 0.0........
0................... 0.0............ 0................... 0.0....... 0.................. 0.0............... 0.................. 0.0............... 0................. 0.0........ 0................ 0.0............. 0.................. 0.0............. 0................... 0.0................ 0................. 0.0.............. 0.................. 0.0........
0................... 0.0............ 0................... 0.0....... 0.................. 0.0............... 0.................. 0.0............... 0................. 0.0........ 0................ 0.0............. 0.................. 0.0............. 0................... 0.0................ 0................. 0.0.............. 0.................. 0.0........
0................... 0.0............ 0................... 0.0....... 0.................. 0.0............... 0.................. 0.0............... 0................. 0.0........ 0................ 0.0............. 0.................. 0.0............. 0................... 0.0................ 0................. 0.0.............. 0.................. 0.0........
0................... 0.0............ 0................... 0.0....... 0.................. 0.0............... 0.................. 0.0............... 0................. 0.0........ 0................ 0.0............. 0.................. 0.0............. 0................... 0.0................ 0................. 0.0.............. 0.................. 0.0........
0................... 0.0............ 0................... 0.0....... 0.................. 0.0............... 0.................. 0.0............... 0................. 0.0........ 0................ 0.0............. 0.................. 0.0............. 0................... 0.0................ 0................. 0.0.............. 0.................. 0.0........
0................... 0.0............ 0................... 0.0....... 0.................. 0.0............... 0.................. 0.0............... 0................. 0.0........ 0................ 0.0............. 0.................. 0.0............. 0................... 0.0................ 0................. 0.0.............. 0.................. 0.0........
350............... 8.9............ 242............... 6.1....... 159.............. 4.0............... 282.............. 7.2............... (26).............. (0.7)....... 2,129......... 54.0........... 835.............. 21.2........... 2,964............ 75.2.............. 405............. 10.3............ 3,369........... 85.4......
482............... 13.6.......... 81................. 2.3....... 224.............. 6.3............... 399.............. 11.3............. 31............... 0.9........ (2,500)........ (70.5).......... 1,030........... 29.0........... (1,470)........... (41.4)............. 469............. 13.2............ (1,001)......... (28.2).....
0................... 0.0............ 0................... 0.0....... 0.................. 0.0............... 0.................. 0.0............... 0................. 0.0........ 0................ 0.0............. 0.................. 0.0............. 0................... 0.0................ 0................. 0.0.............. 0.................. 0.0........
0................... 0.0............ 0................... 0.0....... 0.................. 0.0............... 0.................. 0.0............... 0................. 0.0........ 0................ 0.0............. 0.................. 0.0............. 0................... 0.0................ 0................. 0.0.............. 0.................. 0.0........
0................... 0.0............ 0................... 0.0....... 0.................. 0.0............... 0.................. 0.0............... 0................. 0.0........ 0................ 0.0............. 0.................. 0.0............. 0................... 0.0................ 0................. 0.0.............. 0.................. 0.0........
414............... 15.2.......... 71................. 2.6....... 132.............. 4.8............... 235.............. 8.6............... 0................. 0.0........ (236)........... (8.6)............ 134.............. 4.9............. (102).............. (3.7)............... 120............. 4.4.............. 18................ 0.6........
328............... 14.8.......... 62................. 2.8....... 115.............. 5.2............... 204.............. 9.2............... 2................. 0.1........ (191)........... (8.6)............ 169.............. 7.6............. (22)................ (1.0)............... 130............. 5.8.............. 108.............. 4.9........
245............... 15.2.......... 39................. 2.4....... 82................ 5.1............... 146.............. 9.0............... 0................. 0.0........ (176)........... (10.8).......... 8.................. 0.5............. (168).............. (10.3)............. 46............... 2.8.............. (121)............ (7.4).......
100............... 15.5.......... 19................. 2.9....... 30................ 4.6............... 53................ 8.2............... 1................. 0.2........ (80)............. (12.4).......... 12................ 1.8............. (69)................ (10.6)............. 25............... 3.9.............. (44).............. (6.8).......
0................... 0.0............ 0................... 0.0....... 0.................. 0.0............... 0.................. 0.0............... 0................. 0.0........ 0................ 0.0............. 0.................. 0.0............. 0................... 0.0................ 0................. 0.0.............. 0.................. 0.0........
14................. 9.9............ 5................... 3.5....... 12................ 8.5............... 21................ 14.9............. 13............... 9.2........ (176)........... (125.1)........ 38................ 26.7........... (139).............. (98.5)............. 17............... 12.3............ (121)............ (86.2).....
0................... 0.0............ 0................... 0.0....... 0.................. 0.0............... 0.................. 0.0............... 0................. 0.0........ 0................ 0.0............. 0.................. 0.0............. 0................... 0.0................ 0................. 0.0.............. 0.................. 0.0........
0................... 0.0............ 0................... 0.0....... 0.................. 0.0............... 0.................. 0.0............... 0................. 0.0........ 0................ 0.0............. 0.................. 0.0............. 0................... 0.0................ 0................. 0.0.............. 0.................. 0.0........
0................... 0.0............ 0................... 0.0....... 0.................. 0.0............... 0.................. 0.0............... 0................. 0.0........ 0................ 0.0............. 0.................. 0.0............. 0................... 0.0................ 0................. 0.0.............. 0.................. 0.0........
0................... 0.0............ 0................... 0.0....... 0.................. 0.0............... 0.................. 0.0............... 0................. 0.0........ 0................ 0.0............. 0.................. 0.0............. 0................... 0.0................ 0................. 0.0.............. 0.................. 0.0........
0................... 0.0............ 0................... 0.0....... 0.................. 0.0............... 0.................. 0.0............... 0................. 0.0........ 0................ 0.0............. 0.................. 0.0............. 0................... 0.0................ 0................. 0.0.............. 0.................. 0.0........
0................... 0.0............ 0................... 0.0....... 0.................. 0.0............... 0.................. 0.0............... 0................. 0.0........ 0................ 0.0............. 0.................. 0.0............. 0................... 0.0................ 0................. 0.0.............. 0.................. 0.0........
0................... 0.0............ 0................... 0.0....... 0.................. 0.0............... 0.................. 0.0............... 0................. 0.0........ 0................ 0.0............. 0.................. 0.0............. 0................... 0.0................ 0................. 0.0.............. 0.................. 0.0........
0................... 0.0............ 0................... 0.0....... 0.................. 0.0............... 0.................. 0.0............... 0................. 0.0........ 0................ 0.0............. 0.................. 0.0............. 0................... 0.0................ 0................. 0.0.............. 0.................. 0.0........
4,055 15.3.......... 860 3.2....... 1,283 4.8............... 2,285 8.6............... 33 0.1........ (2,147) (8.1)............ 2,663 10.0........... 516 1.9................ 1,741 6.6.............. 2,257 8.5........
INSURANCE EXPENSE EXHIBIT FOR THE YEAR 2018 OF THE FICTITIOUS INSURANCE COMPANY
Supp 03
PART II - ALLOCATION TO LINES OF BUSINESS NET OF REINSURANCE (Continued)
PREMIUMS, LOSSES, EXPENSES, RESERVES AND PROFITS AND PERCENTAGES TO PREMIUMS EARNED FOR BUSINESS NET OF REINSURANCE (000 Omitted)

Premiums Written
(Pg. 8, Pt. 1B, Col. 1)
Premiums Earned
(Sch. T, Line 59, Col. 3) Dividends to Policyholders
Incurred Loss
(Sch. T, Line 59, Col. 6)
Defense and Cost
Containment Expenses
Incurred
Adjusting and Other
Expenses Incurred
Unpaid Losses
(Sch. T, Line 59, Col.
7)
Defense and Cost
Containment Expenses
Unpaid
Adjusting and Other
Expenses Unpaid
Unearned Premium
Reserves
1
Amount
2
%
3
Amount
4
%
5
Amount
6
%
7
Amount
8
%
9
Amount
10
%
11
Amount
12
%
13
Amount
14
%
15
Amount
16
%
17
Amount
18
%
19
Amount
20
%
21
Amount
22
%
1.
Fire................................................................................ 3,254.......... ….XXX..... 3,275.......... 100.0......... 1.................. 0.0............... 1,451.......... 44.3............ 52............... 1.6.............. 37............... 1.1........ 1,627.......... 49.7....... 103............. 3.1.......... 131............. 4.0........ 1,478.......... 45.1...... 385............. 11.8......
2.1 Allied Lines.................................................................... 0................. ….XXX..... 0................. 100.0......... 0.................. 0.0............... 0................. 0.0.............. 0................. 0.0.............. 0................. 0.0........ 0................. 0.0......... 0................. 0.0.......... 0................. 0.0........ 0................. 0.0........ 0................. 0.0........
2.2 Multiple Peril Crop......................................................... 0................. ….XXX..... 0................. 100.0......... 0.................. 0.0............... 0................. 0.0.............. 0................. 0.0.............. 0................. 0.0........ 0................. 0.0......... 0................. 0.0.......... 0................. 0.0........ 0................. 0.0........ 0................. 0.0........
2.3 Federal Flood................................................................ 0................. ….XXX..... 0................. 100.0......... 0.................. 0.0............... 0................. 0.0.............. 0................. 0.0.............. 0................. 0.0........ 0................. 0.0......... 0................. 0.0.......... 0................. 0.0........ 0................. 0.0........ 0................. 0.0........
3.
Farmowners Multiple Peril............................................ 0................. ….XXX..... 0................. 100.0......... 0.................. 0.0............... 0................. 0.0.............. 0................. 0.0.............. 0................. 0.0........ 0................. 0.0......... 0................. 0.0.......... 0................. 0.0........ 0................. 0.0........ 0................. 0.0........
4.
Homeowners Multiple Peril........................................... 4,646.......... ….XXX..... 4,550.......... 100.0......... 0.................. 0.0............... 3,801.......... 83.5............ 73............... 1.6.............. 453............. 8.1........ 1,326.......... 29.1....... 57............... 1.5.......... 89............... 2.0........ 2,457.......... 54.0...... 1,901.......... 41.8......
5.1 Commercial Multiple Peril (Non-Liability Portion)......... 3,243.......... ….XXX..... 3,264.......... 100.0......... (0)................. (0.0)............. 1,511.......... 46.3............ 83............... 2.5.............. 35............... 1.1........ 3,509.......... 107.5..... 93............... 2.8.......... 107............. 3.3........ 1,474.......... 45.1...... 606............. 18.6......
5.2 Commercial Multiple Peril (Liability Portion)................. 1,760.......... ….XXX..... 1,771.......... 100.0......... 0.................. 0.0............... 765............. 43.2............ 319............. 18.0............ 12............... 0.7........ 312............. 17.6....... 1,147.......... 64.8........ 260............. 14.7...... 796............. 45.0...... 447............. 25.2......
6.
Mortgage Guaranty....................................................... 0................. ….XXX..... 0................. 100.0......... 0.................. 0.0............... 0................. 0.0.............. 0................. 0.0.............. 0................. 0.0........ 0................. 0.0......... 0................. 0.0.......... 0................. 0.0........ 0................. 0.0........ 0................. 0.0........
8.
Ocean Marine............................................................... 0................. ….XXX..... 0................. 100.0......... 0.................. 0.0............... 0................. 0.0.............. 0................. 0.0.............. 0................. 0.0........ 0................. 0.0......... 0................. 0.0.......... 0................. 0.0........ 0................. 0.0........ 0................. 0.0........
9.
Inland Marine................................................................ 0................. ….XXX..... 0................. 100.0......... 0.................. 0.0............... 0................. 0.0.............. 0................. 0.0.............. 0................. 0.0........ 0................. 0.0......... 0................. 0.0.......... 0................. 0.0........ 0................. 0.0........ 0................. 0.0........
10.
Financial Guaranty........................................................ 0................. ….XXX..... 0................. 100.0......... 0.................. 0.0............... 0................. 0.0.............. 0................. 0.0.............. 0................. 0.0........ 0................. 0.0......... 0................. 0.0.......... 0................. 0.0........ 0................. 0.0........ 0................. 0.0........
11.
Medical Professional Liability....................................... 0................. ….XXX..... 0................. 100.0......... 0.................. 0.0............... 0................. 0.0.............. 0................. 0.0.............. 0................. 0.0........ 0................. 0.0......... 0................. 0.0.......... 0................. 0.0........ 0................. 0.0........ 0................. 0.0........
12.
Earthquake.................................................................... 0................. ….XXX..... 0................. 100.0......... 0.................. 0.0............... 0................. 0.0.............. 0................. 0.0.............. 0................. 0.0........ 0................. 0.0......... 0................. 0.0.......... 0................. 0.0........ 0................. 0.0........ 0................. 0.0........
13.
Group A&H (See Interrogatory 1)................................. 0................. ….XXX..... 0................. 100.0......... 0.................. 0.0............... 0................. 0.0.............. 0................. 0.0.............. 0................. 0.0........ 0................. 0.0......... 0................. 0.0.......... 0................. 0.0........ 0................. 0.0........ 0................. 0.0........
14.
Credit A & H.................................................................. 0................. ….XXX..... 0................. 100.0......... 0.................. 0.0............... 0................. 0.0.............. 0................. 0.0.............. 0................. 0.0........ 0................. 0.0......... 0................. 0.0.......... 0................. 0.0........ 0................. 0.0........ 0................. 0.0........
15.
Other A&H (See Interrogatory 1).................................. 0................. ….XXX..... 0................. 100.0......... 0.................. 0.0............... 0................. 0.0.............. 0................. 0.0.............. 0................. 0.0........ 0................. 0.0......... 0................. 0.0.......... 0................. 0.0........ 0................. 0.0........ 0................. 0.0........
16.
Workers' Compensation............................................... 4,394.......... ….XXX..... 4,421.......... 100.0......... 42................ 1.0............... 2,114.......... 47.8............ 432............. 9.8.............. (9)................ (0.2)....... 15,995....... 361.8..... 1,836.......... 41.5........ 477............. 10.8...... 1,704.......... 38.5...... 1,282.......... 29.0......
17.1 Other Liability - Occurrence.......................................... 3,749.......... ….XXX..... 3,773.......... 100.0......... 1.................. 0.0............... 764............. 20.3............ 490............. 13.0............ 87............... 2.3........ 21,058....... 558.1..... 3,866.......... 102.5..... 1,180.......... 31.3...... 1,753.......... 46.5...... 785............. 20.8......
17.2 Other Liability - Claims-made....................................... 0................. ….XXX..... 0................. 100.0......... 0.................. 0.0............... 0................. 0.0.............. 0................. 0.0.............. 0................. 0.0........ 0................. 0.0......... 0................. 0.0.......... 0................. 0.0........ 0................. 0.0........ 0................. 0.0........
17.3 Excess Workers' Compensation.................................. 0................. ….XXX..... 0................. 100.0......... 0.................. 0.0............... 0................. 0.0.............. 0................. 0.0.............. 0................. 0.0........ 0................. 0.0......... 0................. 0.0.......... 0................. 0.0........ 0................. 0.0........ 0................. 0.0........
18.
Products Liability........................................................... 0................. ….XXX..... 0................. 100.0......... 0.................. 0.0............... 0................. 0.0.............. 0................. 0.0.............. 0................. 0.0........ 0................. 0.0......... 0................. 0.0.......... 0................. 0.0........ 0................. 0.0........ 0................. 0.0........
19.1,19.2 Private Passenger Auto Liability................................... 2,804.......... ….XXX..... 2,822.......... 100.0......... 0.................. 0.0............... 2,362.......... 83.7............ 78............... 2.8.............. 406............. 14.4...... 2,744.......... 97.2....... 244............. 8.6.......... 161............. 5.7........ 985............. 34.9...... 475............. 16.8......
19.3,19.4 Commercial Auto Liability............................................. 2,334.......... ….XXX..... 2,305.......... 100.0......... 1.................. 0.0............... 4,222.......... 183.2.......... 130............. 5.6.............. 302............. 13.1...... 3,409.......... 147.9..... 349............. 15.1........ 156............. 6.8........ 1,052.......... 45.6...... 758............. 32.9......
21.1 Private Passenger Auto Physical Damage.................. 1,661.......... ….XXX..... 1,636.......... 100.0......... 0.................. 0.0............... 1,112.......... 66.3............ 11............... 0.1.............. 198............. 13.7...... 36............... 2.2......... 15............... 0.1.......... 25............... 1.2........ 560............. 34.3...... 283............. 17.3......
21.2 Commercial Auto Physical Damage............................. 651............. ….XXX..... 641............. 100.0......... 0.................. 0.0............... 436............. 70.6............ 4................. 2.3.............. 78............... 8.4........ 212............. 33.1....... 6................. 7.9.......... 10............... 3.6........ 289............. 45.0...... 213............. 33.2......
22.
Aircraft (all perils).......................................................... 0................. ….XXX..... 0................. 0.0............. 0.................. 0.0............... 0................. 0.0.............. 0................. 0.0.............. 0................. 0.0........ 0................. 0.0......... 0................. 0.0.......... 0................. 0.0........ 0................. 0.0........ 0................. 0.0........
23.
Fidelity........................................................................... 138............. ….XXX..... 139............. 100.0......... 0.................. 0.3............... (5)................ (3.4)............ 13............... 9.5.............. 1................. 0.8........ 1,047.......... 753.2..... 109............. 78.2........ 4................. 2.9........ 52............... 37.6...... 37............... 26.6......
24.
Surety............................................................................ 0................. ….XXX..... 0................. 100.0......... 0.................. 0.0............... 0................. 0.0.............. 0................. 0.0.............. 0................. 0.0........ 0................. 0.0......... 0................. 0.0.......... 0................. 0.0........ 0................. 0.0........ 0................. 0.0........
26.
Burglary and Theft........................................................ 0................. ….XXX..... 0................. 100.0......... 0.................. 0.0............... 0................. 0.0.............. 0................. 0.0.............. 0................. 0.0........ 0................. 0.0......... 0................. 0.0.......... 0................. 0.0........ 0................. 0.0........ 0................. 0.0........
27.
Boiler and Machinery.................................................... 0................. ….XXX..... 0................. 100.0......... 0.................. 0.0............... 0................. 0.0.............. 0................. 0.0.............. 0................. 0.0........ 0................. 0.0......... 0................. 0.0.......... 0................. 0.0........ 0................. 0.0........ 0................. 0.0........
28.
Credit............................................................................. 0................. ….XXX..... 0................. 100.0......... 0.................. 0.0............... 0................. 0.0.............. 0................. 0.0.............. 0................. 0.0........ 0................. 0.0......... 0................. 0.0.......... 0................. 0.0........ 0................. 0.0........ 0................. 0.0........
29.
International................................................................... 0................. ….XXX..... 0................. 100.0......... 0.................. 0.0............... 0................. 0.0.............. 0................. 0.0.............. 0................. 0.0........ 0................. 0.0......... 0................. 0.0.......... 0................. 0.0........ 0................. 0.0........ 0................. 0.0........
30.
Warranty....................................................................... 0................. ….XXX..... 0................. 100.0......... 0.................. 0.0............... 0................. 0.0.............. 0................. 0.0.............. 0................. 0.0........ 0................. 0.0......... 0................. 0.0.......... 0................. 0.0........ 0................. 0.0........ 0................. 0.0........
34.
Aggregate write-ins for Other
Lines of Business.......................................................... 0................. ….XXX..... 0................. 100.0......... 0.................. 0.0............... 0................. 0.0.............. 0................. 0.0.............. 0................. 0.0........ 0................. 0.0......... 0................. 0.0.......... 0................. 0.0........ 0................. 0.0........ 0................. 0.0........
35.
TOTALS (Lines 1 through 34)
28,634
XXX
28,597
100.0
46
0.0
18,533
64.8
1,685
5.9
1,600
5.6
51,275
179.3
7,825
27.4
2,599
9.1
12,601
44.1
7,172
25.1
INSURANCE EXPENSE EXHIBIT FOR THE YEAR 2018 OF THE FICTITIOUS INSURANCE COMPANY
Loss Adjustment ExpenseLoss Adjustment Expense
Agents' Balances
Supp 04
PART III - ALLOCATION TO LINES OF DIRECT BUSINESS WRITTEN
PREMIUMS, LOSSES, EXPENSES, RESERVES AND PROFITS AND PERCENTAGES TO PREMIUMS EARNED FOR DIRECT BUSINESS WRITTEN (000 Omitted)

Commission and Brokerage
Expenses Incurred
Taxes, Licenses & Fees
Incurred
Other Acquisitions, Field
Supervision, and Collection
Expenses Incurred General Expenses Incurred
Other Income Less Other
Expenses
Pre-Tax Profit or Loss
Excluding All Investment
23
Amount
24
%
25
Amount
26
%
27
Amount
28
%
29
Amount
30
%
31
Amount
32
%
33
Amount
34
%
1.
Fire..................................................................................... 536................ 17.7............. 81.................. 2.5............. 105.................... 3.2.............. 190.................. 5.8................... 9.................. 0.3.............. 832................ 25.4...............
2.1 Allied Lines........................................................................ 0.................... 0.0............... 0.................... 0.0............. 0........................ 0.0.............. 0...................... 0.0................... 0.................. 0.0.............. 0.................... 0.0.................
2.2 Multiple Peril Crop............................................................. 0.................... 0.0............... 0.................... 0.0............. 0........................ 0.0.............. 0...................... 0.0................... 0.................. 0.0.............. 0.................... 0.0.................
2.3 Federal Flood.................................................................... 0.................... 0.0............... 0.................... 0.0............. 0........................ 0.0.............. 0...................... 0.0................... 0.................. 0.0.............. 0.................... 0.0.................
3.
Farmowners Multiple Peril................................................. 0.................... 0.0............... 0.................... 0.0............. 0........................ 0.0.............. 0...................... 0.0................... 0.................. 0.0.............. 0.................... 0.0.................
4.
Homeowners Multiple Peril............................................... 1,043............. 19.5............. 130................ 2.9............. 169.................... 3.7.............. 298.................. 6.5................... 1.................. 0.0.............. (1,416)............ (31.1)..............
5.1 Commercial Multiple Peril (Non-Liability Portion)............. 634................ 17.3............. 85.................. 2.6............. 193.................... 5.9.............. 347.................. 10.6................. 2.................. 0.1.............. 378................ 11.6...............
5.2 Commercial Multiple Peril (Liability Portion)..................... 341................ 17.1............. 45.................. 2.5............. 62...................... 3.5.............. 110.................. 6.2................... 0.................. 0.0.............. 118................ 6.6.................
6.
Mortgage Guaranty............................................................ 0.................... 0.0............... 0.................... 0.0............. 0........................ 0.0.............. 0...................... 0.0................... 0.................. 0.0.............. 0.................... 0.0.................
8.
Ocean Marine.................................................................... 0.................... 0.0............... 0.................... 0.0............. 0........................ 0.0.............. 0...................... 0.0................... 0.................. 0.0.............. 0.................... 0.0.................
9.
Inland Marine..................................................................... 0.................... 0.0............... 0.................... 0.0............. 0........................ 0.0.............. 0...................... 0.0................... 0.................. 0.0.............. 0.................... 0.0.................
10.
Financial Guaranty............................................................ 0.................... 0.0............... 0.................... 0.0............. 0........................ 0.0.............. 0...................... 0.0................... 0.................. 0.0.............. 0.................... 0.0.................
11.
Medical Professional Liability............................................ 0.................... 0.0............... 0.................... 0.0............. 0........................ 0.0.............. 0...................... 0.0................... 0.................. 0.0.............. 0.................... 0.0.................
12.
Earthquake........................................................................ 0.................... 0.0............... 0.................... 0.0............. 0........................ 0.0.............. 0...................... 0.0................... 0.................. 0.0.............. 0.................... 0.0.................
13.
Group A&H (See Interrogatory 1)..................................... 0.................... 0.0............... 0.................... 0.0............. 0........................ 0.0.............. 0...................... 0.0................... 0.................. 0.0.............. 0.................... 0.0.................
14.
Credit A & H....................................................................... 0.................... 0.0............... 0.................... 0.0............. 0........................ 0.0.............. 0...................... 0.0................... 0.................. 0.0.............. 0.................... 0.0.................
15.
Other A&H (See Interrogatory 1)...................................... 0.................... 0.0............... 0.................... 0.0............. 0........................ 0.0.............. 0...................... 0.0................... 0.................. 0.0.............. 0.................... 0.0.................
16.
Workers' Compensation.................................................... 421................ 8.9............... 242................ 5.5............. 159.................... 3.6.............. 282.................. 6.4................... (26).............. (0.6)............ 712................ 16.1...............
17.1 Other Liability - Occurrence............................................... 580................ 13.6............. 81.................. 2.1............. 224.................... 5.9.............. 399.................. 10.6................. 31................ 0.8.............. 1,177............. 31.2...............
17.2 Other Liability - Claims-made............................................ 0.................... 0.0............... 0.................... 0.0............. 0........................ 0.0.............. 0...................... 0.0................... 0.................. 0.0.............. 0.................... 0.0.................
17.3 Excess Workers' Compensation....................................... 0.................... 0.0............... 0.................... 0.0............. 0........................ 0.0.............. 0...................... 0.0................... 0.................. 0.0.............. 0.................... 0.0.................
18.
Products Liability............................................................... 0.................... 0.0............... 0.................... 0.0............. 0........................ 0.0.............. 0...................... 0.0................... 0.................. 0.0.............. 0.................... 0.0.................
19.1,19.2 Private Passenger Auto Liability....................................... 498................ 15.2............. 71.................. 2.5............. 132.................... 4.7.............. 235.................. 8.3................... 0.................. 0.0.............. (960)............... (34.0)..............
19.3,19.4 Commercial Auto Liability.................................................. 395................ 14.8............. 62.................. 2.7............. 115.................... 5.0.............. 204.................. 8.9................... 2.................. 0.1.............. (3,124)............ (135.5)............
21.1 Private Passenger Auto Physical Damage....................... 295................ 15.2............. 39.................. 2.4............. 82...................... 5.1.............. 146.................. 9.0................... 0.................. 0.0.............. (247)............... (15.1)..............
21.2 Commercial Auto Physical Damage................................. 120................ 15.5............. 19.................. 2.9............. 30...................... 4.6.............. 53.................... 8.2................... 1.................. 0.2.............. (98)................. (15.3)..............
22.
Aircraft (all perils)............................................................... 0.................... 0.0............... 0.................... 0.0............. 0........................ 0.0.............. 0...................... 0.0................... 0.................. 0.0.............. 0.................... 0.0.................
23.
Fidelity................................................................................ 17.................. 9.9............... 5.................... 3.6............. 12...................... 8.6.............. 21.................... 15.1................. 13................ 9.4.............. 87.................. 62.6...............
24.
Surety................................................................................. 0.................... 0.0............... 0.................... 0.0............. 0........................ 0.0.............. 0...................... 0.0................... 0.................. 0.0.............. 0.................... 0.0.................
26.
Burglary and Theft............................................................. 0.................... 0.0............... 0.................... 0.0............. 0........................ 0.0.............. 0...................... 0.0................... 0.................. 0.0.............. 0.................... 0.0.................
27.
Boiler and Machinery......................................................... 0.................... 0.0............... 0.................... 0.0............. 0........................ 0.0.............. 0...................... 0.0................... 0.................. 0.0.............. 0.................... 0.0.................
28.
Credit................................................................................. 0.................... 0.0............... 0.................... 0.0............. 0........................ 0.0.............. 0...................... 0.0................... 0.................. 0.0.............. 0.................... 0.0.................
29.
International....................................................................... 0.................... 0.0............... 0.................... 0.0............. 0........................ 0.0.............. 0...................... 0.0................... 0.................. 0.0.............. 0.................... 0.0.................
30.
Warranty............................................................................ 0.................... 0.0............... 0.................... 0.0............. 0........................ 0.0.............. 0...................... 0.0................... 0.................. 0.0.............. 0.................... 0.0.................
34.
Aggregate write-ins for Other
Lines of Business.............................................................. 0.................... 0.0............... 0.................... 0.0............. 0........................ 0.0.............. 0...................... 0.0................... 0.................. 0.0.............. 0.................... 0.0.................
35.
TOTALS (Lines 1 through 34)
4,880
17.1
860
3.0
1,283
4.5
2,285
8.0
33
0.1
(2,542)
(8.9)
INSURANCE EXPENSE EXHIBIT FOR THE YEAR 2018 OF THE FICTITIOUS INSURANCE COMPANY
Supp 04
PART III - ALLOCATION TO LINES OF DIRECT BUSINESS WRITTEN (Continued)
PREMIUMS, LOSSES, EXPENSES, RESERVES AND PROFITS AND PERCENTAGES TO PREMIUMS EARNED FOR DIRECT BUSINESS WRITTEN (000 Omitted)

FINANCIAL REPORTING THROUGH THE LENS OF A PROPERTY/CASUALTY ACTUARY
Appendix I. Fictitious Insurance Company
Page 1 of 8
2018 STATEMENT OF ACTUARIAL OPINION FOR FICTITIOUS INSURANCE
COMPANY
STATEMENT OF ACTUARIAL OPINION
Fictitious Insurance Company
IDENTIFICATION
I, William H. Smith, am a Fellow of the Casualty Actuarial Society, member of the American
Academy of Actuaries, and am associated with the firm of WS Actuarial Consulting. I meet the
qualification standards of the American Academy of Actuaries for Statements of Actuarial
Opinion for the Property and Casualty (“P&C”) Annual Statement.
I was appointed by the Board of Directors of Fictitious Insurance Company (“the Company”)
on September 7, 2018, to provide this opinion for purposes of satisfying the requirements of
the NAIC Annual Statement Instructions Property/Casualty. The intended users of this opinion
are Company management, its Board of Directors and state insurance department regulators.
SCOPE
I have reviewed the December 31, 2018, loss and loss adjustment expense reserves recorded
under U.S. Statutory Accounting Principles, listed in Exhibit A and included in the 2018
Statutory Annual Statement of the Company as filed with the respective state insurance
departments. Those loss and loss adjustment expense reserves are the responsibility of the
Company’s management; my responsibility is to express an opinion on those loss and loss
adjustment expense reserves based on my review.
My review of the Company’s reserves included the use of such actuarial assumptions and
methods and such tests of the actuarial calculations as I considered necessary in the
circumstances and was conducted in accordance with standards and principles established by
the Actuarial Standards Board. My review considered information provided to me through
January 28, 2019.
The reserves listed in Exhibit A, where applicable, include provisions for disclosure items
(disclosures 8 through 13) in Exhibit B.
In my review, I have relied on data and other relevant information, prepared by John J.
Hoffman, Vice President and Controller of the Company. I evaluated that data for
reasonableness and consistency. I also reconciled that data to Schedule P, Part 1 of the
Company’s 2018 Annual Statement.
I have not reviewed the Company’s unearned premium reserves, nor have I performed any
analysis to determine whether a premium deficiency reserve is needed to supplement the
unearned premium reserves reported by the Company.

FINANCIAL REPORTING THROUGH THE LENS OF A PROPERTY/CASUALTY ACTUARY
Appendix I. Fictitious Insurance Company
Page 2 of 8
I have not reviewed any of the Company’s assets, nor have I formed any opinion as to their
validity or value; the following opinion is based on the assumption that the Company’s
December 31, 2018, statutory-basis reserves identified herein are funded by valid assets that
have suitably scheduled maturities and/or adequate liquidity to meet cash flow requirements.
OPINION
In my opinion, the amounts carried in Exhibit A on account of the items identified:
• Make a reasonable provision for all unpaid losses and loss adjustment expenses, gross
and net as to reinsurance ceded, under the terms of the Company’s contracts and
agreements.
• Are computed in accordance with accepted standards and principles.
• Meet the requirements of the insurance laws of Florida.
RELEVANT COMMENTS
Materiality standard
In order to establish my materiality standard, for purposes of addressing the risk of material
adverse deviation of the Company’s reserves for unpaid losses and loss adjustment expenses,
I have considered the following amounts:
1. 10% of the Company’s net loss + loss adjustment expense reserves (10% of
Exhibit A, Item 1. + Item 2.) at December 31, 2018
$5,155,700
2.
20% of the Company’s surplus at December 31, 201
8
$6,204,800
3.
The difference between th
e Company’s surplus at Decem
ber
31, 201
8,
and
the company action level based on the NAIC’s Risk-Based Capital formula
$
19,848,
000
My materiality standard, for purposes of preparing the analysis in support of this Statement
of Actuarial Opinion, was established at $5,155,700, which is the smallest of the foregoing
amounts.
Risk of material adverse deviation
I have identified the major risk factors for this company as: mass tort claims; construction
defect claims; so-called “Chinese drywall” claims; cumulative injury losses; claims from large
deductible workers’ compensation policies; and claims related to catastrophic weather events.

FINANCIAL REPORTING THROUGH THE LENS OF A PROPERTY/CASUALTY ACTUARY
Appendix I. Fictitious Insurance Company
Page 3 of 8
In my analysis I have considered these risk factors and the implications of uncertainty in
estimates of unpaid losses and loss adjustment expenses in determining my range of
reasonable estimates. I also observed that the difference between the Company’s carried
reserves for losses and loss adjustment expenses and the higher end of my range of
reasonable unpaid claim estimates is greater than my materiality standard.
In light of the materiality considerations within this analysis, and after considering the
potential risks and uncertainties that could bear on the Company’s reserve development, I
concluded that there are significant risks and uncertainties that could result in material
adverse deviation of the Company’s carried reserves for unpaid losses and loss adjustment
expenses as of December 31, 2018.
These risk factors are described in more detail in the following paragraphs and in the report
supporting this opinion.
Mass Torts
The Company has exposure to mass tort claims such as those involving asbestos and
environmental impairment liability. The Company’s management has indicated that case-basis
loss and allocated loss adjustment expense reserves for such claims are established as claims
are reported. Additional reserves for such claims are established by the Company’s
management to include the potential for future development of those claims and the
reporting of latent claims. Estimation of ultimate liabilities for those types of claims is
unusually difficult due to such outstanding issues as whether coverage exists, definition of an
occurrence, determination of ultimate damages, and allocation of such damages to financially
responsible parties. The Company’s net reserves for these mass tort claims totaling
$3,739,000, which are included in the amounts listed in Exhibit A, are subject to greater
inherent uncertainty than are estimates of the remainder of the Company’s loss and loss
adjustment expense liabilities.
Other losses and/or risk factors subject to greater inherent uncertainty
Additionally, at December 31, 2018, the Company has characterized construction defect
claims; so-called “Chinese drywall” claims; cumulative injury losses; claims from large
deductible workers’ compensation policies; and claims related to catastrophic weather events,
including wildfires tornadoes and hurricanes, as types of losses subject to greater inherent
uncertainty than are estimates for the remainder of the Company’s loss and loss adjustment
expense liabilities due to pending legal interpretation, coverage disputes, length of the
expected settlement pattern and high excess attachment levels. The absence of other types
of losses and risk factors from this paragraph does not imply that additional factors will not be
identified in the future as having contributed to significant uncertainty in the Company’s
estimates of unpaid losses and loss adjustment expenses.

FINANCIAL REPORTING THROUGH THE LENS OF A PROPERTY/CASUALTY ACTUARY
Appendix I. Fictitious Insurance Company
Page 4 of 8
Anticipated salvage and subrogation
The Company’s management has informed me that the reserves listed in Exhibit A provide for
anticipated salvage and subrogation.
Discounting
Except for tabular discount for workers’ compensation and other liability, the Company’s
management has informed me that it does not discount its reserves for unpaid losses and loss
adjustment expenses.
Pools and associations
The company does not participate in any voluntary and involuntary underwriting pools or
associations.
Retroactive or financial reinsurance
I have been informed by the Company’s management that it is not aware of any reinsurance
contract that either has been or should have been accounted for as retroactive reinsurance or
financial reinsurance.
Uncollectible reinsurance
I have been informed by the Company's management that it is not aware of any significant
uncollectible reinsurance. In my review, I have requested information from management on
uncollectible reinsurance, reviewed the latest available financial ratings of reinsurers by a
recognized rating service and reviewed Schedule F for indications of regulatory actions or
reinsurance recoverables on paid losses over 90 days past due. The majority of the
Company’s ceded loss reserves are with reinsurance companies rated A or better by A.M.
Best Company. Past uncollectability levels and current amounts in dispute have been
reviewed and found to be immaterial relative to surplus. Therefore, reinsurance collectability
does not appear to be an issue. I express no opinion on the financial condition of the
Company’s reinsurers.
IRIS Ratios
I have reviewed the Company’s calculations of the National Association of Insurance
Commissioners’ Insurance Regulatory Information System (IRIS) tests that relate to the
Company’s December 31, 2018, loss and loss adjustment expense reserves (Test 11, One-
Year Reserve Development to Surplus; Test 12, Two-Year Reserve Development to Surplus;
and Test 13, Estimated Current Reserve Deficiency to Surplus). No exceptional values were
noted with respect to the Company’s December 31, 2018, loss and loss adjustment expense
reserve tests.

FINANCIAL REPORTING THROUGH THE LENS OF A PROPERTY/CASUALTY ACTUARY
Appendix I. Fictitious Insurance Company
Page 5 of 8
Extended reporting endorsements
According to management, the Company has no exposure to medical professional liability
extended reporting endorsements, such as those relating to death, disability or retirement.
P&C Long Duration Contracts
Excluding financial guaranty contracts, mortgage guaranty policies and surety contracts, the
Company’s management has informed me that the Company does not write policies with
coverage periods of 13 months or greater that are non-cancelable and not subject to
premium increase.
Accident & Health (“A&H”) Long Duration Contracts
The Company’s management has informed me that the Company does not write A&H policies
with contract terms of thirteen months and for which contract reserves are required.
* * *
An actuarial report supporting this actuarial opinion is to be provided to the Company to be
retained for a period of seven years at its administrative offices and to be available for
regulatory examination.
(Signature of William H. Smith)
William H. Smith, FCAS, MAAA
777 Seventh Avenue
Sunny City, Florida 33585
+1 305 555-5555
william.smith@wsactuarialconsulting.com
February 24, 2019

FINANCIAL REPORTING THROUGH THE LENS OF A PROPERTY/CASUALTY ACTUARY
Appendix I. Fictitious Insurance Company
Page 6 of 8
Exhibit A: SCOPE
Loss and Loss Adjustment Expense Reserves: Amount
1.
Reserve for Unpaid Losses (Liabilities, Surplus and Other Funds page, Col 1, Line
1)
$41,894,000
2.
Reserve for Unpaid Loss Adjustment Expenses (Liabilities, Surplus and Other Funds
page, Col 1, Line 3)
$9,663,000
3.
Reserve for Unpaid Los
ses
–
Direct and Assumed (Should equal Schedule P, Part 1,
Summary, Totals from Cols. 13 and 15, Line 12 * 1000)
$51,275,000
4.
Reserve for Unpaid Loss Adjustment Expenses
–
Direct and Assumed (Should equal
Schedule P, Part 1, Summary, Totals from Cols. 17, 19 and 21, Line 12 * 1000)
$10,424,000
5.
The Page 3 write
-
in item reserve, “Retroactive Reinsurance Reserve Assumed”
$0
6.
Other Loss Reserve items on which the Appointed Actuary is expressing an Opinion (list
separately)
$0
Premium Reserves
:
7.
Reserve for Direct and Assumed Unearned Premiums for
P&C
Long Duration Contracts
$0
8.
Reserve for Net Unearned Premiums for
P&C
Long Duration Contracts
$0
9.
Other Premium Reserve items on which the
Appointed Actuary is expressing an
Opinion (list separately)
$0

FINANCIAL REPORTING THROUGH THE LENS OF A PROPERTY/CASUALTY ACTUARY
Appendix I. Fictitious Insurance Company
Page 7 of 8
Exhibit B: DISCLOSURES
1. Name of the Appointed Actuary
Last
Smith
First
William
Mid
H
2.
The Appointed Actuary’s Relationship to the
Company. Enter E or C based upon the
following:
E if an Employee of the Company or Group
C if a Consultant
C
3.
The Appointed Actuary has the following
designation (indicated by the letter code):
F if a Fellow of the Casualty Actuarial
Society (FCAS)
A if an
Associate of the Casualty Actuarial
Society (ACAS)
M if not a me
mber of the Casualty Actuarial
Society, but a Member of the American
Academy of Actuaries (MAAA) approved
by the Casualty Practice Council, as
documented with the attached approval
letter.
O for Other
F
4.
Type of Opinion, as identified in the OPIN
ION
paragraph. Enter R, I, E, Q, or N based upon
the following:
R if Reasonable
I if Inadequate or Deficient Provision
E if Excessive or Redundant Provision
Q
if Qualified. Use Q when part of the
OPINION is Qualified
N if No
Opinion
R
5.
Materiality Standard expressed in
U
.
S
.
dollars
(Used to Answer Question #6) $5,155,700
6.
Are there significant risks that could result in
Material Adverse Deviation? Yes [X ] No [ ] Not Applicable [ ]
7.
Statutory Surplus (Li
abilities, Col 1, Line 37)
$31,024,000
8.
Anticipated net salvage and subrogation
included as a reduction to loss reserves as
reported in Schedule P (should equal Part 1
Summary, Col 23, Line 12 * 1000)
$1,363,000
9.
Discount included as a reduct
ion to loss
reserves and loss expense reserves as reported
in Schedule P
9.1 Nontabular Discount [Notes, Line
32B23, (Amounts 1, 2, 3 & 4)],
Electronic Filing Cols 1, 2, 3 & 4
$0
9.2 Tabular Discount [Notes, Line
32A23 (Amounts 1 & 2)], Electronic
Filing Col 1 & 2.
$1,3
65
,000

FINANCIAL REPORTING THROUGH THE LENS OF A PROPERTY/CASUALTY ACTUARY
Appendix I. Fictitious Insurance Company
Page 8 of 8
10.
The net reserves for losses and expenses for
the Company’s share of voluntary and
involuntary underwriting pools’ and
associations’ unpaid losses and expenses that
are included in reserves shown on the
Liabilities, Surplus and Other Funds page,
Losses and Loss Adjustment Expenses lines.
$0
11.
The net reserves for losses and loss adjustment
expenses that the Company carries for the
following liabilities included on the Liabilities,
Surplus and Other Funds page, Losses and
Loss Adjustment Expenses lines.*
11.1 Asbestos, as disclosed in the
Notes to Financial Statements (Notes,
Line 33A03D, ending net asbestos
reserves for current year), Electronic
Filing Col 6
$3,28
0
,000
11.2 Environmental, as dis
closed in the
Notes to Financial Statements (Notes,
Line 33D03D, ending net
environmental reserves for current
year), Electronic Filing Col 6
$459,000
12.
The total claims made extended loss and
expense reserve (Greater than or equal to
Schedule P Interrogatories).
12.1 Amount reported as loss reserves
$0
12.2
Amount reported as unearned
premium reserves $0
13.
The net
reserves for the A&H Long Duration
Contracts that the Company carries on the
following lines on the Liabilities, Surplus and
Other Funds page:
1
3
.1
Losses
$0
1
3
.2
Loss Adjustment Expenses
$0
1
3
.
3
Unearned Premium
$0
1
3
.
4
Write
-
In (list separately, adding
additional lines as needed, and identify
(e.g., “Premium Deficiency Reserves”,
“Contract Reserves other than
Premium Deficiency Reserves” or “AG
51 Reserves”))
$0
1
4
.
Other items on which the Appointed Actuary is
providing Relevant Comment (list separately) $0
* The reserves disclosed in item 11 above, should exclude amounts relating to contracts specifically written to
cover asbestos and environmental exposures. Contracts specifically written to cover these exposures include
Environmental Impairment Liability (post 1986), Asbestos Abatement, Pollution Legal Liability, Contractor’s
Pollution Liability, Consultant’s Environmental Liability, and Pollution and Remediation Legal Liability.

FINANCIAL REPORTING THROUGH THE LENS OF A PROPERTY/CASUALTY ACTUARY
Appendix I. Fictitious Insurance Company
Page 1 of 2
2018 ACTUARIAL OPINION SUMMARY FOR FICTITIOUS INSURANCE COMPANY
ACTUARIAL OPINION SUMMARY
Fictitious Insurance Company
December 31, 2018
This Actuarial Opinion Summary has been prepared in conjunction with my role as Appointed Actuary for
Fictitious Insurance Company (“the Company”), and in accordance with the NAIC’s Annual Statement
Supplemental Filing Instructions. The information provided in this Actuarial Opinion Summary will be
included in the actuarial report in support of my Statement of Actuarial Opinion, dated February 24,
2019, on the Company’s statutory-basis loss and loss adjustment expense reserves at December 31,
2018. That actuarial report is to be provided to the Company to be retained for a period of seven years
at its administrative offices and to be available for regulatory examination.
Net Reserves (USD in 000s) Gross Reserves (USD in
000s)
Low
Point
High
Low
Point
High
A.
Actuary
’s range of reserve
estimates 43,000 57,000 52,000 68,000
B.
Actuary’s point estimate
50,000 60,000
C.
Company
carried reserves
51,557 61,699
D.
Difference between Company
carried and Actuary’s estimate
(C. - A. and C. – B., if applicable) 8,557 1,557 (5,443) 9,699 1,699 (6,301)
E. The Company has not had one-year adverse development in excess of 5% of surplus in at least three of the last
five calendar years, as measured by Schedule P, Part 2, Summary, and disclosed in the Five-Year Historical
Data, on line 74, of the Company’s December 31, 2018 statutory-basis Annual Statement.
* * *
This Actuarial Opinion Summary was prepared solely for the Company for the purpose of filing with
regulatory agencies and is not intended for any other purpose. Furthermore, it is my understanding that,
consistent with the Annual Statement Supplemental Filing Instructions, the information provided in this

FINANCIAL REPORTING THROUGH THE LENS OF A PROPERTY/CASUALTY ACTUARY
Appendix I. Fictitious Insurance Company
Page 2 of 2
Actuarial Opinion Summary will be held confidential by those regulatory agencies and will not be made
available for public inspection.
(Signature of William H. Smith)
William H. Smith, FCAS, MAAA
777 Seventh Avenue
Sunny City, Florida 33585
+1 305 555-5555
william.smith@wsactuarialconsulting.com
March 1, 2019

FINANCIAL REPORTING THROUGH THE LENS OF A PROPERTY/CASUALTY ACTUARY
Appendix I. Fictitious Insurance Company
Page 1 of 17
RESULTS OF IRIS RATIO TESTS FOR FICTITIOUS INSURANCE COMPANY
OVERVIEW
Within this section of the Appendix, we will walk through the calculation and purpose of the
13 IRIS Ratios, provide possible explanations for unusual values, and show the results of the
IRIS Ratio calculations for Fictitious Insurance Company using the 2018 Annual Statement.
IRIS Ratios are grouped into four categories:
• Overall ratios
• Profitability ratios
• Liquidity ratios
• Reserve ratios
We will present the material separately by category.
It is important to note that the calculations provided herein are based on the 2017 edition of
the National Association of Insurance Commissioners’ (NAIC) Insurance Regulatory
Information System (IRIS) Ratios Manual. Further, the ranges of “unusual values” are as
provided in the 2017 IRIS manual. The NAIC re-evaluates the reasonableness of the ranges
periodically, in light of the current environment. For example, years ago the range of “usual”
values for IRIS Ratio 6, Investment Yield, was between 5% and 10%. Compare that to the
range in 2017 of 3% to 6.5%, which reflects the current economic environment. The current
version of the IRIS manual needs to be followed when analyzing data.
OVERALL RATIOS
The overall ratios focus on the insurance company’s leverage, in terms of premium volume
relative to surplus. There are four overall ratios:
IRIS Ratio 1: Gross premiums written to policyholders’ surplus
IRIS Ratio 2: Net premiums written to policyholders’ surplus
IRIS Ratio 3: Change in net premiums written
IRIS Ratio 4: Surplus aid to policyholders’ surplus
IRIS Ratios 1 and 2 provide written premium-to-surplus ratios on a gross and net of
reinsurance basis, respectively. The denominator is the same in each of these ratios, with the
numerator differing by the amount of ceded reinsurance premium written. The source of this
data can be readily found in an insurance company’s Annual Statement, from either Part 1B
of the Underwriting and Investment Exhibit (U&IE) and the balance sheet (page 3), or Five-
Year Historical Data.
The purpose of IRIS Ratios 1 and 2 is to identify companies that may be taking on more
business and more risk than they can handle relative to their surplus. Unusual values are

FINANCIAL REPORTING THROUGH THE LENS OF A PROPERTY/CASUALTY ACTUARY
Appendix I. Fictitious Insurance Company
Page 2 of 17
greater than or equal to 900% on a gross basis and 300% on a net basis. The 300% ratio on a
net basis corresponds to the age-old generally accepted benchmark that insurers remain
within the 3-to-1 range in terms of writings relative to surplus. This ratio is higher on a gross
basis in consideration of reinsurance.
The following are examples of considerations that should be made when reviewing the results
of these ratios:
• The difference between the gross and net IRIS Ratio results:
• Wide disparity could signal heavy reliance on reinsurance or involvement in
fronting arrangements. Further investigation on the quality, rating and
collectability of the reinsurance should be made, as well as the level of
collateral held, if any. This can be accomplished through a review of the note
titled, “Reinsurance” (number 23 within the Notes to Financial Statement of
the 2018 Annual Statement), Schedule F, and research on the financial ratings
of the company’s reinsurers listed in Schedule F by a recognized rating service,
such as A.M. Best.
• This does not mean that a narrow difference between the gross and net IRIS
Ratio results should not be investigated, as it could signal inadequate levels of
reinsurance protection, in particular if the company is exposed to catastrophe
risk. Part 2 of the General Interrogatories provides information on a company’s
protection against excessive or catastrophic loss, although further inquiry
would have to be made of the company for specific details.
• The amount of the gross premiums that stem from assumed business versus business
directly written by the company:
• Companies tend to have less control over business assumed from third parties.
Those companies having a large portion of assumed business and IRIS Ratio 1
results nearing the unusual value benchmark should be subject to further
investigation. This would include an understanding of the type of business
assumed, attachment points, layers and limits of coverage, as well as the
underwriting and price monitoring controls in place on the assumed book.
• The results relative to lines of business written:
• Lower ratio results are preferred for companies writing long-tailed lines of
business due to the uncertainty inherent in the ultimate payout of associated
claims.
As displayed below, IRIS Ratios 1 and 2 can be calculated for Fictitious using data from the
Five-Year Historical Data exhibit.

FINANCIAL REPORTING THROUGH THE LENS OF A PROPERTY/CASUALTY ACTUARY
Appendix I. Fictitious Insurance Company
Page 3 of 17
Data from Fictitious Insurance Company 2018 Five-Year Historical Data (USD)
2018 2017 2016 2015 2014
6. Gross premiums written (GPW)
28,634,000
28,085,000
29,519,000
31,238,000
31,670,000
12. Net premiums written (NPW
)
26,7
52
,000
25,936,000
25,521,000
25,583,000
25,363,000
26. Surplus as regards policyholders (PHS)
31,024,000
31,608,000
35,793,000
32,572,000
34,567,000
Results of IRIS Ratios 1 and 2
IRIS Ratio 1 (= Line 6 / Line 26) 92% 89% 82% 96% 92%
IRIS
Ratio 2 (= Line 12 / Line 26)
86%
82%
71%
79%
73%
As displayed in the above table, the results of IRIS Ratio 1 for Fictitious, ranging from 82% to
96% over the period 2014 to 2018, were well within the benchmark imposed for unusual
values (900%). Similarly, the results of IRIS Ratio 2, ranging from 71% to 86% over same
period, were well within the 300% benchmark on a net basis.
IRIS Ratio 3 provides the change in net written premiums, current year over prior year, as a
percentage of prior year net written premium. The source of this data can be readily found in
an insurance company’s Annual Statement, from either Part 1B of the current year and prior
year U&IEs, or Five-Year Historical Data.
The purpose of IRIS Ratio 3 is to identify companies that are growing or declining rapidly so
that further investigation can be made as to the cause. Unusual values are outside of the -33%
to +33% range.
The following are examples of considerations that should be made when reviewing the results
of IRIS Ratio 3:
• Consistent or large increases in results:
• Growth brings uncertainty in the types of risks written and the frequency and
ultimate cost of claims. In certain markets, it is difficult to expand without
conceding on pricing and underwriting standards. Further investigation as to
the source of the company’s expansion and whether the company has been
able to maintain adequate pricing and terms and conditions is warranted. In
addition, a review of the results of other IRIS Ratios can serve to mitigate or
augment the uncertainty. For example, a mitigating factor would be a low
result for IRIS Ratios 1 and 2.
• Consistent or large decreases in results:
• A decrease in writings also requires attention. A sharp reduction in writings
may be a sign of financial stress.

FINANCIAL REPORTING THROUGH THE LENS OF A PROPERTY/CASUALTY ACTUARY
Appendix I. Fictitious Insurance Company
Page 4 of 17
• Unstable results year over year:
• This may be a sign that the company does not have good controls on its
underwriting or a solid business plan and therefore raises uncertainty with
respect to the viability of the company in the long-term.
We can also calculate IRIS Ratio 3 from Fictitious’ Five-Year Historical Data exhibit.
Data from Fictitious Insurance Company 2018 Five-Year Historical Data (USD)
2018 2017 2016 2015 2014
12. Net premiums written (NPW)
26,7
52
,000
25,936,000
25,521,000
25,583,000
25,363,000
Results of IRIS Ratio 3
IRIS Ratio 3 (= Line 12 current less prior
year) /Line 12 prior year)
3% 2% 0% 1%
As displayed in the above table, the results of IRIS Ratio 3 for Fictitious, ranging from 0% to
3% over the period 2014 through 2018, were well within the benchmark imposed for unusual
values (outside the range -33% to +33%).
IRIS Ratio 4 provides the ratio of surplus aid to policyholder surplus. It is meant to identify
companies that rely heavily on reinsurance as a means to enhance surplus. Insurance
companies typically receive a ceding commission from their reinsurers for placing business
with those reinsurers. Under statutory accounting, the treatment of ceding commissions is
similar to the way that an insurance company treats policy acquisition costs, the “signs” are
just different. While acquisition expenses are a direct charge to income and surplus as they
are incurred, ceding commissions are recognized as a credit to income and surplus when they
are incurred. Surplus aid represents the amount of enhancement to surplus in the current
period as a result of ceding commission that has been taken into income on its ceded
unearned premium. Formulaically,
Surplus aid =
Estimated reinsurance commission rate
* Unearned premium on reinsurance ceded to non-affiliates
where,
Estimated reinsurance commission rate =
Ceding commissions from reinsurance, including contingent commissions
÷ Total written premiums ceded to reinsurers (affiliates and non-affiliates)

FINANCIAL REPORTING THROUGH THE LENS OF A PROPERTY/CASUALTY ACTUARY
Appendix I. Fictitious Insurance Company
Page 5 of 17
Ceding commissions from reinsurance for the current year are found in Part 3, Expenses of
the U&IE of the Annual Statement, column 2 (other underwriting expenses), line 2.3
(reinsurance ceded, excluding contingent) plus line 2.6 (contingent — reinsurance ceded).
Total written premiums ceded to reinsurers is found in Part 1B, Premiums Written of the U&IE
of the Annual Statement, column 4 (reinsurance ceded to affiliates) plus column 5
(reinsurance ceded to non-affiliates) totals.
Unearned premium on reinsurance ceded to non-affiliates is found in Schedule F, Part 3,
reinsurance ceded of the Annual Statement, column 13 totals for the following three
categories of unaffiliated reinsurers:
1. Authorized, unauthorized and certified other U.S. unaffiliated insurers
2. Authorized, unauthorized and certified mandatory and voluntary pools
3. Authorized, unauthorized and certified other non-U.S. insurers
IRIS Ratio 4 is the ratio of surplus aid, as calculated above, to policyholders’ surplus.
Unusual values are greater than or equal to 15%, and may be a sign that policyholders’
surplus is inadequate. Therefore, when IRIS Ratio 4 produces values greater than 15%, certain
other IRIS Ratio tests dependent upon policyholders’ surplus are recalculated to remove
surplus aid. These are:
IRIS Ratio 1: Gross premiums written to policyholders’ surplus
IRIS Ratio 2: Net premiums written to policyholders’ surplus
IRIS Ratio 7: Gross change in policyholders’ surplus
IRIS Ratio 10: Gross agents’ balances (in collection) to policyholders’ surplus
IRIS Ratio 13: Estimated current reserve deficiency to policyholders’ surplus
Further, when IRIS Ratio 4 produced unusual values, the company’s reinsurance treaties
should be evaluated to assess the impact that cancellation could have on solvency.
The following provides the calculation of IRIS Ratio 4 for Fictitious.

FINANCIAL REPORTING THROUGH THE LENS OF A PROPERTY/CASUALTY ACTUARY
Appendix I. Fictitious Insurance Company
Page 6 of 17
Data from Fictitious Insurance Company 2018 Annual Statement (USD)
2018 Source
(1) Surplus Aid 403,172 = (2) * (9) * 1000
(2) Estimated reinsurance commission rate 44% = (3) / (6)
(3) Total ceding commissions from reinsurance 825,000 = (4) + (5)
(4) Reinsurance ceded, excluding contingent 816,000 Underwriting & Investment Exhibit, Part 3, Column
2, Line 2, 3
(5) Ceding Commission from reinsurance 9,000 Underwriting & Investment Exhibit, Part 3, Column
2, Line 2, 6
(6) Total written premiums ceded to reinsurers 1,882,000 = (7) + (8); = Five Year Historical Data GPW minus
NPW
(7) Reinsurance ceded to affiliates 0 Underwriting & Investment Exhibit, Part 1B, Column
4, Total
(8) Reinsurance ceded to non-affiliates 1,882,000 Underwriting & Investment Exhibit, Part 1B, Column
5, Total
(9) Unearned premium on reinsurance ceded to
non-affiliates
920 = Sum of (10) through (21)
(10) Authorized Other U.S. Unaffiliated Insurers 532 Schedule F, Part 3, Column 13, Total (000 omitted)
(11) Authorized Mandatory Pools Schedule F, Part 3, Column 13, Total (000 omitted)
(12) Authorized Voluntary Pools 50 Schedule F, Part 3, Column 13, Total (000 omitted)
(13) Authorized Other Non-U.S. Insurers 201 Schedule F, Part 3, Column 13, Total (000 omitted)
(14) Unauthorized Other U.S. Unaffiliated Insurers 29 Schedule F, Part 3, Column 13, Total (000 omitted)
(15) Unauthorized Mandatory Pools Schedule F, Part 3, Column 13, Total (000 omitted)
(16) Unauthorized Voluntary Pools Schedule F, Part 3, Column 13, Total (000 omitted)
(17) Unauthorized Other Non-U.S. Insurers 16 Schedule F, Part 3, Column 13, Total (000 omitted)
(18) Certified Other U.S. Unaffiliated Insurers Schedule F, Part 3, Column 13, Total (000 omitted)
(19) Certified Mandatory Pools Schedule F, Part 3, Column 13, Total (000 omitted)
(20) Certified Voluntary Pools Schedule F, Part 3, Column 13, Total (000 omitted)
(21) Certified Other Non-U.S. Insurers 92 Schedule F, Part 3, Column 13, Total (000 omitted)
(22) Surplus as regards policyholders (PHS) 31,024,000 Page 3, Line 37, Column 1
Results of IRIS Ratio 4
IRIS Ratio 4 1.30% = (1) / (22)
As displayed in the above table, the result of IRIS Ratio 4 of 1.30% for Fictitious was well
within the benchmark imposed for unusual values (greater than or equal to 15%).
PROFITABILITY RATIOS
The profitability ratios focus on the insurance company’s profitability from an operations,
investment and surplus perspective. There are four profitability ratios:
IRIS Ratio 5: Two-year overall operating ratio
IRIS Ratio 6: Investment yield
IRIS Ratio 7: Gross change in policyholders’ surplus
IRIS Ratio 8: Change in adjusted policyholders’ surplus

FINANCIAL REPORTING THROUGH THE LENS OF A PROPERTY/CASUALTY ACTUARY
Appendix I. Fictitious Insurance Company
Page 7 of 17
IRIS Ratio 5 essentially provides a company’s combined ratio over a two-year period, offset
for investment income earned over that period. In IRIS Ratio 5, the combined ratio is
calculated as loss and loss adjustment expense (LAE) incurred plus policyholder dividends
incurred, divided by earned premium, plus other underwriting expenses less other income,
divided by written premium. The investment income ratio is calculated as the ratio of
investment income earned divided by earned premium.
Two-year operating ratio =
Two-year combined ratio – Two-year investment income ratio
where,
Combined ratio =
Net loss and LAE + Dividends to policyholders incurred
Net earned premium
+ Other underwriting expenses – Other income incurred
Net written premium
Investment income ratio =
Investment income earned
Net earned premium
The source of this data can be readily found in an insurance company’s Annual Statement,
from the Statement of Income and Part 1B of the U&IE.
The purpose of IRIS Ratio 5 is to identify companies that are operating unprofitably. A two-
year period is used in the calculation to smooth unusual fluctuations due to a “bad” loss or
investment year. Unusual values are greater than or equal to 100%, meaning that the
company is operating at an underwriting loss, even after consideration of investment income.
When reviewing the result of this ratio, consideration should be made for the cause by looking
at each of the components of the calculation. During the financial crisis, companies
experienced a significant decline in investment income and therefore did not achieve as much
of a benefit in the offset afforded in the calculation. Further, adverse development on prior
accident years will have an impact on the combined ratio, but such development may not be
reflective of profitability on the company’s current operations or current reserving.
IRIS Ratio 5 is calculated for Fictitious in the following table.

FINANCIAL REPORTING THROUGH THE LENS OF A PROPERTY/CASUALTY ACTUARY
Appendix I. Fictitious Insurance Company
Page 8 of 17
Data from Fictitious Insurance Company 2018 Annual Statement (USD)
2018
(Current
Year)
2017
(Prior Year)
Sum over
2-Year Source
(1) Combined Ratio 108% 94% 101% = (2) + (8)
(2) Loss Ratio 76% 62% 69% = (3) / (7)
(3) Loss & LAE plus Dividends to
Policyholders incurred
20,208,000 15,838,000 36,046,000 = (4) + (5) + (6)
(4) Losses incurred 16,907,000 12,798,000 29,705,000 Statement of Income, Line 2,
Columns 1 and 2, respectively
(5) Loss Adjustment Expenses (LAE)
incurred
3,255,000 3,008,000 6,263,000 Statement of Income, Line 3,
Columns 1 and 2, respectively
(6) Dividends to policyholders 46,000 32,000 78,000 Statement of Income, Line 17,
Columns 1 and 2, respectively
(7) Net premiums earned 26,512,000 25,535,000 52,047,000 Statement of Income, Line 1,
Columns 1 and 2, respectively
(8) Expense Ratio 32% 32% 32% = (9) / (13)
(9) Expenses Incurred 8,450,000 8,194,000 16,664,000 = (10) + (11) - (12)
(10) Other underwriting expenses 8,483,000 8,240,000 16,723,000 Statement of Income, Line 4,
Columns 1 and 2, respectively
(11) Aggregate write-ins for underwriting
deductions – 1,000 1,000
Statement of Income, Line 5,
Columns 1 and 2, respectively
(12) Total other income 33,000 47,000 80,000 Statement of Income, Line 15,
Columns 1 and 2, respectively
(13) Net premiums written 26,752,000 25,936,000 52,688,000 Underwriting & Investment Exhibit,
Part 1B, Column 6, Total*
(14) Investment Income Ratio 16% 19% 18% = (15) / (16)
(15) Investment income earned 4,290,000 4,860,000 9,150,000 Statement of Income, Line 9,
Columns 1 and 2, respectively
(16) Net premiums earned 26,512,000 25,535,000 52,047,000 Statement of Income, Line 1,
Columns 1 and 2, respectively
Results of IRIS Ratio 5
IRIS Ratio 5 84% = (1) - (14) for two-year period
*
Also provided in Five
-
Year
Historical Data
As displayed above, the result of IRIS Ratio 5 for Fictitious of 84% was well within the 100%
benchmark imposed for unusual values.
IRIS Ratio 6 provides the yield in the company’s investment portfolio over the past year. IRIS
Ratio 6 is calculated as net investment income earned during the year divided by the average
of cash plus invested assets over the current and prior year. The source of this data can be
readily found in an insurance company’s Annual Statement, from the balance sheet and
Statement of Income.
The purpose of IRIS Ratio 6 is to identify companies earning unusually low or high yields,
potentially indicating a risky, inefficient or expensive investment strategy. Unusual values are

FINANCIAL REPORTING THROUGH THE LENS OF A PROPERTY/CASUALTY ACTUARY
Appendix I. Fictitious Insurance Company
Page 9 of 17
outside of a 3.0% to 6.5% range. That is, it is expected that companies will achieve a 3.0% to
6.5% yield on their invested assets during the year.
When reviewing the result of this ratio, consideration should be made for the cause by looking
at each of the components of the calculation, and further investigation into the types of
investment should be made.
The following provides the calculation of IRIS Ratio 6 for Fictitious.
Data from Fictitious Insurance Company 2018 Annual Statement (USD)
2018
(Current
Year)
2017
(Prior Year
Sum over
2-Year
Source
(1) Net investment income earned 4,290,000 Statement of Income, Line 9, Column
1
(2) Cash and invested assets 88,551,000 88,534,000 88,542,500 = (3) + (4) - (5); Average over two-
year
(3) Total cash and investment assets
87,825,000 87,784,000
Page 2, Line 12, Columns 3 and 4,
respectively
(4) Investment income due and accrued 726,000 750,000 Page 2, Line 14, Columns 3 and 4,
respectively
(5) Borrowed money – – Page 3, Line 8, Columns 1 and 2,
respectively
Results of IRIS Ratio 6
IRIS Ratio 6 5.0% = 2 * (1) current year /[ (2) for
two-year period – (1) current year]
As displayed in the above table, the result of IRIS Ratio 6 for Fictitious of 5.0% was right
around the midpoint of the expected benchmark range of 3.0% to 6.5% for usual values. This
means that the company earned a return on its invested assets within what would be
considered the “norm” for companies in 2018.
IRIS Ratio 7 is what the NAIC calls “the ultimate measure of improvement or deterioration in
the insurer’s financial condition during the year.”
236
It provides the change in policyholder
surplus, current year over prior year, as a percentage of prior year surplus, with the surplus
figures coming directly from the company’s balance sheet. We note that historical surplus
figures are also provided in the Five-Year Historical Data of the company’s Annual Statement.
Unusual values are outside of a -10% to +50% range. That is, a decrease in a company’s
surplus by 10% or more, or an increase by 50% or more, is considered a signal for the analyst
to perform further inquiry and investigation. The NAIC recognizes that a 10% decrease is
236
NAIC, Insurance Regulatory Information System (IRIS) Ratios Manual, 2017 edition, page 18.

FINANCIAL REPORTING THROUGH THE LENS OF A PROPERTY/CASUALTY ACTUARY
Appendix I. Fictitious Insurance Company
Page 10 of 17
conservative; however, decreases in policyholder surplus are of course a greater concern
than increases. Increases in surplus of 50% or more are very unusual for a stable company
absent an acquisition or redistribution of capital amongst affiliates and therefore would be a
sign of financial instability. According to the NAIC, “a number of insolvent insurers report
dramatic increases in policyholders’ surplus prior to insolvency.”
237
Using the Five-Year Historical Data exhibit, we can calculate the result of IRIS Ratio 7 over the
past four years.
Data from Fictitious Insurance Company 2018 Annual Statement (USD)
2018 2017 2016 2015 2014
26. Surplus as regards policyholders (PHS)
31,024,000
31,608,000
35,793,000
32,572,000
34,567,000
Results of IRIS Ratio 7
IRIS Ratio 7 (= Line 26 current less prior
year / Line 26 prior year)
-1.8% -11.7% 9.9% -5.8%
As displayed in the above table, the result of IRIS Ratio 7 for Fictitious did breach the -10%
mark for unusual values in 2017 at -12%.
IRIS Ratio 8 is similar to IRIS Ratio 7, with the exception that current-year policyholders’
surplus is adjusted to remove changes in surplus notes, capital paid-in or transferred, and
surplus paid-in or transferred. Removal of these items provides a picture of the improvement
or deterioration in financial results due to operations. The source of the data used in the
calculation of IRIS Ratio 8 is the balance sheet and Statement of Income of the company’s
Annual Statement.
Unusual values are outside of a -10% to +25% range. That is, a decrease in a company’s
surplus resulting from operations by 10% or more, or an increase by 25% or more, is
considered a signal for the analyst to perform further inquiry and investigation. The lower
bound benchmark is the same as in Ratio 7; however, the upper bound of +25% is lower,
reflecting the expectation that operations would not typically cause an increase in surplus by
more than 25%.
The calculation of IRIS Ratio 8 is shown below for Fictitious.
237
Ibid.

FINANCIAL REPORTING THROUGH THE LENS OF A PROPERTY/CASUALTY ACTUARY
Appendix I. Fictitious Insurance Company
Page 11 of 17
Data from Fictitious Insurance Company 2018 Annual Statement (USD)
2018
(Current
Year)
2017
(Prior Year) Source
(1) Adjusted policyholders’ surplus (584,000) (4,546,000) = (2) - (3) - (4) – (8) – (12)
(2) Policyholders’ surplus 31,024,000 31,608,000 Statement of Income, Line 39, Columns 1
and 2, respectively
(3) Change in surplus notes
– –
Statement of Income, Line 29, Columns 1
and 2, respectively
(4) Capital paid-in or transferred – – = (5) + (6) + (7)
(5) Paid in – – Statement of Income, Line 32.1, Columns 1
and 2, respectively
(6) Transferred from surplus (Stock
Dividend)
– – Statement of Income, Line 32.2, Columns 1
and 2, respectively
(7) Transferred to surplus
– –
Statement of Income, Line 32.3, Columns 1
and 2, respectively
(8) Surplus paid-in or transferred – 361,000 = (9) + (10) + (11)
(9) Paid in – 361,000 Statement of Income, Line 33.1, Columns 1
and 2, respectively
(10) Transferred to capital (Stock
Dividend)
– – Statement of Income, Line 33.2, Columns 1
and 2, respectively
(11) Transferred from capital – – Statement of Income, Line 33.3, Columns 1
and 2, respectively
(12) Policyholders’ surplus prior year 31,608,000 35,793,000 Statement of Income, Line 21, Columns 1
and 2, respectively
Results of IRIS Ratio 8
IRIS Ratio 8 -2% -13% = (1) / (12)
As displayed in the above table, the result of IRIS Ratio 8 for Fictitious did breach the -10%
mark for unusual values in 2017 at -13%. This is consistent with the finding from IRIS Ratio 7;
however, it shows that the surplus enhancement during 2017 of $361,000 helped to cushion
the impact of the change in surplus observed in IRIS Ratio 7.
This ratio is telling us that the unusual value in 2017 could be attributed to the company’s
operations. However, going back and reviewing the components of IRIS Ratio 5, we see that
the company’s combined ratio for 2017 was 94%, indicating that the company was operating
at a profit from its underwriting results. Further, the investment income ratio in 2017 was
19%, which was higher than in 2018. This indicates that the decrease in the company’s
surplus was not a result of the company’s income; net income earned in 2017 was positive, at
$4.955 million (see page 4, line 20, column 2). We therefore need to look to the capital and
surplus account within the Statement of Income for the reason.
Within column 2 of the capital and surplus account, we see the biggest decrease in surplus
came from dividends to stockholders totaling $10.023 million in 2017. This was more than

FINANCIAL REPORTING THROUGH THE LENS OF A PROPERTY/CASUALTY ACTUARY
Appendix I. Fictitious Insurance Company
Page 12 of 17
$7 million higher than dividends made in 2018 and was the reason for the decrease in surplus
greater than 10%. Further investigation would determine why the company made such a large
dividend payment in 2017 and whether regulatory approvals were required and obtained.
LIQUIDITY RATIOS
The liquidity ratios focus on the amount of liquid assets that the insurance company has to
cover its obligations. There are two liquidity ratios:
IRIS Ratio 9: Adjusted liabilities to liquid assets
IRIS Ratio 10: Gross agents’ balances (in collection) to policyholders’ surplus
IRIS Ratio 9 provides an indication of the company’s ability to pay its financial obligations out
of assets that are readily convertible into acceptable forms of payment (i.e., cash). In this
calculation, an insurance company’s liabilities are adjusted to remove deferred agents’
balances, as these balances are not liquid assets. Liquid assets include the following:
• Bonds, excluding affiliates
• Stocks, excluding affiliates
• Cash, cash equivalents and short-term investments, excluding affiliates
• Receivable for securities
• Investment income due and accrued
Unusual values are greater than or equal to 100%, suggesting that the company would not be
able to pay its liabilities with current liquid assets as defined above.
The primary source of this information is the balance sheet, with investments in parent,
subsidiaries and affiliates coming from Five-Year Historical Data, lines 42 through 45 in the
2018 Annual Statement.
The following provides the calculation of IRIS Ratio 9 for Fictitious.

FINANCIAL REPORTING THROUGH THE LENS OF A PROPERTY/CASUALTY ACTUARY
Appendix I. Fictitious Insurance Company
Page 13 of 17
Data from Fictitious Insurance Company 2018 Annual Statement (USD)
2018
(Current
Year)
2017
(Prior Year) Source
(1) Adjusted Liabilities 63,862,000 63,141,000 = (2) - (3)
(2) Total liabilities 68,976,000 68,068,000 Page 3, Line 28, Columns 1 and 2,
respectively
(3) Deferred agent’s balances
5,114,000 4,927,000
Page 2, Line 15.2, Columns 3 and 4,
respectively
(4) Liquid assets 79,759,000 79,960,000 = (5) + (6) + (9) + (10) + (11) – (12)
(5) Bonds 58,676,000 58,861,000 Page 2, Line 1, Columns 3 and 4,
respectively
(6) Stocks 19,374,000 19,116,000 = (7) + (8)
(7) Preferred stocks
34,000 35,000
Page 2, Line 2.1, Columns 3 and 4,
respectively
(8) Common stocks
19,340,000 19,081,000
Page 2, Line 2.2, Columns 3 and 4,
respectively
(9) Cash, cash equivalents and short-
term investments 983,000 1,233,000
Page 2, Line 5, Columns 3 and 4,
respectively
(10) Receivables for securities – – Page 2, Line 9, Columns 3 and 4,
respectively
(11) Investment income due and accrued 726,000 750,000 Page 2, Line 14, Columns 3 and 4,
respectively
(12) Investments in parent, subsidiary and
affiliates – – = (13) + (14) + (15) + (16)
(13) Affiliated bonds – – Five-Year Historical Data, Line 42, Columns 1
and 2, respectively
(14) Affiliated preferred stocks - - Five-Year Historical Data, Line 43, Columns 1
and 2, respectively
(15) Affiliated common stocks – – Five-Year Historical Data, Line 44, Columns 1
and 2, respectively
(16) Affiliated short-term investments – – Five-Year Historical Data, Line 45, Columns 1
and 2, respectively
Results of IRIS Ratio 9
IRIS Ratio 9 80% 79% = (1) / (4)
As displayed above, the result of IRIS Ratio 9 for Fictitious Insurance Company was 80% in
2018, about 20 points below the 100% benchmark for unusual values. This ratio was
consistent with that in 2017 of 79%.
IRIS Ratio 10 provides the ratio of agents’ balances in the course of collection to
policyholders’ surplus. The purpose is to show how dependent a company’s surplus is to
assets that may not be collectible upon liquidation or are of questionable liquidity.
The source of the data is the balance sheet of the company’s Annual Statement. Unusual
values are greater than or equal to 40% of surplus.

FINANCIAL REPORTING THROUGH THE LENS OF A PROPERTY/CASUALTY ACTUARY
Appendix I. Fictitious Insurance Company
Page 14 of 17
The following provides the calculation of IRIS Ratio 10 for the current and prior year for
Fictitious.
Data from Fictitious Insurance Company 2018 Annual Statement (USD)
2018
(Current
Year)
2017
(Prior Year) Source
(1) Uncollected premiums and agent’s
balances in course of collection
2,626,000 2,866,000 Page 2, Line 15.1, Columns 3 and 4,
respectively
(2) Policyholders’ surplus 31,024,000 31,608,000 Page 3, Line 37, Columns 1 and 2,
respectively
Results of IRIS Ratio 10
IRIS Ratio 10 8% 9% = (1) / (2)
As displayed above, the result of IRIS Ratio 10 for Fictitious was 8% in 2018, which was well
below the 40% threshold for unusual values. This was consistent with the result in 2017 of 9%.
RESERVE RATIOS
The reserve ratios focus on the development of an insurance company’s net loss and LAE
reserves for purposes of understanding reserve adequacy. These are probably the most
important ratios to the property/casualty actuary and where the actuary places most
attention, as these ratios are specifically commented on by the appointed actuary in the SAO.
There are three reserve ratios:
IRIS Ratio 11: One-year reserve development to policyholders’ surplus
IRIS Ratio 12: Two-year reserve development to policyholders’ surplus
IRIS Ratio 13: Estimated current reserve deficiency to policyholders’ surplus
IRIS Ratio 11 is the same one-year development test as provided in the Five-Year Historical
Data exhibit within the Annual Statement (line 74 in the 2018 Annual Statement). It measures
development in the company’s net loss and LAE reserves over the past year, whether adverse
or favorable, relative to prior year surplus. Essentially, this test looks to see how much
surplus would have been absorbed or enhanced in the prior year as a result of adverse or
favorable development in the corresponding net loss and LAE reserves. Adverse development
is shown as an increase to reserves and therefore a positive number. Results of IRIS Ratio 11
greater than or equal to 20% are considered unusual.
The following table provides the calculation of IRIS Ratio 11 for Fictitious over the period
2015 through 2018.

FINANCIAL REPORTING THROUGH THE LENS OF A PROPERTY/CASUALTY ACTUARY
Appendix I. Fictitious Insurance Company
Page 15 of 17
Data from Fictitious Insurance Company 2018 Five-Year Historical Data (USD)
2018 2017 2016 2015 2014
73.
Development in estimated losses and
loss expenses incurred prior to current
year (Schedule P, Part 2, Summary, Line
12, Col. 11; in 000s
(875)
(1,354)
(1,618)
(1,935)
(918)
74.
Percent of development
of losses and
loss expenses incurred to policyholders’
surplus of prior year end (line 73 divided
by Page 4, Line 21, Col. 1 x 100)
(2.8)
(3.8)
(5.0)
(5.6)
(2.6)
26.
Surplus as regards policyholders (PHS)
31,024,000
31,608,000
35,793,000
32,572,000
34,567
,000
Results of IRIS Ratio 11
IRIS Ratio 11 (= Line 74 above; = Line 73 /
Line 26 prior * 1000)
-2.8% -3.8% -5.0% -5.7%
As displayed in the above table, Fictitious’ loss and LAE net reserves developed favorably
over the period 2014 through 2018. As a result, IRIS Ratio 11 has historically been negative,
ranging from -3% to -6%, and therefore well below the benchmark imposed for unusual values
(greater than or equal to +20%).
The trigger of an “unusual” value is a current year ratio greater than or equal to 20%. This will
capture reserve deficiencies in the immediate prior year. In addition to this warning, the AOS
serves to notify regulators of any trends whereby development in three of the prior five years
exceeds 5%. The AOS has a lower threshold than IRIS 11, as it serves to identify those
companies that consistently underestimate their loss and LAE reserves.
IRIS Ratio 12 is the same two-year development test as provided in the Five-Year Historical
Data exhibit within the Annual Statement (line 76 of the 2018 Annual Statement). It
measures development in the company’s net loss and LAE reserves over the past two years,
relative to surplus at the end of the second prior year. Similar to Ratio 11, results of test 12
greater than or equal to 20% are considered unusual.
The following table provides the calculation of IRIS Ratio 12 for Fictitious over the period
2016 through 2018.

FINANCIAL REPORTING THROUGH THE LENS OF A PROPERTY/CASUALTY ACTUARY
Appendix I. Fictitious Insurance Company
Page 16 of 17
Data from Fictitious Insurance Company 2018 Five-Year Historical Data (USD)
2018 2017 2016 2016 2014
75.
Dev
elopment in estimated losses and
loss expenses incurred 2 years before
the current year and prior year
(Schedule P, Part 2, Summary, Line 12,
Col. 12); in 000s
(2,602)
(2,906)
(3,680)
(2,5
44
)
(
1,059
)
76.
Percent of development of losses and
loss expenses incurred to policyholders’
surplus of second prior year end (Line
75 divided by Page 4, Line 21, Col. 2 x
100)
(7.3)
(8.9)
(10.6)
(7.3)
(3.0)
26.
Surplus as regards policyholders (PHS)
31,024,000
31,608,000
35,793,000
32,572,000
34,567,000
Results of IRIS Ratio 12
IRIS Ratio 12 (= Line 76 above; = Line 75 /
Line 26 2
nd
prior * 1000)
-7.3% -8.9% -10.6%
As displayed in the above table, Fictitious’ IRIS Ratio 12 results have historically been
negative, ranging from -7% to -10%, and therefore well below the benchmark imposed for
unusual values (+20%).
IRIS Ratio 13 is a hindsight test. It looks at a company's net outstanding loss and LAE
reserves at the immediate prior two years relative to calendar year earned premium for those
years and adds to the reserves development that has emerged over that period (one-year
development for the immediate prior year; two-year development for the year prior to that).
The test then applies the average of the resulting two “adjusted” loss ratios to earned
premium for the recent year (2018) to determine what the outstanding loss reserve should be
for that year (2018). A calculated deficiency in recorded loss and LAE reserves of 25% or
more is deemed to be unusual.
The purpose of this test is to identify companies that may not have gotten their reserves
“right” in the past. The expectation inherent in this test is if companies have had adverse
development in the past, they will probably have adverse development in the future.
Regulators want to see if companies who have had such adverse development have corrected
for it in their current estimates.
The following are examples of considerations that should be made when reviewing the results
of IRIS Ratio 13:
• The losses and premiums are not matched in Ratio 13; the numerator is unpaid loss
and LAE for all accident years, whereas the denominator is earned premium for the
current accident year.

FINANCIAL REPORTING THROUGH THE LENS OF A PROPERTY/CASUALTY ACTUARY
Appendix I. Fictitious Insurance Company
Page 17 of 17
• This mismatch obstructs the usefulness of the ratio because growth or decline
in premium volume, or changes in the mix of business between short- and long-
tailed lines, will distort the “outstanding” loss ratio.
• Similarly, because it is strictly a quantitative test, IRIS Ratio 13 cannot take into
account qualitative factors that may mitigate adverse development in the future on
current reserves, such as change in mix of business.
• A good example is a company that had observed adverse development on its
commercial automobile liability (CAL) line of business in the prior two years but
significantly changed their product mix in the current year to be more heavily
weighted toward short-tailed homeowners business. As a result of this change
in mix, such adverse development would not be expected in the future.
IRIS Ratio 13 requires use of the prior year Annual Statement. While we have not included the
2017 Annual Statement for Fictitious, we have included the required values in the following
table to calculate the result of IRIS Ratio 13 for 2018.
2016
2017 2018
Source
One-Year Development (875) (1) Schedule P, Part 2, Line 12, Column 11;
Five-Year Historical Data, Line 73
Two-Year Development (2,602) (2)
Schedule P, Part 2, Line 12, Column 12;
Five-Year Historical Data, Line 75
Earned Premium 25,618 25,535 26,512 (3) Stmt of Income, Line 1, divided by 1,000
Loss Reserves 41,643 40,933 41,894 (4) Page 3, Line 1, divided by 1,000
LAE Reserves 9,955 9,664 9,663 (5) Page 3, Line 3, divided by 1,000
Policyholder Surplus 35,793 31,608 31,024 (6) Page 3, Line 37, divided by 1,000
Result of IRIS Ratio 13
2016 2017 2018 Source
IRI
S Ratio 13
Outstanding Loss Ratios 201% 198% 194% (7) Sum of (4) thru (5), divided by (3)
Restated Loss and LAE Reserves 48,995 49,722 (8)
Sum of (4) thru (5), + (1) for 2017 or + (2)
for 2016
Restated Outstanding Loss Ratios 191% 195% (9) = (8) divided by (3)
Average Outstanding Loss Ratio 193% (10) = average of row (9)
Implied Loss and LAE Reserves 51,165 (11) = (10) * (3)
Actual Loss and LAE Reserves 51,557 (12) Sum of (4) through (5)
Deficiency/(Redundancy) (392) (13) = (11) – (12)
Ratio of Def/(Red to PHS) -1% (14) = (13) divided by (6)
As displayed in the above table, Fictitious’ IRIS Ratio 13 result was -1% for 2018, which was
well below the benchmark imposed for unusual values (greater than or equal to 25%).

FINANCIAL REPORTING THROUGH THE LENS OF A PROPERTY/CASUALTY ACTUARY
Appendix II. Canadian Financial Statements
APPENDIX II. CANADIAN FINANCIAL STATEMENTS
2018 BALANCE SHEET FOR ALL PROPERTY/CASUALTY INSURANCE COMPANIES
Cash and Cash Equivalents
5,004,780
$
Investment Income Due and Accrued
512,256
Assets held for sale
51,342
Investments:
Short Term Investments
4,409,047
Bonds and Debentures
85,354,451
Mortgage Loans
3,155,188
Preferred Shares
4,003,219
Common Shares
11,104,320
Investment Properties
1,458,416
Other Loans and Invested Assets
19,445,175
Total Investments
128,929,816
Receivables:
Unaffiliated Agents and Brokers
2,752,562
Policyholders
3,046,376
Instalment Premiums
14,353,389
Other Insurers
1,052,307
Facility Association and the "P.R.R."
270,560
Subsidiaries, Associates & Joint Ventures
736,663
Income Taxes
Other Receivables
411,455
Recoverable from Reinsurers:
Unearned Premiums
5,493,730
Unpaid Claims and Adjustment Expenses
19,869,122
Other Recoverables on Unpaid Claims
634,168
Investments Accounted for Using the Equity Method:
Interests in Subsidiaries, Associates & Joint Ventures
497,933
Pooled Funds
7,520,427
Property and Equipment
881,111
Deferred Policy Acquisition Expenses
6,601,419
Current Tax Assets
694,186
Deferred Tax Assets
1,633,334
Goodwill
1,573,985
Intangible Assets
2,483,752
Defined Benefit Pension Plan
132,270
Other Assets
606,043
Total Assets
205,742,987
$
Total Canadian Property and Casualty Companies
CONSOLIDATED ASSETS
As At Q4 - 2018
(in thousands of dollars)
Liabilities
Overdrafts
205,224
$
Borrowed Money and Accrued Interest
35,842
Payables:
Agents and Brokers
984,489
Policyholders
212,480
Other Insurers
1,011,848
Subsidiaries, Associates & Joint Ventures
1,710,323
2,007,317
Other Taxes Due and Accrued
1,169,444
Policyholder Dividends and Rating Adjustments
54,123
Encumbrances on Real Estate
15,602
Unearned Premiums
40,252,698
Unpaid Claims and Adjustment Expenses
98,321,002
Unearned Commissions
1,029,531
Ceded Deferred Premium Taxes
72,003
Ceded Deferred Insurane Operations Expenses
19,160
Premium Deficiency
16
Liabilities Held for Sale
-
Current Tax Liabilities
114,310
Deferred Tax Liabilities
367,138
Self-Insured Retention (SIR) portion of unpaid claims
530,134
Defined Benefit Pension Plan
774,569
Employment Benefits (not including amounts on line 23 above)
810,770
Subordinated Debt
335,500
Preferred Shares - Debt
50,000
Provisions and Other Liabilities
3,583,009
Total Liabilities
153,668,609
$
Shares issued and paid
Common
14,711,535
Preferred
1,470,409
Contributed Surplus
3,674,641
Other
10,569
Retained Earnings
16,667,512
Head Office Account
15,154,063
Reserves
640,113
Accumulated Other Comprehensive Income (Loss)
(270,048)
Non-controlling Interests
15,581
Total Equity
52,074,375
$
Total Liabilities and Equity
205,742,984
$
Total Canadian Property and Casualty Companies
CONSOLIDATED LIABILITIES AND EQUITY
As At Q4 - 2018
(in thousands of dollars)

FINANCIAL REPORTING THROUGH THE LENS OF A PROPERTY/CASUALTY ACTUARY
Appendix II. Canadian Financial Statements
2018 INCOME STATEMENT FOR ALL PROPERTY/CASUALTY INSURANCE
COMPANIES
Underwriting Operations
Premiums Written
Direct 66,983,074$
Reinsurance Assumed 9,524,026
Reinsurance Ceded 15,257,518
Net Premiums Written
61,249,582
Decrease (Increase) in Unearned Premiums (2,428,429)
Net Premiums Earned
58,821,152
Service Charges 354,500
Other 1,347
Total Underwriting Revenue
59,176,999
Gross Claims and Adjustment Expenses 53,026,937
Reinsurers' Share of Claims and Adjustment Expenses 9,943,318
Net Claims and Adjustment Expenses
43,083,619
Acquisition Expenses
Gross Commissions 10,903,412
Ceded Commissions 3,067,941
Taxes 2,304,052
Other 2,239,354
General Expenses 4,981,920
Total Claims and Expenses
60,434,032
Premium Deficiency Adjustments (360,758)
Underwriting Income (Loss)
(896,274)
Investment Operations
Income 3,494,489
Gains (Losses) from FVO or FVTPL (774,052)
Realized Gains (Losses) 332,710
Expenses 221,829
Net Investment Income
2,830,686
Other Revenue and Expenses
Income (Loss) from Ancillary Operations net of Expenses (44,376)
Share of Net Income (Loss) of Subsidiaries, Associates & Joint Ventures 12,745
Overlay approach adjustment for financial instruments (Reclass from P&L to OCI) 331,276
Share of Net Income (Loss) of Pooled Funds using Equity Method 113,963
Gains (Losses) from Fluctuations in Foreign Exchange Rates 385,693
Other Revenues (49,637)
Finance Costs 26,494
Other Expenses 131,765
Net Income (Loss) before Income Taxes
2,525,856
Income Taxes
Current 726,574
Deferred (199,159)
Total Income Taxes
527,415
Net Income (Loss) for the Year 1,998,442$
Attributable to:
Non-controlling Interests 961
Equity Holders 3,311,854
Total Canadian P&C
CONSOLIDATED STATEMENT OF INCOME
Year to date: End of Q4 - 2018
(in thousands of dollars)
