J.
Phsyiol.
(1972),
227,
pp.
141-171
141
With
17
text-figures
Printed
in
Great
Britain
MEMBRANE
CURRENT
AND
CONTRACTION
IN
FROG
ATRIAL
FIBRES
By
H.
M.
EINWACHTER,
H.
G.
HAAS
AND
R.
KERN
From
the
First
Department
of
Physiology,
University
of
Heidelberg,
Heidelberg,
Germany
(Received
1
May
1972)
SUMMARY
1.
Membrane
current
and
mechanical
activity
were
recorded
from
short
segments
of
frog
atrial
muscle
strips
using
a
double
sucrose
gap
voltage
clamp
arrangement.
Experiments
were
performed
at
4-7O
C.
Two
types
of
contraction
were
observed
dependent
upon
the
duration
of
the
clamp.
2.
Short-lasting
depolarizations
caused
a
flow
of
Ca
inward
current,
ICa,
and
development
of
a
phasic
contraction.
Time
to
peak
tension
approximated
400
msec.
Both
ICa
and
contraction,
as
functions
of
mem-
brane
potential,
had
a
threshold
of
about
-40
mV
and
were
maximal
at
inside
positive
potentials
in
normal
Ringer
fluid.
Peak
tension
decreased
at
strong
depolarizations.
3.
The
minimum
time
of
depolarization
required
for
initiation
of
a
phasic
contraction
was
40-70
msec.
The
time
necessary
for
full
activation
of
contraction
was
200-300
msec
and
comparable
to
the
period
of
time
covered
by
the
flow
of
ICa-
4.
There
was
no
marked
change
in
peak
tension
upon
repetitive
depo-
larization
to
the
same
membrane
potential.
5.
Restoration
of
(phasic)
contractility
after
a
preceding
contraction
was
strongly
dependent
on
the
level
of
membrane
potential
between
con-
ditioning
and
test
pulse.
Restoration
was
half
complete
at
potentials
around
-45
mV.
6.
Long-lasting
depolarizations
generated
tonic
(sustained)
contractions
superimposed
on
the
phasic
(transient)
ones.
Threshold
potential
for
initiation
of
tonic
contractions
was
usually
positive
to
the
threshold
of
phasic
contractions.
The
time
taken
to
attain
the
final
level
of
tension
ranged
between
0
7
and
3
sec.
Plateau
tension,
as
a
function
of
membrane
potential,
increased
with
increasing
depolarization
and
reached
a
flat
maximum
at
about
+
50
mV
in
normal
Ringer
fluid.
7.
At
membrane
potentials
near
zero
level,
plateau
tension
developed
by
the
tonic
mechanism
was
about
twice
peak
tension
due
to
phasic
contraction.
142
H.
M.
EINWZACHTER,
H.
G.
HAAS
AND
R.
KERN
8.
Removal
of
Ca
ions
from
the
external
medium
resulted
in
an
almost
complete
abolition
of
phasic
contraction
within
1-2
min
and
a
gradual
decrease
of
tonic
contraction
during
the
first
10
min.
Application
of
a
'Ca
inhibitor'
to
normal
Ringer
fluid
caused
a
strong
reduction
of
both
ICa
and
phasic
contraction
without
affecting
tonic
contractions.
9.
It
is
concluded
that
phasic
contractions
are
directly
activated
by
the
flow
of
ICa.
Generation
of
tonic
contractions
may
be
attributed
to
a
Ca
transfer
mechanism
different
from
'Ca
or
a
release
of
Ca
from
intracellular
stores.
INTRODUCTION
A
new
approach
to
the
problem
of
excitation-contraction
coupling
in
cardiac
muscle
was
recently
obtained
by
using
voltage
clamp
arrange-
ments
which
allow
simultaneous
measurements
of
membrane
current
and
contraction
during
step
depolarizations
of
variable
height
and
duration.
Voltage
control
by
this
technique
is
obviously
superior
to
earlier
methods
producing
depolarization
by
elevated
external
K
concentrations
or
appli-
cation
of
constant
current
pulses.
Fundamental
information
on
the
con-
tractile
behaviour
of
mammalian
heart
muscle
was
obtained
from
voltage
clamp
studies
on
dog
ventricular
preparations
(Beeler
&
Reuter,
1970a,
b,
c).
In
this
tissue
the
contractile
response
to
depolarizations
up
to
1
sec
in
duration
is
a
twitch
with
full
relaxation
('phasic'
contraction).
Twitch
tension
is
graded
depending
on
amplitude
and
duration
of
the
clamp.
Initiation
of
a
twitch
is
intimately
related
to
a
transmembrane
Ca
inward
current.
Prolonged
depolarizations
induce
a
second
contraction
which
is
sustained
for
the
whole
duration
of
the
clamp
('tonic'
contraction).
A
biphasic
contraction,
that
is,
an
initial
twitch
followed
by
a
plateau
of
tension
in
response
to
long-lasting
depolarizations,
has
also
been
observed
in
sheep
cardiac
Purkinje
fibres
(Fozzard
&
Hellam,
1968;
Gibbons
&
Fozzard,
1971)
and
trabeculae
of
sheep
or
calf
ventricle
(McGuigan,
1968).
The
initial
twitch
seems
to
be
basic
to
the
normal
activity
during
an
action
potential.
The
occurrence
of
a
tonic
contraction
could
account
for
the
observation
made
in
some
cardiac
structures
that
lengthening
of
the
action
potential
duration
by
cathodal
pulses
leads
to
a
corresponding
prolongation
of
maintenance
of
tension
(Kavaler,
1959;
Morad
&
Traut-
wein,
1968;
Wood,
Heppner
&
Weidmann,
1969).
Because
of
distinct
ultrastructural
differences
between
mammalian
and
amphibian
heart
muscle
(Staley
&
Benson,
1968;
Sommer
&
Johnson,
1969),
a
voltage
clamp
analysis
of
myocardial
contractility
of
cold-blooded
animals
seems
of
particular
interest.
Thus
far
few
investigations
of
this
kind,
with
divergent
results,
have
been
presented.
According
to
Morad
&
Orkand
(1971),
tension
development
in
frog
ventricle
is
solely
due
to
a
E-C
COUPLING
IN
FROG
ATRIA
tonic
mechanism
continuously
controlled
by
the
membrane
potential
and
independent
of
a
transmembrane
flow
of
Ca
ions
down
their
electro-
chemical
gradient.
On
the
other
hand,
preliminary
studies
on
frog
atrial
muscle
(L6oty,
Raymond
&
Gargouil,
1970;
Vassort,
Rougier
&
Favelier,
1971)
suggest
the
existence
of
a
phasic,
Ca-dependent
component
of
con-
traction
similar
to
that
observed
in
mammalian
heart
muscle.
As
pointed
out
by
Goto,
Kimoto
&
Kato
(1971)
phasic
and
tonic
contraction
may
fuse
in
frog
heart
muscle
because
of
a
slow
relaxation
of
phasic
contraction
possibly
based
on
a
paucity
of
the
sarcotubular
system.
The
experiments
reported
here
aim
at
a
more
detailed
insight
into
the
mechanism
of
excitation-contraction
coupling
in
the
amphibian
heart.
Membrane
current
and
contractile
response
were
measured
in
voltage-
clamped
fibre
bundles
of
frog
atrial
tissue.
The
results
indicate
a
dual
effect
of
depolarization
on
contractile
force.
The
first
effect
is
an
inward
move-
ment
of
Ca
ions
which
seem
to
reach
the
myofibrils
without
any
marked
delay,
thereby
inducing
a
phasic
contraction.
There
is
no
need
to
assume
a
passage
through
intracellular
Ca
stores.
A
comparison
with
chemical
data
suggests
that
the
rise
in
intracellular
Ca
resulting
from
a
Ca
inflow
into
the
myoplasm
is
sufficient
for
a
partial
activation
of
the
contractile
system.
The
second
effect
is
the
development
of
a
sustained
tension.
The
ionic
requirements
of
this
phenomenon
are
not
clear.
It
seems
related
to
the
presence
of
external
Ca
ions
rather
than
the
flow
of
any
known
membrane
current
component.
METHODS
Solution&.
The
normal
Ringer
fluid
used
as
bathing
and
perfusing
medium
con-
sisted
of
(mm):
NaCl
111,
KCl
5-4,
NaHCO3
1.8,
CaCl2
2.
In
some
experiments
Ringer
fluid
was
modified
by
reducing
the
Ca
concentration
to
values
between
0.1
and
zero
or
by
adding
a
Ca-antagonistic
agent
(D
600,
a
methoxy-derivative
of
verapamil
delivered
by
Knoll
AG,
Ludwigshafen)
at
a
concentration
between
0
5
and
5
mM.
Isosmotic
KCl
solution
contained
121,
isosmotic
sucrose
solution
242
mM.
Ringer
fluid
and
KCl
solution
were
continuously
aerated
by
a
gas
mixture
of
95
%
02
and
5
%
CO2.
The
pH
was
adjusted
between
6-9
and
7-1.
All
experiments
were
done
at
4-70
C.
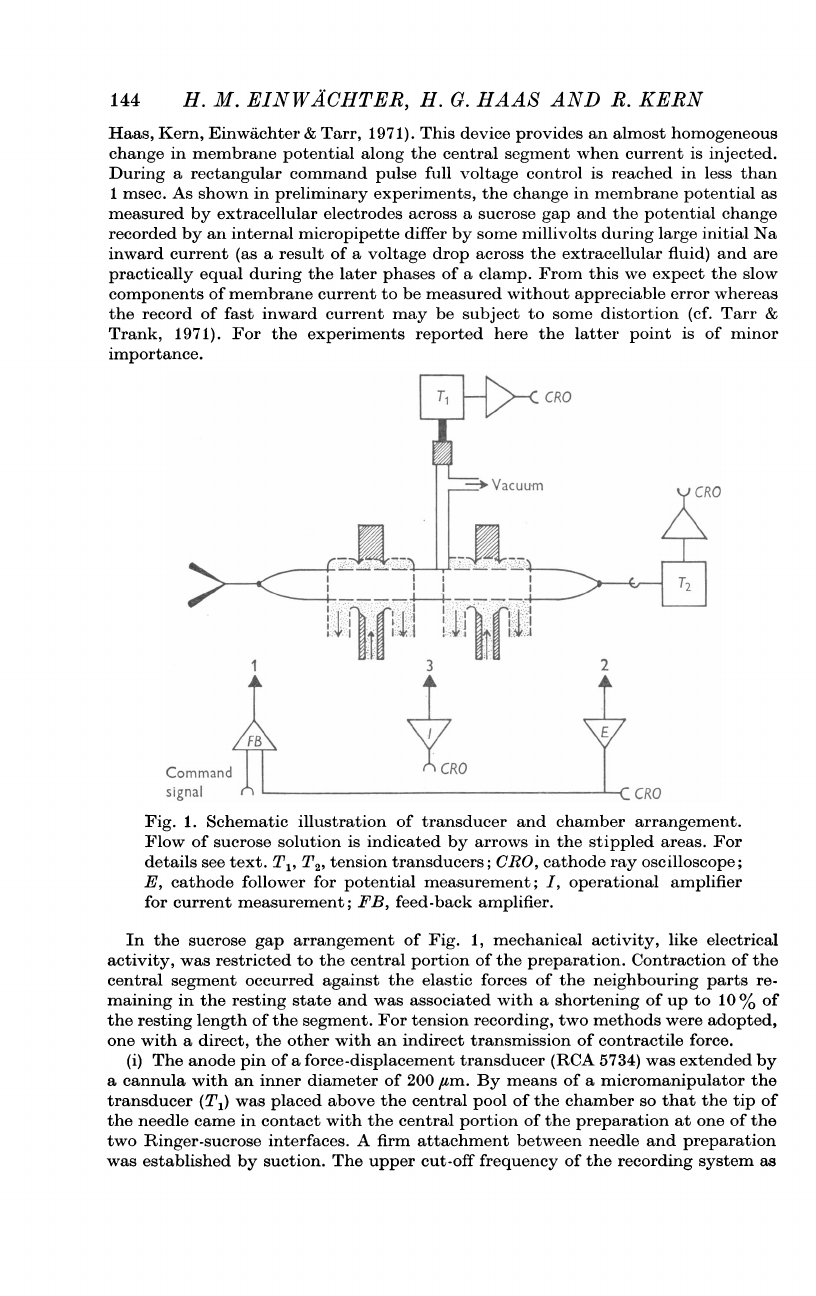
Experimental
arrangement.
Strips
of
0
3-0
7
mm
in
thickness
and
6-8
mm
in
length
were
dissected
from
the
inside
of
bullfrog
auricles
and
mounted
in
a
double
sucrose
gap
chamber
(Fig.
1).
The
three
compartments
of
the
chamber
were
directly
accessible
from
the
surface.
The
preparation
was
horizontally
pulled
through
a
channel
traversing
the
partitions
between
central
pool
and
side
pools.
The
ends
of
the
preparation
were
ligated
by
fine
silk
threads
held
by
forceps.
The
position
of
the
preparation
was
carefully
adjusted
to
prevent
any
direct
contact
with
the
partitions.
The
short
(about
0-2
mm)
central
segment
insulated
by
the
two
sucrose
streams
was
exposed
to
Ringer
fluid;
the
end
regions
were
bathed
in
KCl
solution.
Ag-AgCl
agar
electrodes
extracellularly
placed
were
used
for
current
injection
and
membrane
potential
measurement
in
the
central
portion.
Details
of
the
chamber
and
the
voltage
clamp
circuit
were
described
previously
(Haas,
Kern
&
Einwachter,
1970;
143
144
H.
-M.
EINWACHTER,
H.
G.
HAAS
AND
R.
KERN
Haas,
Kern,
Einwachter
&
Tarr,
1971).
This
device
provides
an
almost
homogeneous
change
in
membrane
potential
along
the
central
segment
when
current
is
injected.
During
a
rectangular
command
pulse
full
voltage
control
is
reached
in
less
than
1
msec.
As
shown
in
preliminary
experiments,
the
change
in
membrane
potential
as
measured
by
extracellular
electrodes
across
a
sucrose
gap
and
the
potential
change
recorded
by
an
internal
micropipette
differ
by
some
millivolts
during
large
initial
Na
inward
current
(as
a
result
of
a
voltage
drop
across
the
extracellular
fluid)
and
are
practically
equal
during
the
later
phases
of
a
clamp.
From
this
we
expect
the
slow
components
of
membrane
current
to
be
measured
without
appreciable
error
whereas
the
record
of
fast
inward
current
may
be
subject
to
some
distortion
(cf.
Tarr
&
Trank,
1971).
For
the
experiments
reported
here
the
latter
point
is
of
minor
importance.
T[
CRO
4-Vacuwn
CR0
3
2
Command-
CRO
l
signal
C
CRO
Fig.
1.
Schematic
illustration
of
transducer
and
chamber
arrangement.
Flow
of
sucrose
solution
is
indicated
by
arrows
in
the
stippled
areas.
For
details
see
text.
T1,
T2,
tension
transducers;
CRO,
cathode
ray
oscilloscope;
E,
cathode
follower
for
potential
measurement;
I,
operational
amplifier
for
current
measurement;
FB,
feed-back
amplifier.
In
the
sucrose
gap
arrangement
of
Fig.
1,
mechanical
activity,
like
electrical
activity,
was
restricted
to
the
central
portion
of
the
preparation.
Contraction
of
the
central
segment
occurred
against
the
elastic
forces
of
the
neighbouring
parts
re-
maining
in
the
resting
state
and
was
associated
with
a
shortening
of
up
to
10
%
of
the
resting
length
of
the
segment.
For
tension
recording,
two
methods
were
adopted,
one
with
a
direct,
the
other
with
an
indirect
transmission
of
contractile
force.
(i)
The
anode
pin
of
a
force-displacement
transducer
(RCA
5734)
was
extended
by
a
cannula
with
an
inner
diameter
of
200
/,tm.
By
means
of
a
micromanipulator
the
transducer
(TL)
was
placed
above
the
central
pool
of
the
chamber
so
that
the
tip
of
the
needle
came
in
contact
with
the
central
portion
of
the
preparation
at
one
of
the
two
Ringer-sucrose
interfaces.
A
firm
attachment
between
needle
and
preparation
was
established
by
suction.
The
upper
cut-off
frequency
of
the
recording
system
as
E-C
COUPLING
IN
FROG
ATRIA
145
determined
by
mechanical
factors
was
250
c/s.
The
output
of
the
transducer
tube
was
filtered
by
an
active
low-pass
circuit
with
an
upper
cut-off
frequency
of
about
200
c/s.
The
signal
was
then
amplified
by
operational
amplifier
circuits
with
a
d.c.
gain
of
500.
At
frequencies
between
0
and
100
c/s,
the
total
delay
of
the
signal
due
to
filtering
and
amplification
was
less
than
1
msec
and
the
gain
varied
less
than
1
%.
This
arrangement
allowed
a
measurement
of
contractile
force
but
not
of
the
resting
tension
of
the
preparation.
The
sensitivity
was
such
that
forces
as
small
as
0-05
mg
could
be
detected.
The
transducer
was
calibrated
with
a
series
of
known
weights.
(ii)
A
second
transducer
(T2)
was
horizontally
mounted
on
the
edge
of
one
side
compartment
and
tightly
connected
to
the
neighbouring
end
of
the
preparation
by
means
of
the
thread
used
for
ligation.
A
shift
of
the
end
caused
a
change
in
the
in-
ductance
of
a
differential
coil
incorporated
in
a
carrier
frequency
bridge
(HBM
Q
11)
operating
at
5000
c/s.
The
mechanical
resonance
frequency
of
the
transducer
was
90
c/s
and
the
compliance
was
such
that
a
shift
of
4
jtm
was
equivalent
to
an
acting
force
of
100
mg.
The
output
of
the
bridge
circuit
was
amplified,
filtered,
and
rectified
resulting
in
a
signal
which
was
proportional
to
the
absolute
value
of
the
external
force.
This
transducer
was
used
for
measuring
the
resting
tension
(preload)
of
the
preparation
as
well
as
the
extra
tension
produced
by
a
contraction.
Usually
the
pre-
load
was
adjusted
between
50
and
100
mg
in
order
to
obtain
a
maximal
twitch
during
stimulation.
The
resolving
power
of
the
arrangement
was
about
0-25
mg.
Neither
of
the
methods
described
above
is
quite
satisfactory
since
the
exact
nature
of
the
tension
measured
is
difficult
to
interpret.
The
main
difficulty
lies
in
the
fact
that
the
'boundary
conditions'
of the
central
segment
cannot
be
stated
un-
equivocally.
Obviously
the
mechanical
response
of
the
central
portion
is
of
a
type
to
be
classified
between
an
isometric
and
an
isotonic
contraction,
i.e.
shortening
accom-
panied
by
development
of
tension.
Under
these
conditions
the
contractile
force
will
be
smaller
than
in
the
case
of
an
isometric
contraction.
In
arrangement
(i),
only
a
fraction
of
the
tension
developed
will
be
recorded
since
the
attachment
of
the
needle
includes
merely
a
superficial
spot
rather
than
the
entire
cross-section
of
the
prepara-
tion.
In
arrangement
(ii),
the
contractile
force
produced
by
the
central
segment
is
effective
as
a
whole
and
is
transmitted
to
the
transducer
via
elastic
waves
travelling
along
the
resting
part
of
the
preparation.
Since
the
velocity
of
propagation,
as
cal-
culated
from
the
elasticity
of
muscle
tissue,
is
in
the
order
of
10
m/sec
and
the
main
frequencies
involved
in
muscle
contraction
are
not
larger
than
10
c/s,
the
phase
lag
is
expected
to
be
very
small.
However,
there
might
be
a
frequency-dependent
distor-
tion
in
amplitude.
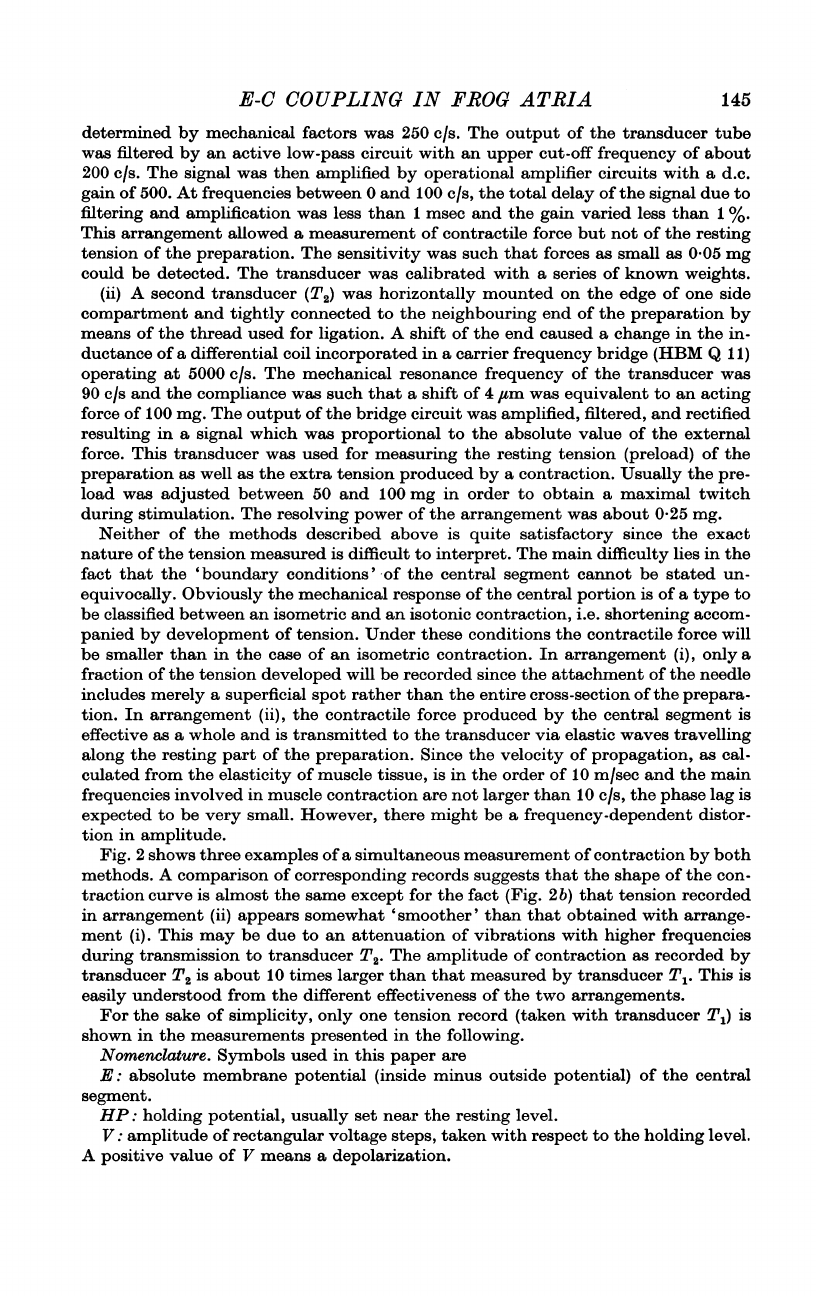
Fig.
2
shows
three
examples
of
a
simultaneous
measurement
of
contraction
by
both
methods.
A
comparison
of
corresponding
records
suggests
that
the
shape
of the
con-
traction
curve
is
almost
the
same
except
for
the
fact
(Fig.
2
b)
that
tension
recorded
in
arrangement
(ii)
appears
somewhat
'smoother'
than
that
obtained
with
arrange-
ment
(i).
This
may
be
due
to
an
attenuation
of
vibrations
with
higher
frequencies
during
transmission
to
transducer
T2.
The
amplitude
of
contraction
as
recorded
by
transducer
T2
is
about
10
times
larger
than
that
measured
by
transducer
T1.
This
is
easily
understood
from
the
different
effectiveness
of
the
two
arrangements.
For
the
sake
of
simplicity,
only
one
tension
record
(taken
with
transducer
T1)
is
shown
in
the
measurements
presented
in
the
following.
Nomenclature.
Symbols
used
in
this
paper
are
E:
absolute
membrane
potential
(inside
minus
outside
potential)
of
the
central
segment.
HP:
holding
potential,
usually
set
near
the
resting
level.
V:
amplitude
of
rectangular
voltage
steps,
taken
with
respect
to
the
holding
level.
A
positive
value
of
V
means
a
depolarization.
146
H.
M.
EINWACHTER,
H.
G.
HAAS
AND
R.
KERN
I:
membrane
current
of
the
central
segment,
specified
by
subscripts
denoting
different
ion
species.
The
sign
of
I
is
positive
for
an
outward
flow
of
cations.
Confusion
might
arise
over
the
meaning
of
the
word
'twitch'
in
this
paper.
Its
meaning
here
is
twofold.
In
connexion
with
voltage
clamp
data
it
denotes
a
transient
(phasic)
contraction
which
fully
relaxes
even
if
depolarization
is
maintained
(cf.
Fig.
8b).
In
the
conventional
sense
it is
used
for
the
contraction
associated
with
an
action
potential.
These
two
meanings
must
be
distinguished
since
the
twitch
initiated
by
a
frog
atrial
action
potential
is
likely
to
include
a
large
component
of
tonic
con-
traction
(see
Discussion).
b
C
80
mV[
ILJ
Fig.
2.
Membrane
current
(top
tracings)
and
tension
(middle
tracings)
during
depolarizing
clamps
of
different
amplitude
and
duration
(bottom
tracings).
Records
from
a
frog
atrial
bundle
in
normal
Ringer
fluid.
HP
=
-70
mV.
Tension
(T)
was
recorded
simultaneously
by
transducer
Tl
(lower
contraction
curve)
and
T2
(upper
curve),
the
calibration
being
2
and
20
mg,
respectively.
Time
calibration
is
400
msec
in
a
and
2
sec
in
b
and
c.
In
this
and
all
subsequent
Figures,
depolarization
and
outward
cur-
rent
are
shown
as
upward
deflexions.
The
contraction
is
'phasic'
in
a,
'tonic'
in
c,
and mixed
in
b.
E-C
COUPLING
IN
FROG
ATRIA
RESULTS
Action
potential
and
contraction
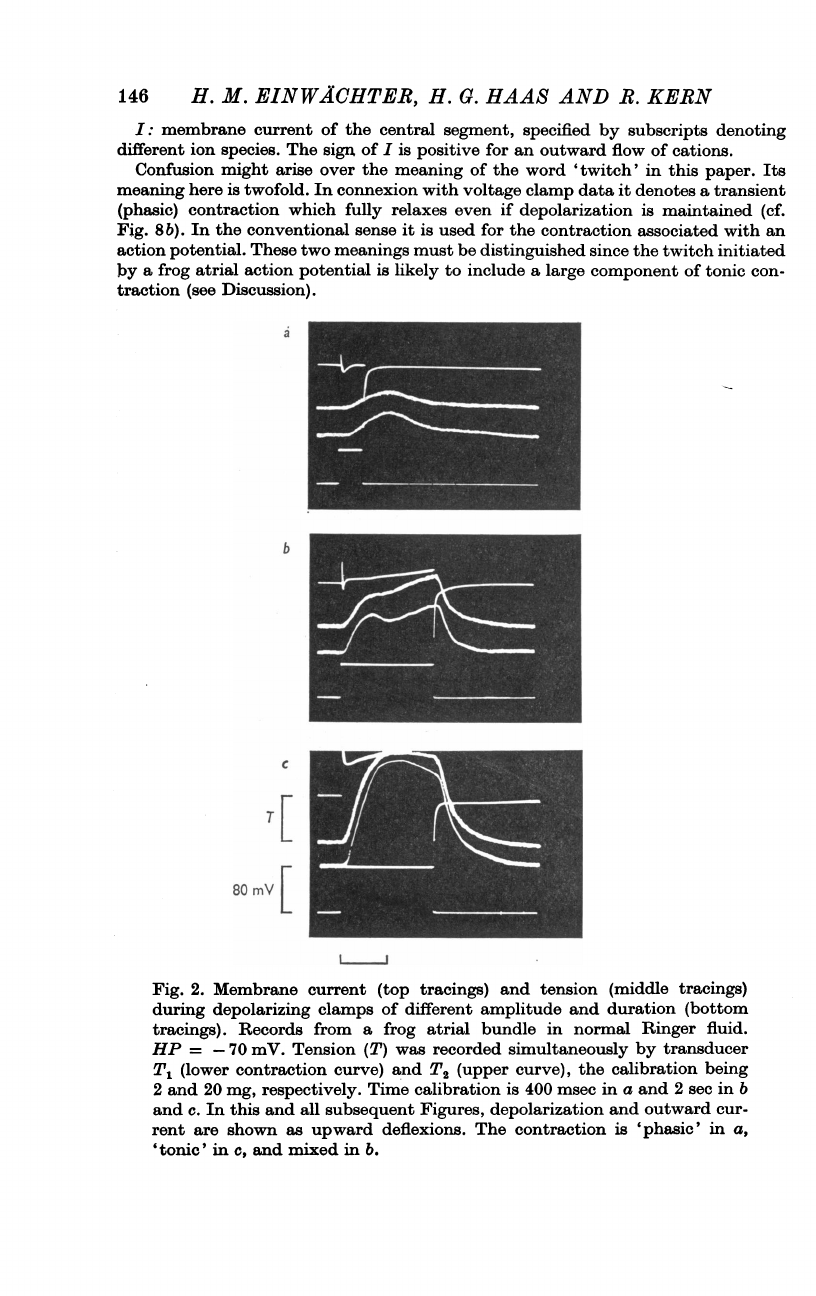
Fig.
3
shows
the
configuration
of
action
potential
and
contraction
normally
encountered
in
frog
atria
under
sucrose
gap
conditions.
The
relation
looks
similar
to
that
obtained
with
strips
of
frog
ventricle
using
micro-electrodes
(Ltittgau
&
Niedergerke,
1958;
Orkand,
1968).
The
up-
stroke
of
the
action
potential
exhibits
two
distinct
phases
(Antoni
&
Delius,
1965;
Hagiwara
&
Nakajima,
1966;
Niedergerke
&
Orkand,
1966),
b
5OmV[
10
V/sec
C
Fig.
3.
Action
potential
and
contraction
recorded
at
slow
(a)
and
fast
(b)
sweep
speed.
The
bottom
tracing
in
b
shows
the
rising
velocity
of
the
action
potential.
Time
scale
is
400
msec
in
a
and
50
msec
in
b.
the
first
phase
being
associated
with
a
fast
(Na)
inward
current,
the
second
with
a
slow
inward
current
which
is
supposed
to
be
carried
by
Ca
ions,
possibly
in
competition
with
Na
ions
(Rougier,
Vassort,
Garnier,
Gargouil
&
Coraboeuf,
1969).
The
electromechanical
latency
is
in
the
order
of
50
msec.
Peak
tension
occurs
shortly
after
termination
of
the
plateau
of
the
action
potential.
Relaxation
outlasts
the
repolarization
process
by
a
few
hundred
msec.
I
2
mg
147
148
H.
M.
EINWI4CHTER,
H.
G.
HAAS
AND
R.
KERN
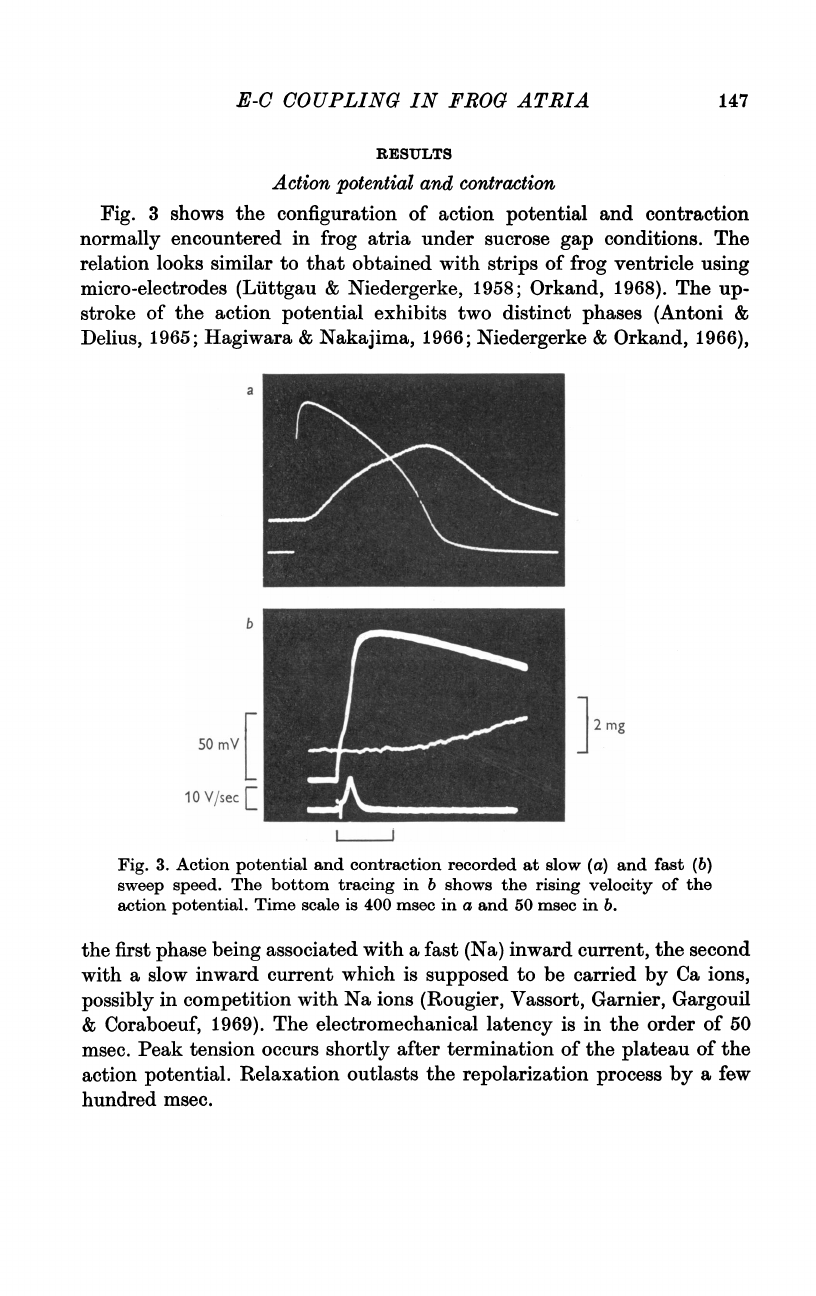
Transient
inward
currents
during
voltage
clamp
In
this
paper
the
determination
of
the
slow
(Ca/Na)
inward
current
is
of
particular
interest.
For
the
sake
of
simplicity,
the
current
will
be
referred
to
as
Ca
inward
current,
Aca.
As
pointed
out
previously
(Haas
et
al.
1971;
Tarr,
1971)
the
slow
inward
current
is
usually
small
relative
to,
and
often
superimposed
on,
the
fast
Na
inward
current,
INa,
so
that
a
quantitative
determination
may
be
difficult.
Fig.
4
illustrates
various
configurations
of
the
two
currents.
In
all
records
a
large
Na
current
occurs
with
a
time
to
peak
of
about
10
msec
and
a
time
constant
of
inactivation
in
the
order
of
5
msec.
In
Fig.
4a
a
second
inward
current
is
not
seen.
In
Fig.
4b
slow
inward
current
occurs
as
a
distinct
wave
completely
separate
from
the
fast
Na
inward
current
and
in
c
it
shows
up
as
a
flat
prolongation
of
the
a
,A_
b
2
mg
[
C
80
mv[
500
msec
Fig.
4.
Membrane
current
(upper
beam)
and
contraction
(middle
beam)
associated
with
step
depolarizations
of
20,
30,
and
70
mV
amplitude
(lower
beam).
HP
=
-70
mV.
Early
transient
Na
current
is
shown
as
a
down-
ward
spike.
E-C
COUPLING
IN
FROG
ATRIA
falling
phase
of
the
Na
current.
The
latter
type
was
most
frequently
met
in
our
investigations.
A
separate
demonstration
of
slow
inward
current
may
be
accomplished
by
a
preceding
inactivation
of
the
Na
system
using
a
double
step
arrangement
(cf.
Fig.
6).
Time
and
voltage
dependence
of
slow
inward
current
varied
considerably
from
one
preparation
to
another.
In
normal
Ringer
fluid
the
apparent
duration
of
a
slow
inward
current
wave
(as
measured
from
the
make
of
the
clamp)
was
between
80
and
200
msec.
These
figures
do
not
account
for
a
possible
maintenance
of
increased
Ca
membrane
conductance,
gca,
which
may
persist
after
inactivation
of
the
Ca
system
during
prolonged
depolarizations.
The
threshold
potential
for
initiation
of
slow
inward
current
was
5-20
mV
higher
than
that
of
the
fast
Na
current.
Slow
current
amplitude
was
maximal
in
the
range
between
0
and
+20
mV
membrane
potential.
A
reversal
potential
could
not
be
detected,
probably
because
slow
inward
current
was
obscured
by
large
components
of
outward
current
at
strong
depolarizations.
Membrane
current
and
contraction
in
normal
Ringer
fluid
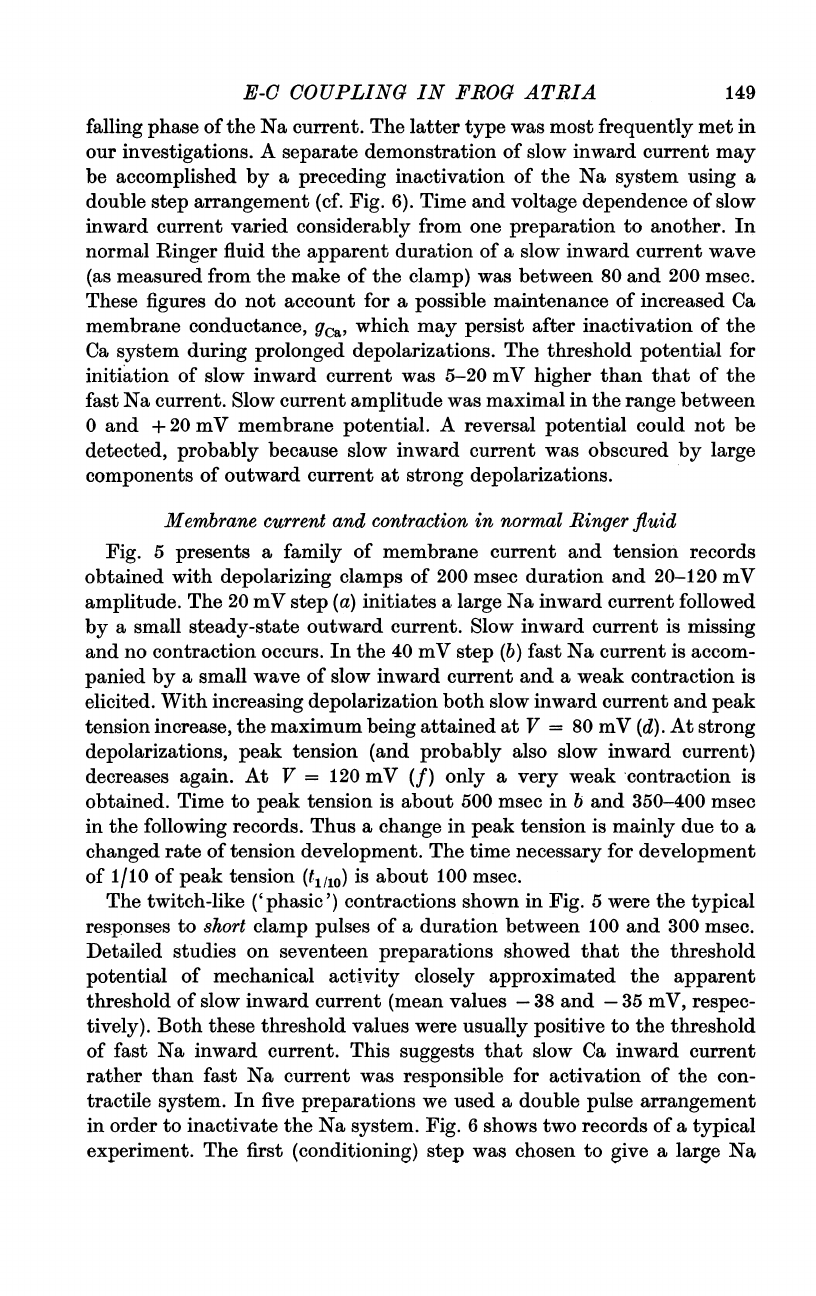
Fig.
5
presents
a
family
of
membrane
current
and
tension
records
obtained
with
depolarizing
clamps
of
200
msec
duration
and
20-120
mV
amplitude.
The
20
mV
step
(a)
initiates
a
large
Na
inward
current
followed
by
a
small
steady-state
outward
current.
Slow
inward
current
is
missing
and
no
contraction
occurs.
In
the
40
mV
step
(b)
fast
Na
current
is
accom-
panied
by
a
small
wave
of
slow
inward
current
and
a
weak
contraction
is
elicited.
With
increasing
depolarization
both
slow
inward
current
and
peak
tension
increase,
the
maximum
being
attained
at
V
=
80
mV
(d).
At
strong
depolarizations,
peak
tension
(and
probably
also
slow
inward
current)
decreases
again.
At
V
=
120
mV
(f)
only
a
very
weak
contraction
is
obtained.
Time
to
peak
tension
is
about
500
msec
in
b
and
350-400
msec
in
the
following
records.
Thus
a
change
in
peak
tension
is
mainly
due
to
a
changed
rate
of
tension
development.
The
time
necessary
for
development
of
1/10
of
peak
tension
(t,110)
is
about
100
msec.
The
twitch-like
phasicic')
contractions
shown
in
Fig.
5
were
the
typical
responses
to
short
clamp
pulses
of
a
duration
between
100
and
300
msec.
Detailed
studies
on
seventeen
preparations
showed
that
the
threshold
potential
of
mechanical
activity
closely
approximated
the
apparent
threshold
of
slow
inward
current
(mean
values
-38
and
-35
mV,
respec-
tively).
Both
these
threshold
values
were
usually
positive
to
the
threshold
of
fast
Na
inward
current.
This
suggests
that
slow
Ca
inward
current
rather
than
fast
Na
current
was
responsible
for
activation
of
the
con-
tractile
system.
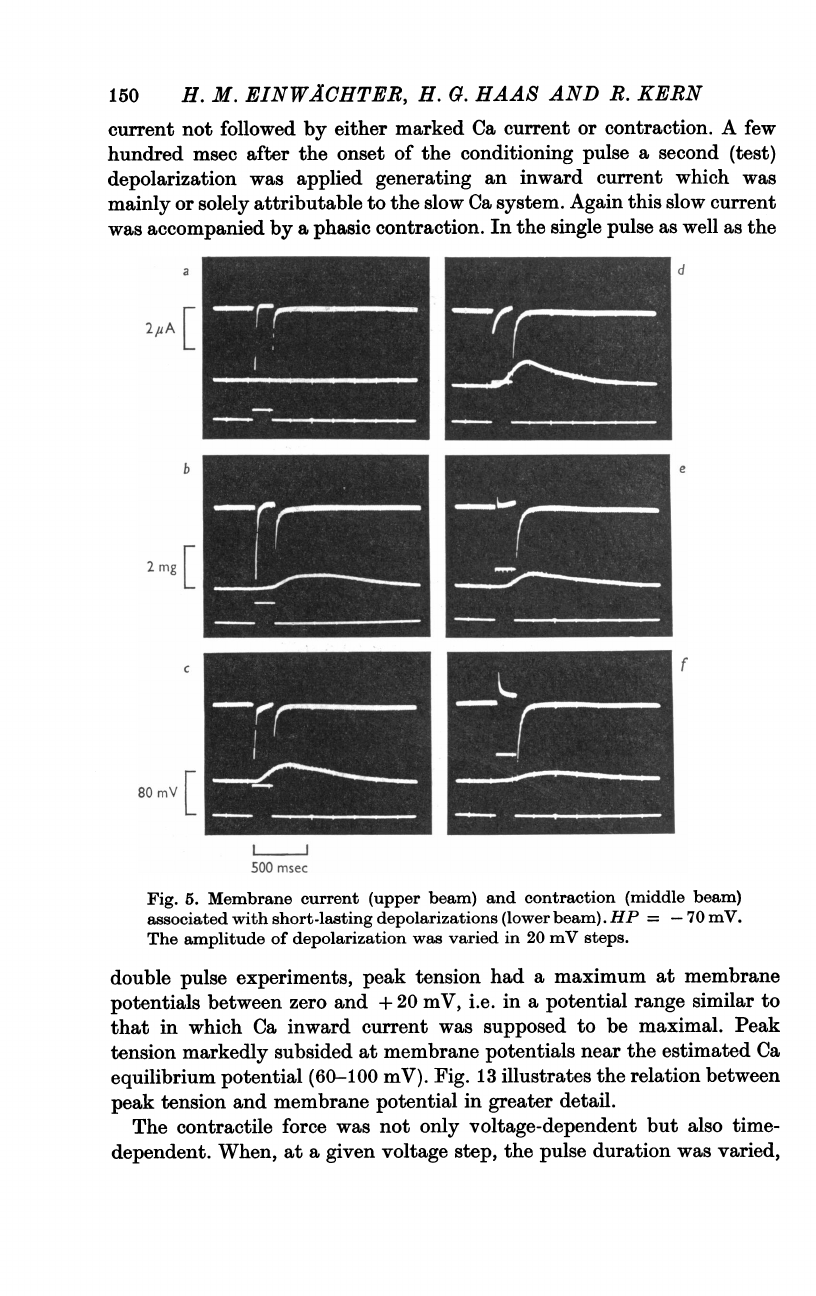
In
five
preparations
we
used
a
double
pulse
arrangement
in
order
to
inactivate
the
Na
system.
Fig.
6
shows
two
records
of
a
typical
experiment.
The
first
(conditioning)
step
was
chosen
to
give
a
large
Na
149
150
H.
M.
EINWICHTER,
H.
G.
HAAS
AND
R.
KERN
current
not
followed
by
either
marked
Ca
current
or
contraction.
A
few
hundred
msec
after
the
onset
of
the
conditioning
pulse
a
second
(test)
depolarization
was
applied
generating
an
inward
current
which
was
mainly
or
solely
attributable
to
the
slow
Ca
system.
Again
this
slow
current
was
accompanied
by
a
phasic
contraction.
In
the
single
pulse
as
well
as
the
a
2#A
[
b
2rng
[
C
80
mY
[
d
500
msec
Fig.
5.
Membrane
current
(upper
beam)
and
contraction
(middle
beam)
associated
with
short-lasting
depolarizations
(lower
beam).
HP
=
-70
mY.
The
amplitude
of
depolarization
was
varied
in
20
mY
steps.
double
pulse
experiments,
peak
tension
had
a
maximum
at
membrane
potentials
between
zero
and
+
20
mV,
i.e.
in
a
potential
range
similar
to
that
in
which
Ca
inward
current
was
supposed
to
be
maximal.
Peak
tension
markedly
subsided
at
membrane
potentials
near
the
estimated
Ca
equilibrium
potential
(60-100
mV).
Fig.
13
illustrates
the
relation
between
peak
tension
and
membrane
potential
in
greater
detail.
The
contractile
force
was
not
only
voltage-dependent
but
also
time-
dependent.
When,
at
a
given
voltage
step,
the
pulse
duration
was
varied,
f
E-C
COUPLING
IN
FROG
ATRIA
a
minimal
time
of
depolarization
between
40
and
70
msec
was
required
to
produce
any
detectable
contraction
(Figs.
7
and
9).
This
time
was
com-
parable
to,
although
somewhat
longer
than,
the
time
necessary
for
turn
on
of
slow
inward
current.
With
increasing
pulse
duration
peak
tension
increased
gradually
and
a
maximal
twitch
was
obtained
with
pulses
of
a
2
mg
L
b
80
mV
[
L~
500
msec
Fig.
6.
Double
step
voltage
clamps
used
for
separation
of
fast
Na
and
slow
Ca
inward
current.
Upper
beam:
membrane
current;
middle
beam:
con-
traction;
lower
beam:
membrane
potential.
HP
=
-70
mV.
The
con-
ditioning
step
was
32
mV
in
amplitude
and
lasted
about
500
msec,
thus
producing
an
almost
complete
steady-state
inactivation
of
the
Na
system
(Haas
et
al.
1971).
The
test
step
was
30
mV
in
a
and
55
mV
in
b.
200-300
msec
duration.
In
general,
the
time
of
depolarization
necessary
for
full
activation
of
a
phasic
contraction
was
slightly
longer
than
the
apparent
duration
of
the
corresponding
inward
current
wave
(cf.
Figs.
5
and
9).
A
type
of
contraction
obviously
different
from
a
twitch
was
observed
when
long-lasting
pulses
were
applied.
Fig.
8
shows
membrane
currents
151

152
H.
M.
EINWACHTER,
H.
G.
HAAS
AND
1.
KERN
and
contractions
associated
with
voltage
steps
of
the
same
amplitudes
as
in
Fig.
5
but
a
duration
of
2
see
rather
than
200
msec.
Again
the
20
mV
step
(a)
does
not
produce
any
tension.
The
40
mV
step
(b)
generates
a
phasic
contraction
somewhat
stronger
than,
but
in
its
time
course
similar
to,
the
corresponding
contraction
in
Fig.
5.
Relaxation
of
tension
is
almost
com-
plete
at
the
end
of
the
clamp.
At
V
=
60
mV
(c)
the
rising
slope
of
the
con-
traction
curve
has
a
breakpoint
and
relaxation
is
incomplete.
In
the
80
mV
clamp
(d)
a
distinct
delay
in
relaxation
is
seen.
At
strong
depolarizations
(e
and
f)
tension
is
maintained
at
a
constant
level
or
even
increases
during
the
entire
duration
of
the
clamp.
a
b
C
d
2
mg
[
500
msec
Fig.
7.
Influence
of
clamp
duration
on
peak
tension.
HP
=
-70
mV;
voltage
step
80
mV.
Pulse
duration
was
50,
65,
120,
and
215
msec
in
a-d.
Upper,
middle,
and
lower
beam:
membrane
current,
tension,
and
voltage,
respectively.
Interrupted
lines
are
used
to
indicate
make
and
break
of
the
clamp
pulses.
Records
similar
to
those
in
Fig.
8
were
obtained
in
twenty
preparations
using
clamp
durations
between
1
and
3
sec.
Formally
this
contractile
behaviour
may
be
explained
by
assuming
a
'tonic'
component
of
con-
traction
which
requires
a
rather
long
time
to
become
activated
and
super-
imposes
on
the
phasic
contraction.
Fig.
2b
gives
an
example
where
phasic
and
tonic
component
of
contraction
are
distinguished
by
an
incision
of
the
contraction
curve.
This
time
course
of
contraction
is
very
similar
to
that
observed
in
calf
or
sheep
ventricular
fibres
in
response
to
long-lasting
con-
stant
current
pulses
(Wood
et
al.
1969).
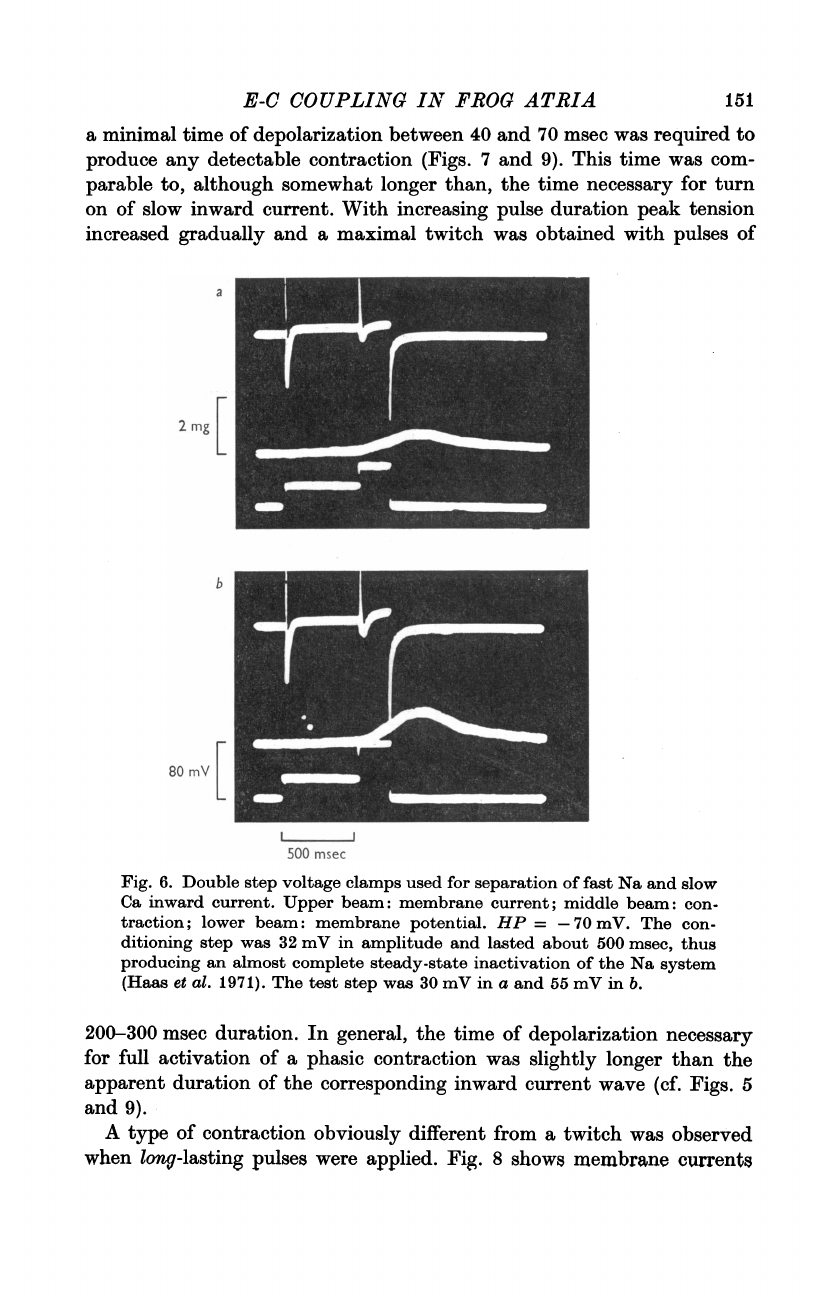
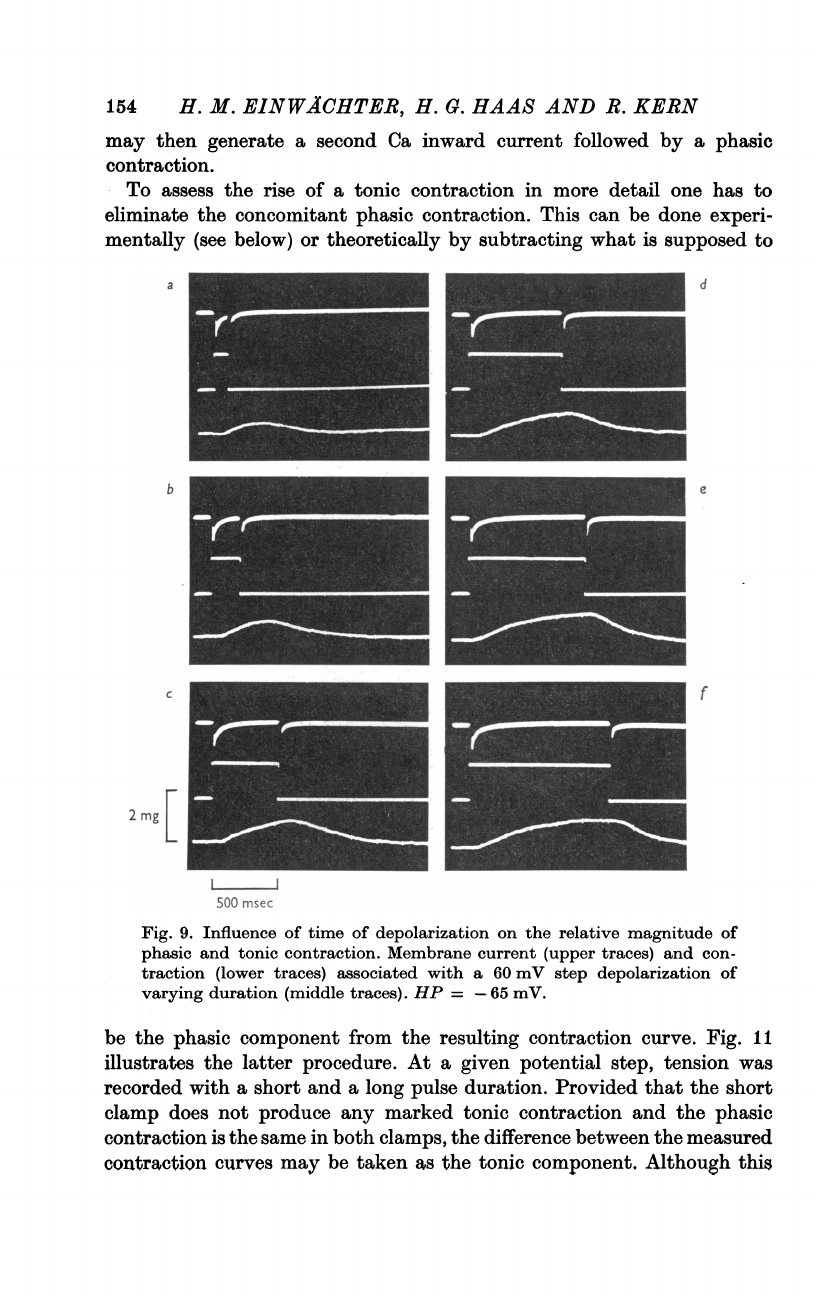
Fig.
9
shows
the
development
of
a
tonic
contraction
with
increasing
time
of
depolarization,
With
pulses
of
E-C
COUPLING
IN
FROG
ATRIA
80
and
200
msec
duration
(a
and
b)
the
contraction
is
mainly
phasic
and
time
to
peak
is
350-400
msec.
With
longer
pulses
(c-f)
the
shape
of
the
contraction
curve
changes
to
give
a
continuous
rise
during
the
clamp.
This
is
due
to
a
progressive
preponderance
of
the
tonic
component.
d
2fA
[
b
2
mg
[
C
80
mV
[
1000
msec
Fig.
8.
Membrane
current
(upper
traces)
and
contraction
(middle
traces)
during
long-lasting
depolarizations
(lower
traces).
Same
preparation
as
in
Fig.
5.
In
most
preparations
the
relaxation
of
a
tonic
contraction
was
a
smooth
decay
(concave
upward)
from
the
tension
attained
at
the
end
of
the
clamp.
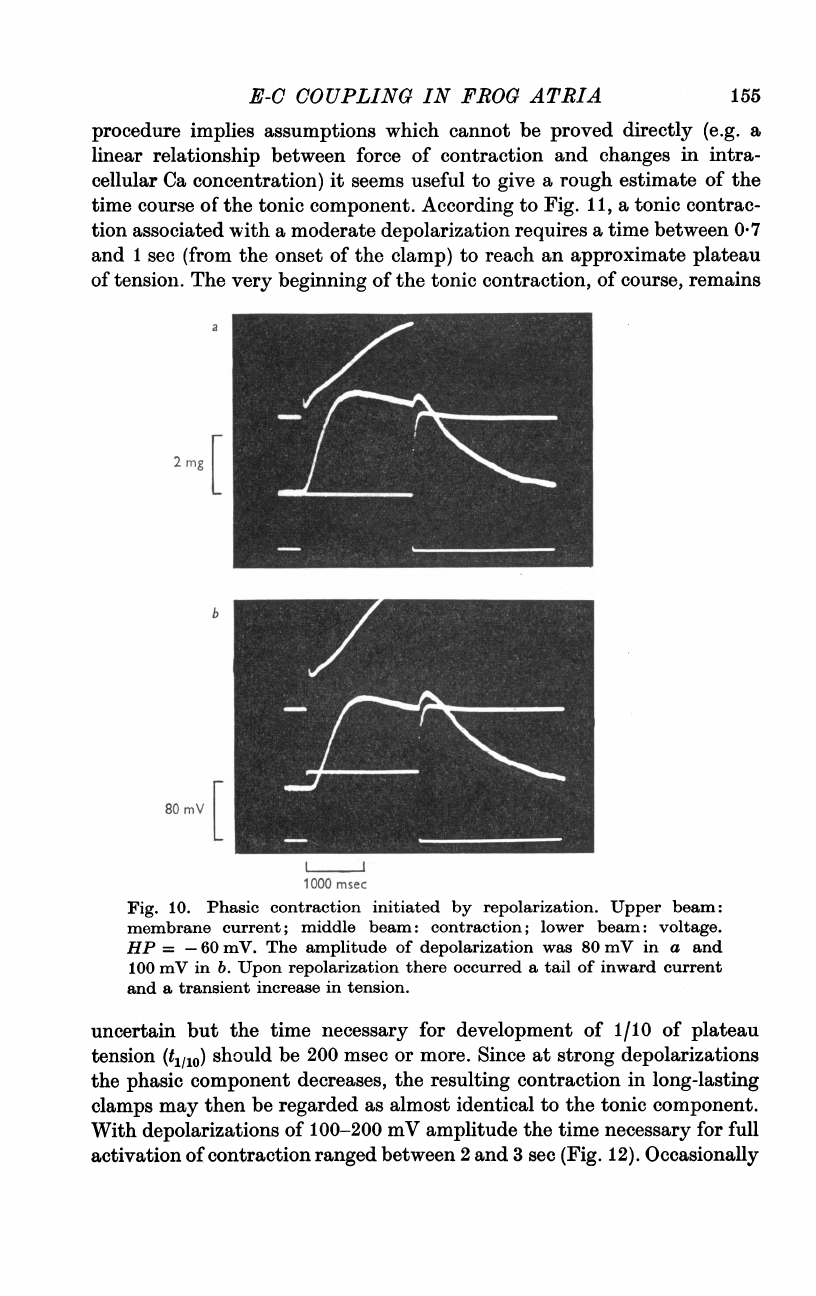
Occasionally
the
break
of
the
clamp
caused
a
phasic
contraction
super-
imposing
on
the
relaxation
of
the
preceding
tonic
contraction
(Fig.
10).
This
break
response
may
be
interpreted
in
the
following
way.
Suppose
a
depolarizing
clamp
initiates
a
transient
Ca
inward
current
and
a
residual
increase
in
gea
persists
after
inactivation
throughout
the
clamp.
A
sudden
repolarization
which
is
equivalent
to
an
increased
driving
force
for
Ca
ions
f
153
154
H.
M.
EINWACHTER,
H.
G.
HAAS
AND
R.
KERN
may
then
generate
a
second
Ca
inward
current
followed
by
a
phasic
contraction.
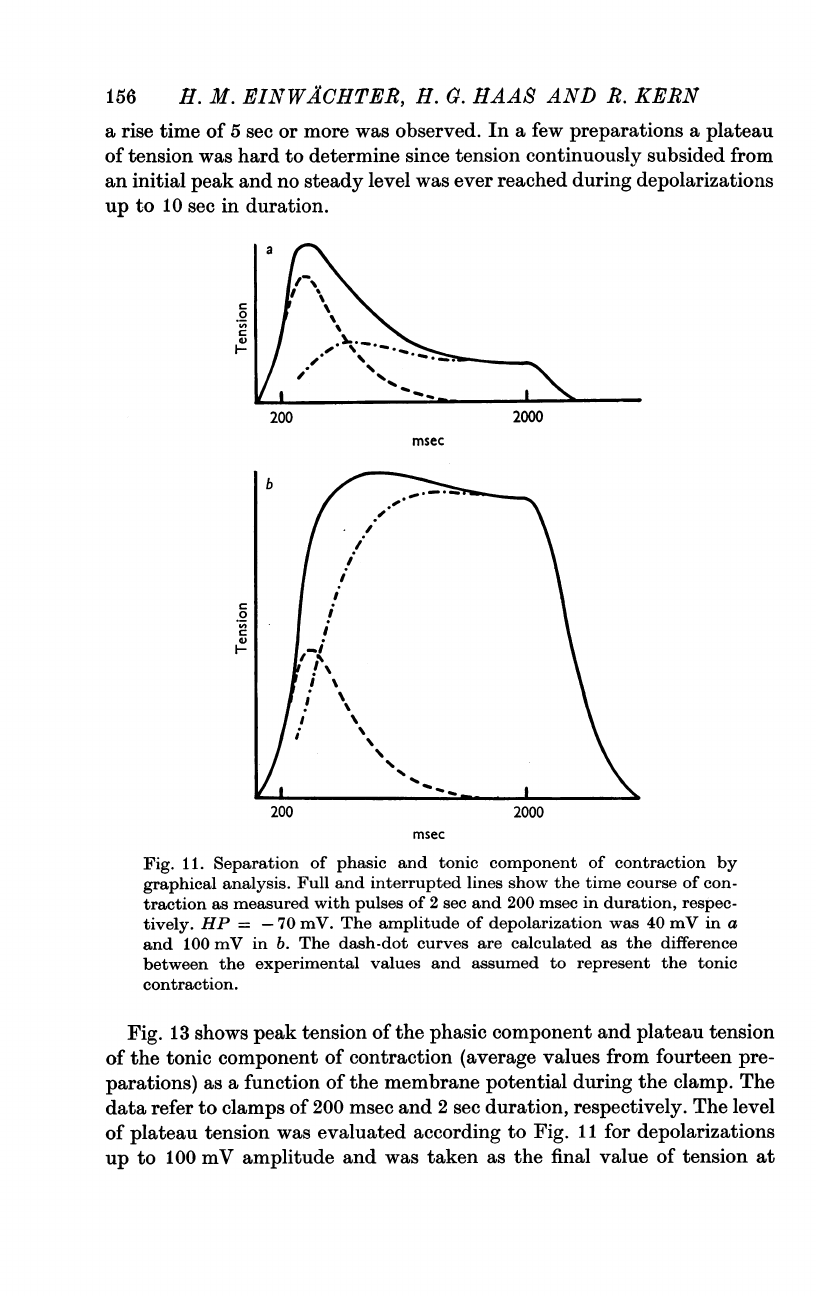
To
assess
the
rise
of
a
tonic
contraction
in
more
detail
one
has
to
eliminate
the
concomitant
phasic
contraction.
This
can
be
done
experi-
mentally
(see
below)
or
theoretically
by
subtracting
what
is
supposed
to
b
C
2
mg[
d
f
IJ
500
msec
Fig.
9.
Influence
of
time
of
depolarization
on
the
relative
magnitude
of
phasic
and
tonic
contraction.
Membrane
current
(upper
traces)
and
con-
traction
(lower
traces)
associated
with
a
60
mV
step
depolarization
of
varying
duration
(middle
traces).
HP
=
-65
mV.
be
the
phasic
component
from
the
resulting
contraction
curve.
Fig.
11
illustrates
the
latter
procedure.
At
a
given
potential
step,
tension
was
recorded
with
a
short
and
a
long
pulse
duration.
Provided
that
the
short
clamp
does
not
produce
any
marked
tonic
contraction
and
the
phasic
contraction
is
the
same
in
both
clamps,
the
difference
between
the
measured
contraction
curves
may
be
taken
as
the
tonic
component.
Although
this
F-C
COUPLING
IN
FROG
ATRIA
procedure
implies
assumptions
which
cannot
be
proved
directly
(e.g.
a
linear
relationship
between
force
of
contraction
and
changes
in
intra-
cellular
Ca
concentration)
it
seems
useful
to give
a
rough
estimate
of
the
time
course
of
the
tonic
component.
According
to
Fig.
11,
a
tonic
contrac-
tion
associated
with
a
moderate
depolarization
requires
a
time
between
07
and
1
sec
(from
the
onset
of
the
clamp)
to
reach
an
approximate
plateau
of
tension.
The
very
beginning
of
the
tonic
contraction,
of
course,
remains
a
2
rng
b
80
nV[
1000
msec
Fig.
10.
Phasic
contraction
initiated
by
repolarization.
Upper
beam:
membrane
current;
middle
beam:
contraction;
lower
beam:
voltage.
HP
=
-60
mV.
The
amplitude
of
depolarization
was
80
mV
in
a
and
100
mV
in
b.
Upon
repolarization
there
occurred
a
tail
of
inward
current
and
a
transient
increase
in
tension.
uncertain
but
the
time
necessary
for
development
of
1/10
of
plateau
tension
(t,110)
should
be
200
msec
or
more.
Since
at
strong
depolarizations
the
phasic
component
decreases,
the
resulting
contraction
in
long-lasting
clamps
may
then
be
regarded
as
almost
identical
to
the
tonic
component.
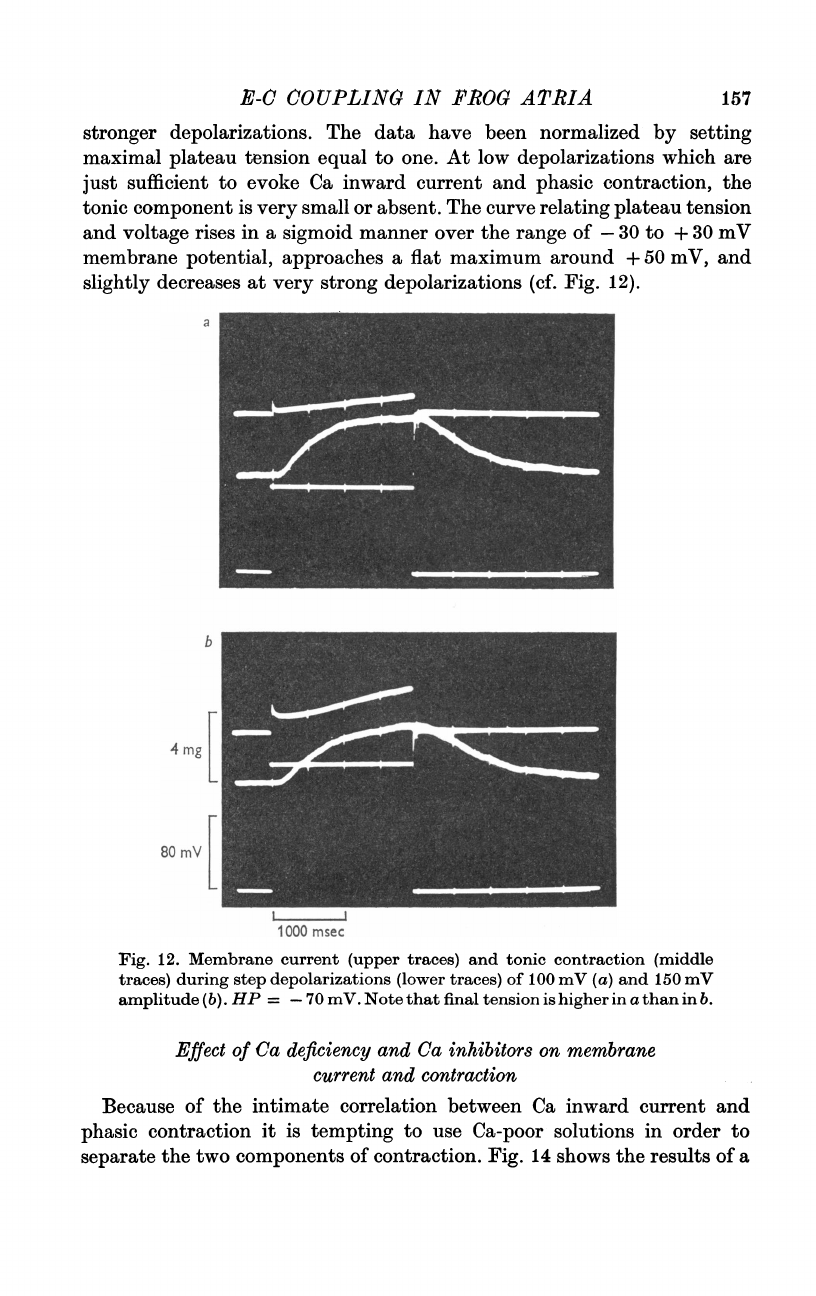
With
depolarizations
of
100-200
mV
amplitude
the
time
necessary
for
full
activation
of
contraction
ranged
between
2
and
3
sec
(Fig.
12).
Occasionally
155
156
H.
M.
EINWWACHTER,
H.
G.
HAAS
AND
R.
KERN
a
rise
time
of
5
see
or
more
was
observed.
In
a
few
preparations
a
plateau
of
tension
was
hard
to
determine
since
tension
continuously
subsided
from
an
initial
peak
and
no
steady
level
was
ever
reached
during
depolarizations
up
to
10
see
in
duration.
0
200
2000
msec
b
200
2000
msec
Fig.
11.
Separation
of
phasic
and
tonic
component
of
contraction
by
graphical
analysis.
Full
and
interrupted
lines
show
the
time
course
of
con-
traction
as
measured
with
pulses
of
2
see
and
200
msec
in
duration,
respec-
tively.
HP
=
-70
mV.
The
amplitude
of
depolarization
was
40
mV
in
a
and
100
mV
in
b.
The
dash-dot
curves
are
calculated
as
the
difference
between
the
experimental
values
and
assumed
to
represent
the
tonic
contraction.
Fig.
13
shows
peak
tension
of
the
phasic
component
and
plateau
tension
of
the
tonic
component
of
contraction
(average
values
from
fourteen
pre-
parations)
as
a
function
of
the
membrane
potential
during
the
clamp.
The
data
refer
to
clamps
of
200
msec
and
2
see
duration,
respectively.
The
level
of
plateau
tension
was
evaluated
according
to
Fig.
11
for
depolarizations
up
to
100
mV
amplitude
and
was
taken
as
the
final
value
of
tension
at
E-C
COUPLING
IN
FROG
ATRIA
stronger
depolarizations.
The
data
have
been
normalized
by
setting
maximal
plateau
tension
equal
to
one.
At
low
depolarizations
which
are
just
sufficient
to
evoke
Ca
inward
current
and
phasic
contraction,
the
tonic
component
is
very
small
or
absent.
The
curve
relating
plateau
tension
and
voltage
rises
in
a
sigmoid
manner
over
the
range
of
-30
to
+
30
mV
membrane
potential,
approaches
a
flat
maximum
around
+50
mV,
and
slightly
decreases
at
very
strong
depolarizations
(cf.
Fig.
12).
b
4
rng
80
m!
1000
msec
Fig.
12.
Membrane
current
(upper
traces)
and
tonic
contraction
(middle
traces)
during
step
depolarizations
(lower
traces)
of
o00
mV
(a)
and
150
mV
amplitude
(b).
HP
=
-70
mV.
Note
that
final
tension
is
higher
in
a
than
in
b.
Effect
of
Ca
deficiency
and
Ca
inhibitors
on
membrane
current
and
contraction
Because
of
the
intimate
correlation
between
Ca
inward
current
and
phasic
contraction
it is
tempting
to
use
Ca-poor
solutions
in
order
to
separate
the
two
components
of
contraction.
Fig.
14
shows
the
results
of
a
17
158
H.
M.
EINWACHTER,
H.
G.
HAAS
AND
R.
KERN
1I0
r-
I
I
I
I
I
I
-80
-60
-40 -20
0
20 40
60
Membrane
potential
(mV)
80 100
120
140
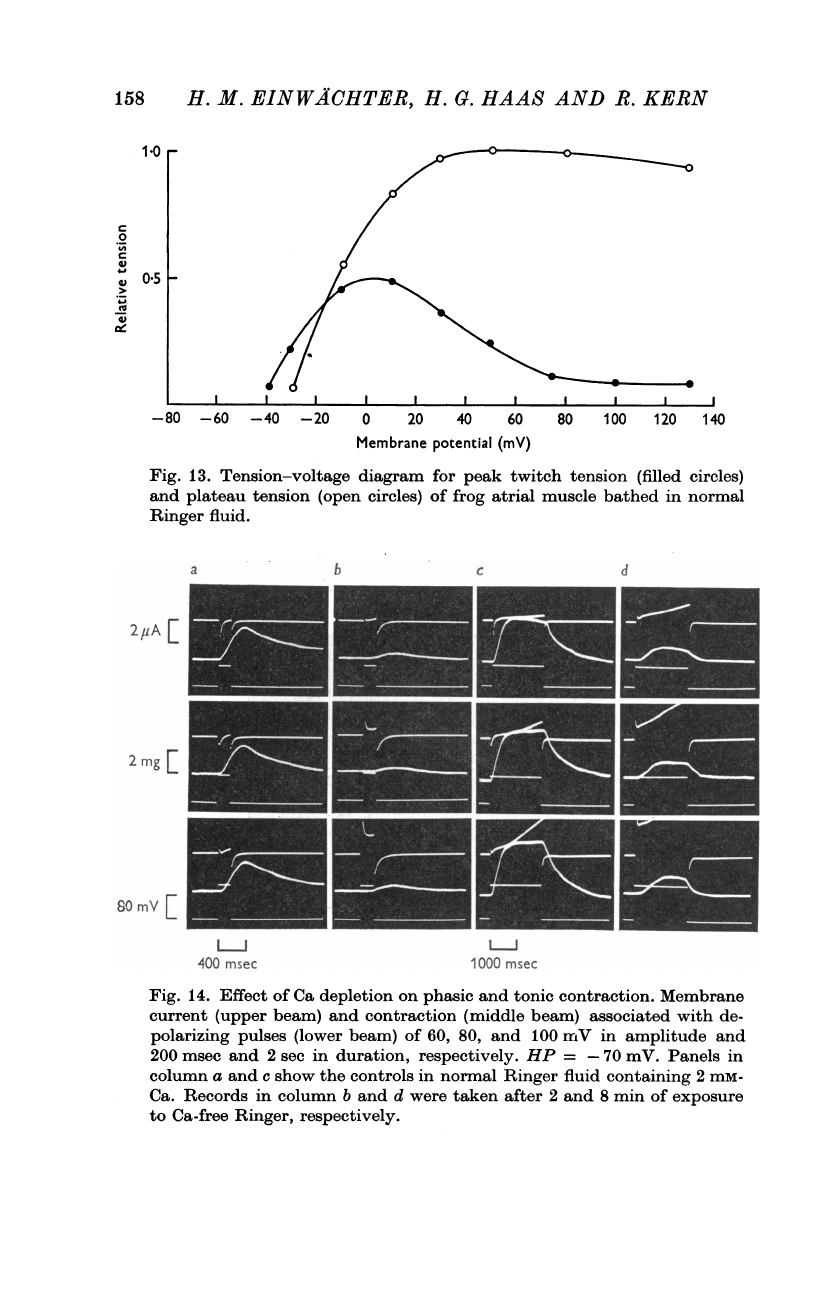
Fig.
13.
Tension-voltage
diagram
for
peak
twitch
tension
(filled
circles)
and
plateau
tension
(open
circles)
of
frog
atrial
muscle
bathed
in
normal
Ringer
fluid.
a
b
d
2fA
2
mg
[
S0
mV
I
LLj
LJ
400
msec
1000
msec
Fig.
14.
Effect
of
Ca
depletion
on
phasic
and
tonic
contraction.
Membrane
current
(upper
beam)
and
contraction
(middle
beam)
associated
with
de-
polarizing
pulses
(lower
beam)
of
60,
80,
and
100
mV
in
amplitude
and
200
msec
and
2
sec
in
duration,
respectively.
HP
=
-70
mV.
Panels
in
column
a
and
c
show
the
controls
in
normal
Ringer
fluid
containing
2
mM-
Ca.
Records
in
column
b
and
d
were
taken
after
2
and
8
min
of
exposure
to
Ca-free
Ringer,
respectively.
C
VI
V
.4
>
0-5
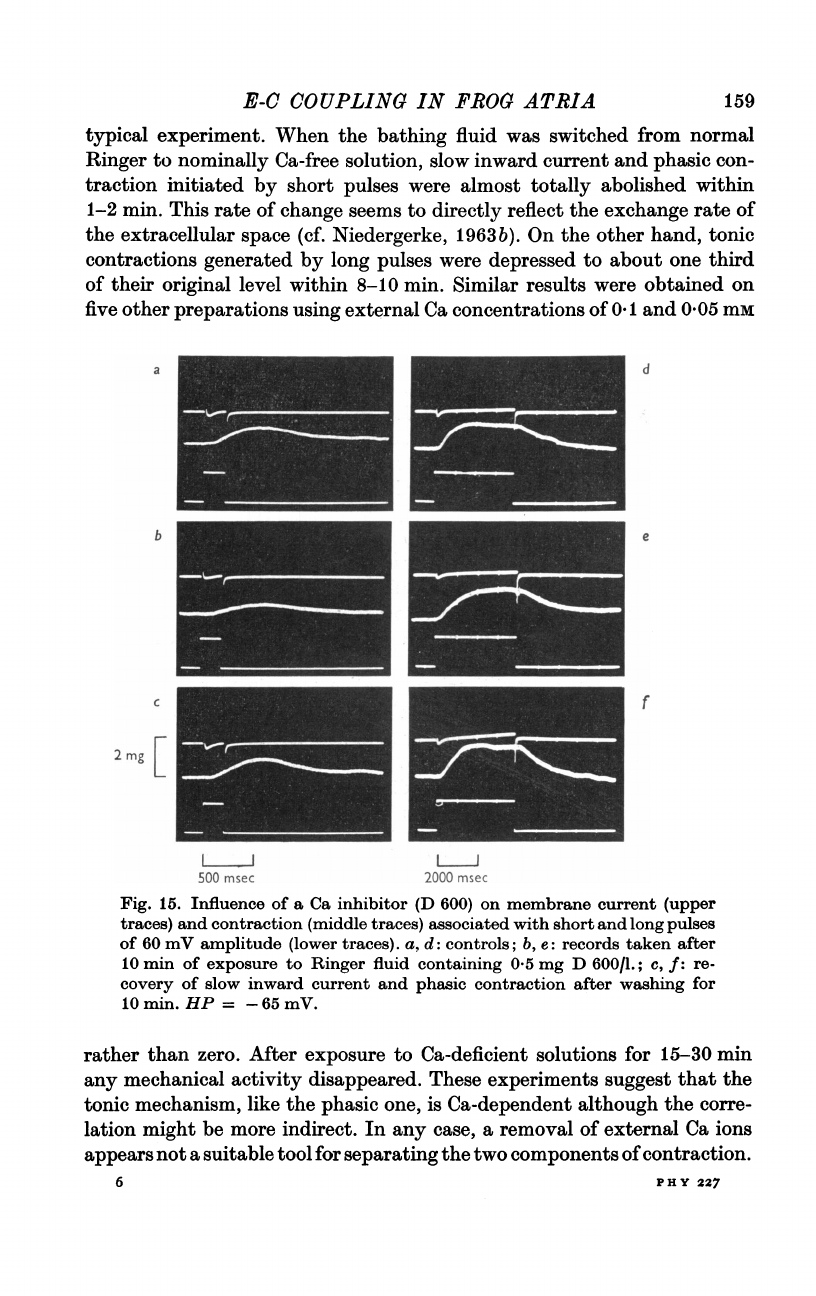
E-C
COUPLING
IN
FROG
ATRIA
typical
experiment.
When
the
bathing
fluid
was
switched
from
normal
Ringer
to
nominally
Ca-free
solution,
slow
inward
current
and
phasic
con-
traction
initiated
by
short
pulses
were
almost
totally
abolished
within
1-2
min.
This
rate
of
change
seems
to
directly
reflect
the
exchange
rate
of
the
extracellular
space
(cf.
Niedergerke,
1963b).
On
the
other
hand,
tonic
contractions
generated
by
long
pulses
were
depressed
to
about
one
third
of
their
original
level
within
8-10
min.
Similar
results
were
obtained
on
five
other
preparations
using
external
Ca
concentrations
of
0-
and
0-05
mm
b
C
2
mg
K
d
e
f
500
msec
2000
msec
Fig.
15.
Influence
of
a
Ca
inhibitor
(D
600)
on
membrane
current
(upper
traces)
and
contraction
(middle
traces)
associated
with
short
and
long
pulses
of
60
mV
amplitude
(lower
traces).
a,
d:
controls;
b,
e:
records
taken
after
10
min
of
exposure
to
Ringer
fluid
containing
0
5
mg
D
600/1.;
c,
f:
re-
covery
of
slow
inward
current
and
phasic
contraction
after
washing
for
l0min.
HP
=
-65mV.
rather
than
zero.
After
exposure
to
Ca-deficient
solutions
for
15-30
min
any
mechanical
activity
disappeared.
These
experiments
suggest
that
the
tonic
mechanism,
like
the
phasic
one,
is
Ca-dependent
although
the
corre-
lation
might
be
more
indirect.
In
any
case,
a
removal
of
external
Ca
ions
appears
not
a
suitable
tool
for
separating
the
two
components
of
contraction.
159
6
F
H
Y
227
160
B.
1.
EINWACHTER,
H.
0.
HAAS
AND
1.
KERN
Another
way
to
eliminate
the
phasic
contraction
is
an
application
of
Ca
inhibitors,
i.e.
agents
which
suppress
the
rise
of
Ca
membrane
conductance
upon-
depolarization.
According
to
Rougier
et
al.
(1969)
addition
of
Mn
ions
to
normal
Ringer
fluid
causes
a
strong
reduction
of
slow
inward
current
without
much
affecting
other
membrane
current
components.
We
did
not
make
use
of
this
procedure
since
the
survival
time
of
our
pre-
parations
was
markedly
shortened
by
Mn.
As
a
more
promising
method,
we
tested
the
action
of
a
Ca-antagonistic
drug
(D
600,
a
synthetic
com-
pound
structurally
related
to
f8-receptor
blocking
agents).
In
Fig.
15a-c
the
effect
of
D
600
on
membrane
current
and
contraction
at
a
fixed
step
depolarization
of
200
msec
duration
is
demonstrated.
Clearly
both
slow
inward
current
and
peak
twitch
tension
underwent
a
strong
reduction
within
a
few
minutes.
This
effect
was
fully
reversible
after
reapplication
of
normal
Ringer
fluid.
Fig.
15d-f
show
analogous
measurements
with
clamps
of
2
sec
duration.
In
these
records
the
only
effect
of
the
drug
was
a
decreased
rising
steepness
of
contraction,
the
final
level
of
tension
being
practically
unchanged.
This
is
what
one
would
expect
from
a
selective
inhibition
of
the
phasic
component
of
contraction.
Measurements
on
four
other
preparations
led
-to
similar
results.
Thus
an
application
of
Ca-
antagonistic
drugs
may
allow
a
separate
study
of the
tonic
contraction.
A
systematic
investigation
of
the
action
of
such
drugs
will
be
described
elsewhere.
Influence
of
repetitive
depolarization
on
contraction
A
well
known
phenomenon
in
mammalian
myocardium
is
that
an
abrupt
change
in
the
action
potential
configuration
does
not
have
an
immediate
influence
on
mechanical
activity
but
a
certain
number
of
altered
action
potentials
is
required
for
the
corresponding
mechanical
change
to
build
up
(Antoni,
Jacob
&
Kaufmann,
1969;
Wood
et
al.
1969).
An
analogous
effect
was
observed
by
Beeler
&
Reuter
(1970c)
in
their
voltage
clamp
studies
on
dog
ventricular
preparations
kept
in
normal
Tyrode
solution.
In
these
experiments
there
was
a
gradual
increase
in
twitch
tension
upon
depolari-
zation
and
maximal
tension
was
attained
after
5-8
identical
clamps
applied
at
intervals
of
a
few
seconds.
In
our
experiments
on
frog
atrial
strips
no
comparable
delay
in
the
development
of
a
mechanical
response
was
seen.
Rather
the
contractile
response
(twitch
tension
as
well
as
sustained
tension)
to
a
given
step
depolarization
was
almost
constant
regardless
of
the
num-
ber
of
pulses
applied,
that
is,
the
effect
was
maximal
upon
the
first
clamp.
Another
problem
which
arises
in
connexion
with
repetitive
depolariza-
tions
is
that
of
superposition
of
single
contractions.
Since
the
time
of
depolarization
required
for
full
activation
of
a
phasic
contraction
is
much
shorter
than
the
contraction
cycle
itself,
a
summation
of
twitch
responses
is
expected
when
short
depolarizing
pulses
are
delivered
in
quick
succes-
E-C
COUPLING
IN
FROG
ATRIA
161
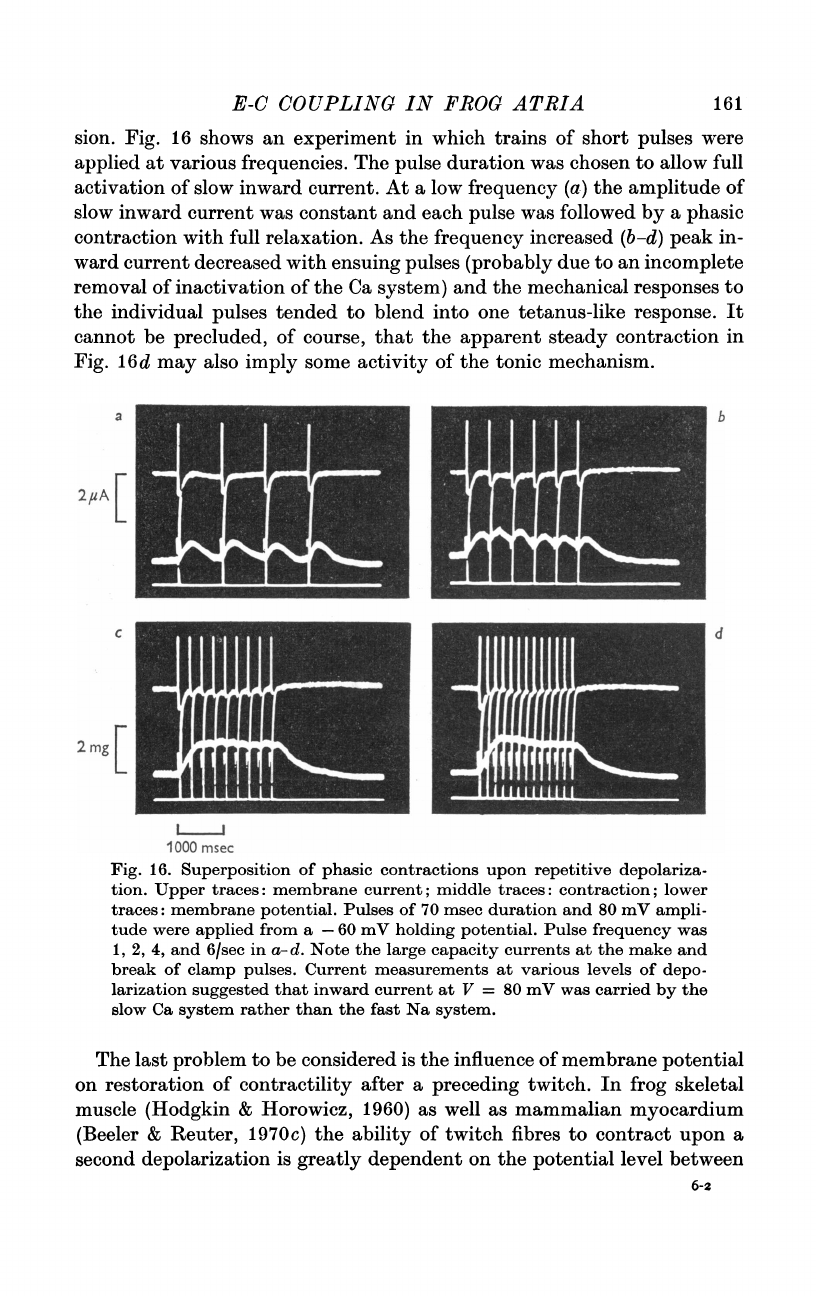
sion.
Fig.
16
shows
an
experiment
in
which
trains
of
short
pulses
were
applied
at
various
frequencies.
The
pulse
duration
was
chosen
to
allow
full
activation
of
slow
inward
current.
At
a
low
frequency
(a)
the
amplitude
of
slow
inward
current
was
constant
and
each
pulse
was
followed
by
a
phasic
contraction
with
full
relaxation.
As
the
frequency
increased
(b-d)
peak
in-
ward
current
decreased
with
ensuing
pulses
(probably
due
to
an
incomplete
removal
of
inactivation
of
the
Ca
system)
and
the
mechanical
responses
to
the
individual
pulses
tended
to
blend
into
one
tetanus-like
response.
It
cannot
be
precluded,
of
course,
that
the
apparent
steady
contraction
in
Fig.
16d
may
also
imply
some
activity
of
the
tonic
mechanism.
a
Cb
c
d
1000
msec
Fig.
16.
Superposition
of
phasic
contractions
upon
repetitive
depolariza-
tion.
Upper
traces:
membrane
current;
middle
traces:
contraction;
lower
traces:
membrane
potential.
Pulses
of
70
msec
duration
and
80
mV
ampli-
tude
were
applied
from
a
-60
mV
holding
potential.
Pulse
frequency
was
1,
2,
4,
and
6/sec
in
a-d.
Note
the
large
capacity
currents
at
the
make
and
break
of
clamp
pulses.
Current
measurements
at
various
levels
of
depo-
larization
suggested
that
inward
current
at
V
=
80
mV
was
carried
by
the
slow
Ca
system
rather
than
the
fast
Na
system.
The
last
problem
to
be
considered
is
the
influence
of
membrane
potential
on
restoration
of
contractility
after
a
preceding
twitch.
In
frog
skeletal
muscle
(Hodgkin
&
Horowicz,
1960)
as
well
as
mammalian
myocardium
(Beeler
&
Reuter,
1970c)
the
ability
of
twitch
fibres
to
contract
upon
a
second
depolarization
is
greatly
dependent
on
the
potential
level
between
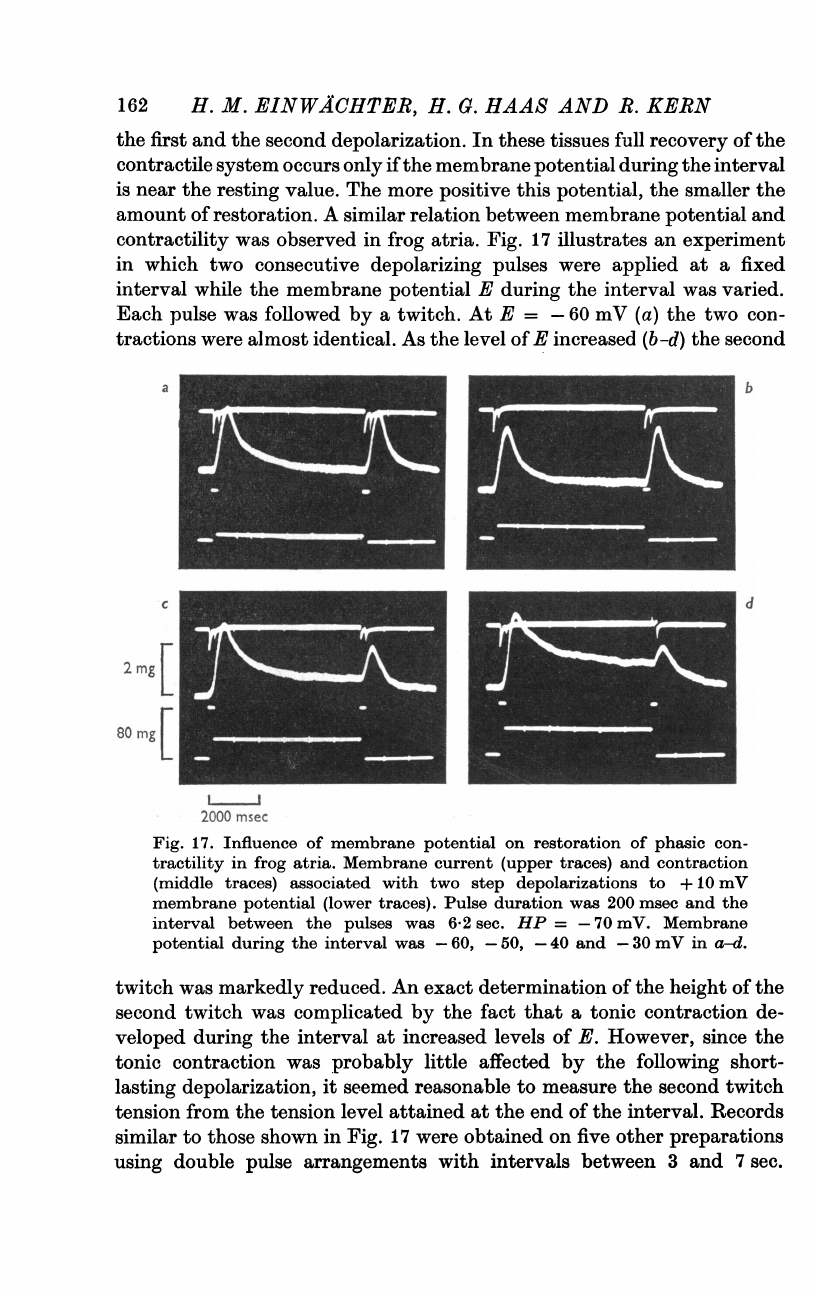
162
H.
M.
RINWACHTER,
H.
a.
HAAS
AND
R.
KERN
the
first
and
the
second
depolarization.
In
these
tissues
full
recovery
of
the
contractile
system
occurs
only
if
the
membrane
potential
during
the
interval
is
near
the
resting
value.
The
more
positive
this
potential,
the
smaller
the
amount
of
restoration.
A
similar
relation
between
membrane
potential
and
contractility
was
observed
in
frog
atria.
Fig.
17
illustrates
an
experiment
in
which
two
consecutive
depolarizing
pulses
were
applied
at
a
fixed
interval
while
the
membrane
potential
E
during
the
interval
was
varied.
Each
pulse
was
followed
by
a
twitch.
At
E
=
-60
mV
(a)
the
two
con-
tractions
were
almost
identical.
As
the
level
of
E
increased
(b-d)
the
second
a
~~~~~~~~~~~~~~~~~~~~~~b
C
d
2
mg[
80
mg
2000
msec
Fig.
17.
Influence
of
membrane
potential
on
restoration
of
phasic
con-
tractility
in
frog
atria.
Membrane
current
(upper
traces)
and
contraction
(middle
traces)
associated
with
two
step
depolarizations
to
+
10
mV
membrane
potential
(lower
traces).
Pulse duration
was
200
msec
and
the
interval
between
the
pulses
was
6
2
sec.
HP
=
-70
mY.
Membrane
potential
during
the
interval
was
-
60,
-
50,
-40
and
-30
mY
in
a-d.
twitch
was
markedly
reduced.
An
exact
determination
of
the
height
of
the
second
twitch
was
complicated
by
the
fact
that
a
tonic
contraction
de-
veloped
during
the
interval
at
increased
levels
of
E.
However,
since
the
tonic
contraction
was
probably
little
affected
by
the
following
short-
lasting
depolarization,
it
seemed
reasonable
to
measure
the
second
twitch
tension
from
the
tension
level
attained
at
the
end
of
the
interval.
Records
similar
to
those
shown
in
Fig.
17
were
obtained
on
five
other
preparations
using
double
pulse
arrangements
with
intervals
between
3
and
7
sec.
E-C
COUPLING
IN
FROG
ATRIA
Restoration
of
the
contractile
system
(expressed
as
the
ratio
of
the
second
and
the
first
twitch
tension)
was
half
complete
at
membrane
potentials
around
-45
mV.
An
incomplete
restoration
of
the
contractile
system
at
a
depolarized
level
might
be
explained
by
assuming
a
steady-state
inactivation
of
the
Ca
system.
A
comparison
between
Fig.
17a,
c
and
d
shows
a
marked
decrease
in
peak
inward
current
during
the
second
depolarization
when
E
was
positive
to
-40
mV.
It
seems
probable
that
in
this
experiment
the
majority
of
inward
current
was
carried
by
Ca
ions.
This
follows
from
the
fact
that
in
Fig.
17b,
with
E
=
-50
mV,
the
inward
current
of
the
test
pulse
was
only
slightly
reduced.
At
this
level
of
E,
however,
an
almost
complete
inactivation
of
the
fast
Na
system
is
expected
(Haas
et
al.
1971).
DISCUSSION
An
essential
point
of
the
results
presented
here
is
the
occurrence
of
two
types
of
tension
development
in
voltage-clamped
frog
atrial
fibres,
namely,
a
phasic
(transient)
contraction
in
response
to
short-lasting
depolariza-
tions
and
a
tonic
(sustained)
contraction
during
prolonged
depolarizations.
This
is
in
general
agreement
with
the
observations
of
Leoty
et
al.
(1970)
and
Vassort
et
al.
(1971)
on
frog
atrial
tissue
but
in
conflict
with
the
findings
of
Morad
&
Orkand
(1971)
who
reported
that
any
contraction
in
frog
ventricle
was
related
to
a
tonic
mechanism.
Since
a
principal
difference
between
atrial
and
ventricular
activity
seems
unlikely,
the
conflicting
results
are
probably
due
to
different
experimental
conditions.
The
apparent
absence
of
a
phasic
response
in
Morad
&
Orkand's
experiments
could
be
explained
by
the
fact
that
a
low
external
Ca
concentration
(0.2
mm)
was
used
(this
leads,
according
to
our
observations,
to
a
strong
reduction
of
phasic
contractions
but
only
a
slight
decrease
of
tonic
tension
compared
to
those
in
normal
Ringer,
cf.
Fig.
14).
Another
possible
explanation
could
be
that
a
sufficient
voltage
control
may
have
been
difficult
to
obtain
with
the
voltage
clamp
arrangement
employed
by
these
authors
(strips
of
an
effective
length
of
0
3-0
5
mm
might
be
too
long
for
a
uniform
distribution
of
the
current
injected).
In
spite
of
significant
differences
in
the
appearance
of
the
two
types
of
contraction,
it
seems
fairly
safe
to
assume
that
the
process
of
activating
the
contractile
apparatus
is
the
same
in
both
cases,
namely,
an
increase
of
the
intracellular
concentration
of
free
Ca,
[Ca2+]i,
above
a
certain
level
(about
10-7
M)
which
is
necessary
to
catalyze
a
splitting
of
adenosine
tri-
phosphate
(Caldwell
&
Walster,
1963;
Portzehl,
Caldwell
&
Ruegg,
1964;
Weber,
Herz
&
Reiss,
1967;
Fuchs
&
Briggs,
1968;
Ebashi,
Endo
&
Ohtsuki,
1969;
Sands
&
Winegrad,
1970;
Winegrad,
1971).
From
this,
the
163
164
H.
M.
EINWACHTER,
H.
C.
HAAS
AND
R.
KERN
real
difference,
if
any,
between
a
phasic
and
a
tonic
contraction
should
lie
in
the
mechanism
by
which
an
increase
of
[Ca2+1h
is
effectuated.
Ca
current
and
activation
of
contraction.
Concerning
the
phasic
contrac-
tion,
a
correlation
with
a
transmembrane
inward
movement
of
Ca
ions
induced
by
depolarization
seems
evident
from
our
data.
The
coincidence
of
the
mechanical
threshold
with
the
threshold
potential
of
slow
(Ca)
in-
ward
current,
the
observation that
both
peak
tension
and
slow
inward
current
were
maximal
at
inside
positive
potentials
and
decreased
with
strong
depolarizations
(Fig.
5),
the
abolition
of
contraction
upon
removal
of
external
Ca
ions
(Fig.
14)
or
application
of
Ca
inhibitors
(Fig.
15)
all
suggest
that
it
is
the
Ca
inward
current
which
is
responsible
for
initiation
of
a
phasic
contraction.
Moreover,
the
occasional
incidence
of
a
phasic
contraction
at
the
break
of
a
depolarizing
clamp
(Fig.
10)
may
be
inter-
preted
in
terms
of
a
Ca
inward
current
induced
by
repolarization,
and
the
effect
of
membrane
potential
on
restoration
of
contractility
(Fig.
17)
may
be
explained
by
assuming
a
steady-state
inactivation
of
the
Ca
system
at
depolarized
levels
of
membrane
potential.
Activation
of
contraction
is
apparently
independent
of
the
flow
of
fast
Na
inward
current
since
a
weak
depolarization
which
elicits
a
large
Na
current
will
not
evoke
any
contrac-
tion
(Fig.
5,
upper
left
panel)
and,
secondly,
a
phasic
contraction
is
not
prevented
by
a
steady-state
inactivation
of
the
Na
system
that
leaves
the
Ca
system
intact
(Fig.
6).
In
principle,
the
contractile
phenomena
of
frog
atrial
muscle
listed
above
are
in
accordance
with
those
of
dog
ventricular
myocardium
as
reported
by
Beeler
&
Reuter
(1970b,
c).
In
both
structures
the
normal
precursor
of
a
(phasic)
contraction
is
a
transient
Ca
inward
current.
At
a
detailed
in-
spection,
however,
quantitative
differences
between
amphibian
and
mam-
malian
heart
muscle
come
to
light.
(i)
At
a
given
step
depolarization,
a
certain
duration
of
the
clamp
is
necessary
to
activate
the
Ca
current
and
the
same
is
true
for
activation
of
contraction.
In
frog
atria
the
time
of
depolarization
required
for
full
activation
of
contraction
is
in
the
same
order
of
magnitude
as
the
duration
of
the
corresponding
Ca
inward
current.
In
dog
ventricular
preparations
bathed
in
normal
Tyrode
solution,
con-
traction
is
fully
activated
by
clamp
pulses
10-20
times
longer
than
the
pulses
necessary
for
complete
activation
of
slow
inward
current.
(ii)
In
our
experiments
the
influence
of
depolarization
on
activation
was
an
instan-
taneous
one,
i.e.
the
inotropic
effect
did
not
change
during
repetitive
application
of
a
given
clamp.
In
contrast,
a
typical
staircase
effect
during
subsequent
depolarizations
occurred
in
Beeler
&
Reuter's
(1970c)
experi-
ments
on
preparations
kept
in
normal
Tyrode.
These
results
are
in
line
with
observations
of
Antoni
et
al.
(1969)
who
found
that
a
change
in
the
duration
of
consecutive
action
potentials
induced
by
polarizing
currents
had
E-C
COUPLING
IN
FROG
ATRIA
a
full,
immediate
effect
on
any
corresponding
twitch
of
the
frog's
myo-
cardium,
while
in
mammalian
heart
structures
the
inotropic
effect
de-
veloped
gradually.
The
apparent
lack
of
a
staircase
effect
in
frog
atrial
tissue
is
consistent
with
observations
on
-frog
ventricle
(Niedergerke,
1956)
indicating
that
a
distinct
staircase
requires
a
preceding
rest
period
of
15-20
min
which
brings
the
preparation
into
a
'hypodynamic
state'
(e.g.
Clark,
1913).
Since
our
procedure
was
to
apply
stimuli
or
clamps
at
in-
tervals
of
10-60
sec
throughout
an
experiment,
a
hypodynamic
state
did
probably
not
occur.
The
different
contractile
behaviour
of
mammalian
and
amphibian
heart
muscle
stated
above
leads
to
a
different
interpretation
of
the
mechanism
of
excitation-contraction
coupling.
According
to
Beeler
&
Reuter
(1970c)
the
discrepancy
between
the
time
courses
of
activation
of
Ca
current
and
of
contraction
in
dog
ventricular
myocardium,
as
well
as
the
existence
of
a
staircase
phenomenon,
are
strong
arguments
for
assuming
that
the
Ca
ions
entering
the
fibres
do
not
directly
activate
the
contractile
proteins
but
join
some
intracellular
store
(probably
elements
of
the
sarcoplasmic
reticulum)
from
which,
as
a
second
step,
an
'activator
Ca'
is
released
into
the
myoplasm.
Conversely,
the
absence
of
comparable
effects
in
frog
heart
fibres
suggests
that
the
inflow
of
Ca
ions
from
the
external
medium
will
reach
the
myofibrils
more
directly
and
a
storage
of
Ca
ions,
if
present
at
all,
does
not
play
a
major
role.
This
view
is
supported
by
the
fact
that
frog
heart
fibres
have
little
or
no
transverse
tubular
system
and
a
rudimentary
sarcoplasmic
reticulum
(Staley
&
Benson,
1968;
Chapman
&
Tunstall,
1971;
Sommer
&
Johnson,
1969).
Net
increase
of
intracellular
Ca
during
activity.
The
correlation
between
influx
of
Ca
ions
into
frog
heart
cells
and
initiation
of
contraction
has
extensively
been
studied
by
Niedergerke
and
co-workers.
Tracer
experi-
ments
(Niedergerke,
1963b)
revealed
a
large
increase
of
both
uptake
and
release
of
Ca
during
activity
and
an
almost
linear
relationship
between
[Ca]o
and
the
extra
influx
of
radioactive
Ca
during
a
twitch.
In
normal
Ringer
fluid
containing
2
mM-Ca,
the
extra
Ca
influx
per
action
potential
came
to
about
2
6,umole/l.
heart
fibres
and
0-23
p-mole/cm2
of
fibre
surface,
respectively.
This
value
may
be
compared
to
the
charge
transfer
due
to
the
flow
of
slow
inward
current
observed
in
our
experiments.
According
to
Figs.
4
and
5,
peak
inward
current
at
moderate
depolariza-
tions
ranges
between
0
3
and
0
7
/tA.
Using
the
average
figures
for
peak
inward
current
of
0
5
4aA
and
for
duration
(rise
and
fall
of
a
slow
inward
current
wave)
of
150
msec,
the
transfer
of
charge
is
estimated
to
be
about
0'5
x
0*5
x
150
x
10-9
A
sec
0*4
x
10-7
C.
This
figure
refers
to
a
segment
of
the
preparation
of
about
0-2
mm
in
length
and
0
5
mm
in
thickness,
i.e.
a
tissue
volume
of
approximately
0-04
mm3
corresponding
to
a
fibre
volume
165
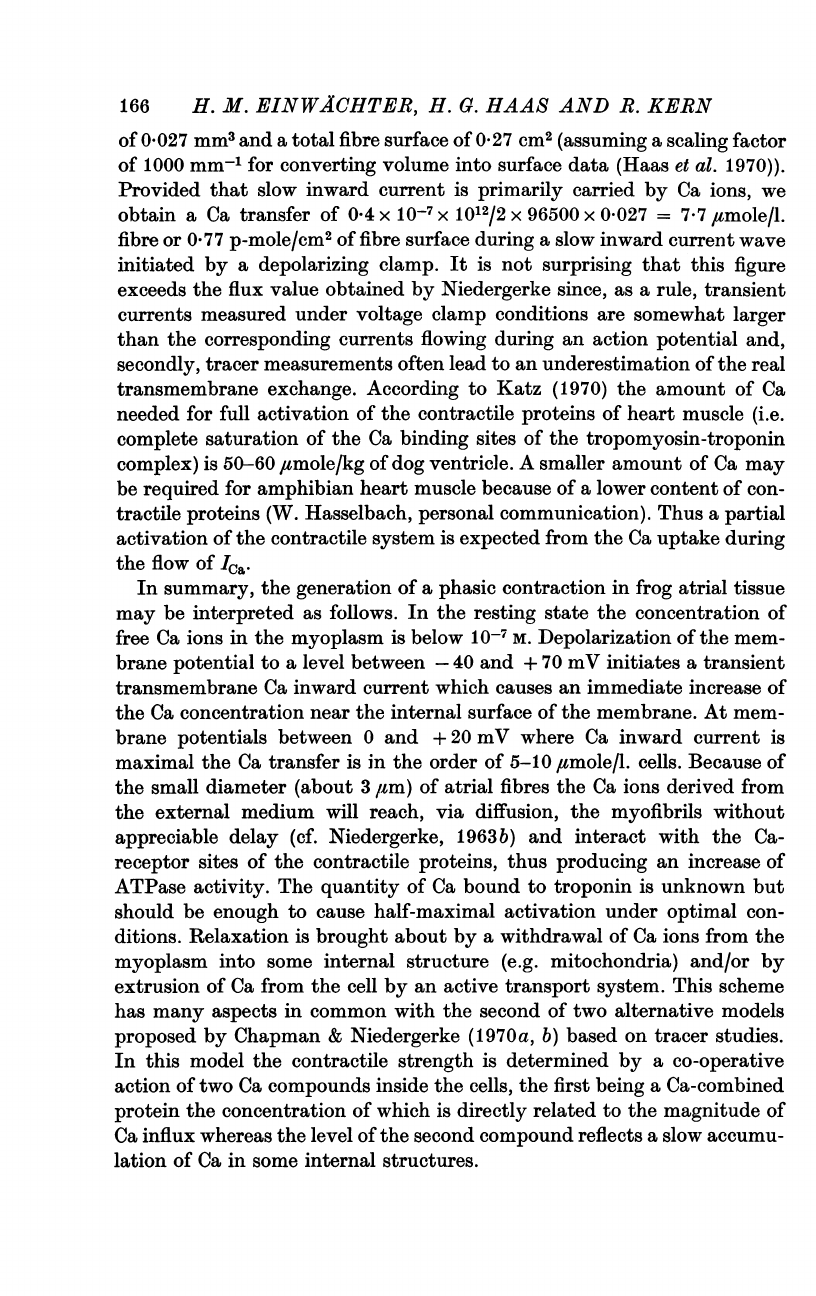
166
H.
M.
EINW4CHTER,
H.
G.
HAAS
AND
R.
KERN
of
0
027
mm3
and
a
total
fibre
surface
of
0
27
cm2
(assuming
a
scaling
factor
of
1000
mm-'
for
converting
volume
into
surface
data
(Haas
et
al.
1970)).
Provided
that
slow
inward
current
is
primarily
carried
by
Ca
ions,
we
obtain
a
Ca
transfer
of
0
4
x
10-7
X
1012/2
x
96500
x
0-027
=
7-7
jItmole/l.
fibre
or
0
77
p-mole/cm2
of
fibre
surface
during
a
slow
inward
current
wave
initiated
by
a
depolarizing
clamp.
It
is
not
surprising
that
this
figure
exceeds
the
flux
value
obtained
by
Niedergerke
since,
as
a
rule,
transient
currents
measured
under
voltage
clamp
conditions
are
somewhat
larger
than
the
corresponding
currents
flowing
during
an
action
potential
and,
secondly,
tracer
measurements
often
lead
to
an
underestimation
of
the
real
transmembrane
exchange.
According
to
Katz
(1970)
the
amount
of
Ca
needed
for
full
activation
of
the
contractile
proteins
of
heart
muscle
(i.e.
complete
saturation
of
the
Ca
binding
sites
of
the
tropomyosin-troponin
complex)
is
50-60
/zmole/kg
of
dog
ventricle.
A
smaller
amount
of
Ca
may
be
required
for
amphibian
heart
muscle
because
of
a
lower
content
of
con-
tractile
proteins
(W.
Hasselbach,
personal
communication).
Thus
a
partial
activation
of
the
contractile
system
is
expected
from
the
Ca
uptake
during
the
flow
of
Ica.
In
summary,
the
generation
of
a
phasic
contraction
in
frog
atrial
tissue
may
be
interpreted
as
follows.
In
the
resting
state
the
concentration
of
free
Ca
ions
in
the
myoplasm
is
below
1o-7
M.
Depolarization
of
the
mem-
brane
potential
to
a
level
between
-40
and
+
70
mV
initiates
a
transient
transmembrane
Ca
inward
current
which
causes
an
immediate
increase
of
the
Ca
concentration
near
the
internal
surface
of
the
membrane.
At
mem-
brane
potentials
between
0
and
+20
mV
where
Ca
inward
current
is
maximal
the
Ca
transfer
is
in
the
order
of
5-10
,umole/l.
cells.
Because
of
the
small
diameter
(about
3
/Lm)
of
atrial
fibres
the
Ca
ions
derived
from
the
external
medium
will
reach,
via
diffusion,
the
myofibrils
without
appreciable
delay
(cf.
Niedergerke,
1963b)
and
interact
with
the
Ca-
receptor
sites
of
the
contractile
proteins,
thus
producing
an
increase
of
ATPase
activity.
The
quantity
of
Ca
bound
to
troponin
is
unknown
but
should
be
enough
to
cause
half-maximal
activation
under
optimal
con-
ditions.
Relaxation
is
brought
about
by
a
withdrawal
of
Ca
ions
from
the
myoplasm
into
some
internal
structure
(e.g.
mitochondria)
and/or
by
extrusion
of
Ca
from
the
cell
by
an
active
transport
system.
This
scheme
has
many
aspects
in
common
with
the
second
of
two
alternative
models
proposed
by
Chapman
&
Niedergerke
(1970a,
b)
based
on
tracer
studies.
In
this
model
the
contractile
strength
is
determined
by
a
co-operative
action
of
two
Ca
compounds
inside
the
cells,
the
first
being
a
Ca-combined
protein
the
concentration
of
which
is
directly
related
to
the
magnitude
of
Ca
influx
whereas
the
level
of
the
second
compound
reflects
a
slow
accumu-
lation
of
Ca
in
some
internal
structures.
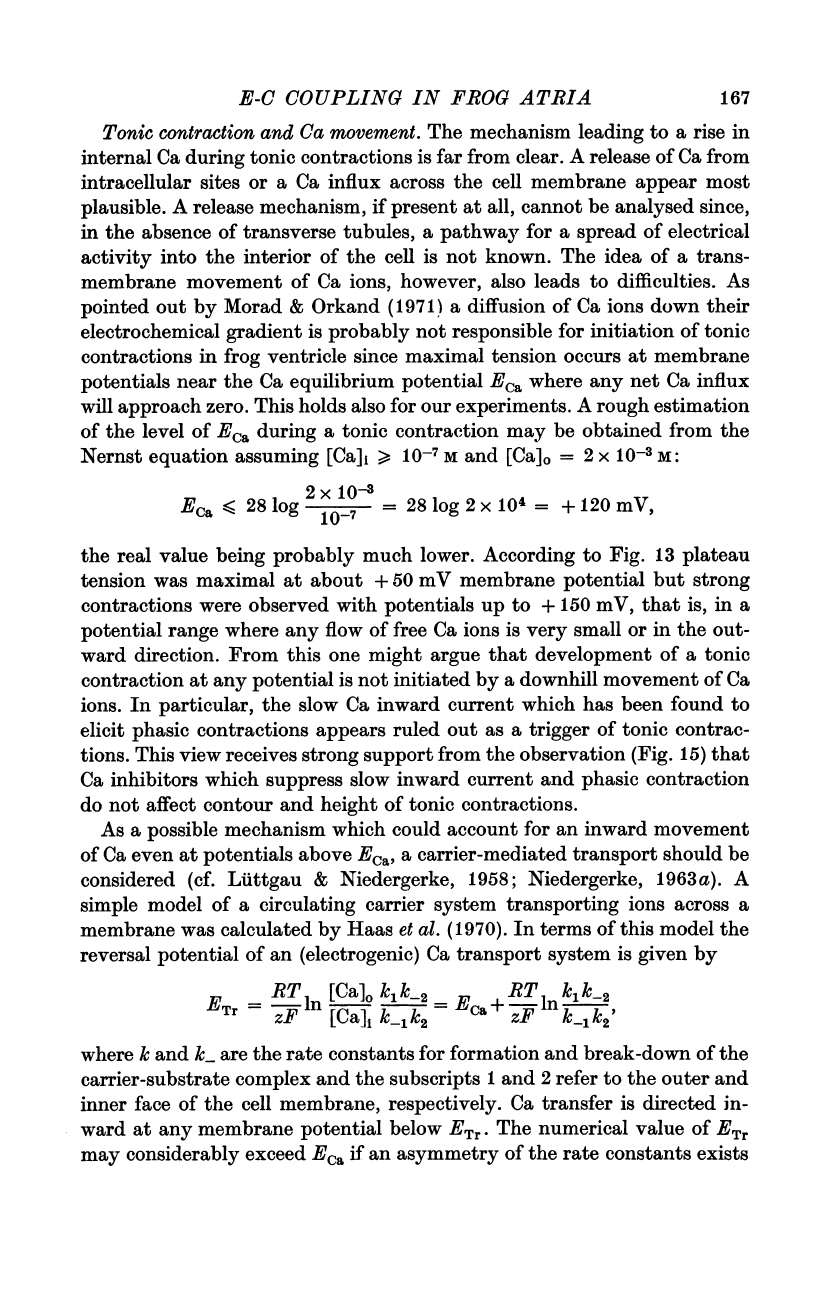
E-C
COUPLING
IN
FROG
ATRIA
Tonic
contraction
and
Ca
movement.
The
mechanism
leading
to
a
rise
in
internal
Ca
during
tonic
contractions
is
far
from
clear.
A
release
of
Ca
from
intracellular
sites
or
a
Ca
influx
across
the
cell
membrane
appear
most
plausible.
A
release
mechanism,
if
present
at
all,
cannot
be
analysed
since,
in
the
absence
of
transverse
tubules,
a
pathway
for
a
spread
of
electrical
activity
into
the
interior
of
the
cell
is
not
known.
The
idea
of
a
trans-
membrane
movement
of
Ca
ions,
however,
also
leads
to
difficulties.
As
pointed
out
by
Morad
&
Orkand
(1971)
a
diffusion
of
Ca
ions
down
their
electrochemical
gradient
is
probably
not
responsible
for
initiation
of
tonic
contractions
in
frog
ventricle
since
maximal
tension
occurs
at
membrane
potentials
near
the
Ca
equilibrium
potential
ECa
where
any
net
Ca
influx
will
approach
zero.
This
holds
also
for
our
experiments.
A
rough
estimation
of
the
level
of
Eca
during
a
tonic
contraction
may
be
obtained
from
the
Nernst
equation
assuming
[Ca],
>
10-7
M
and
[Ca].
=
2
x
10-3
M:
Eca
<
28
log
=28og
2x104
=
+
120
mV,
the
real
value
being
probably
much
lower.
According
to
Fig.
13
plateau
tension
was
maximal
at
about
+
50
mV
membrane
potential
but
strong
contractions
were
observed
with
potentials
up
to
+
150
mV,
that
is,
in
a
potential
range
where
any
flow
of
free
Ca
ions
is
very
small
or
in
the
out-
ward
direction.
From
this
one
might
argue
that
development
of
a
tonic
contraction
at
any
potential
is
not
initiated
by
a
downhill
movement
of
Ca
ions.
In
particular,
the
slow
Ca
inward
current
which
has
been
found
to
elicit
phasic
contractions
appears
ruled
out
as
a
trigger
of
tonic
contrac-
tions.
This
view
receives
strong
support
from
the
observation
(Fig.
15)
that
Ca
inhibitors
which
suppress
slow
inward
current
and
phasic
contraction
do
not
affect
contour
and
height
of
tonic
contractions.
As
a
possible
mechanism
which
could
account
for
an
inward
movement
of
Ca
even
at
potentials
above
Eca,
a
carrier-mediated
transport
should
be
considered
(cf.
Littgau
&
Niedergerke,
1958;
Niedergerke,
1963a).
A
simple
model
of
a
circulating
carrier
system
transporting
ions
across
a
membrane
was
calculated
by
Haas
et
al.
(1970).
In
terms
of
this
model
the
reversal
potential
of
an
(electrogenic)
Ca
transport
system
is
given
by
RT
[Ca]0
k1c
12
E
lT
k1ck-2
ETr
g-
ln
FCa]
=
a
+
-c
ln
zE
[C]
k_1k2
-C
zF
k-lk2l
where
k
and
k-
are
the
rate
constants
for
formation
and
break-down
of
the
carrier-substrate
complex
and
the
subscripts
1
and
2
refer
to
the
outer
and
inner
face
of
the
cell
membrane,
respectively.
Ca
transfer
is
directed
in-
ward
at
any
membrane
potential
below
ETr.
The
numerical
value
of
ETr
may
considerably
exceed
Eca
if
an
asymmetry
of
the
rate
constants
exists
167
168
H.
M.
EINWACHTER,
H.
G.
HAAS
AND
R.
KERN
so
that
k1l/k1
>
k2/k12.
Such
an
asymmetry
might
be
due
to
an
interaction
of
some
physical
or
chemical
agent
with
the
reaction
between
carrier
and
substrate.
To
adapt
the
model
to
the
experimental
data
one
must
assume
a
marked
activation
of
Ca
transfer
with
membrane
potential
positive
to
-30
mV.
This
could
be
explained
by
an
alteration
of
the
kinetical
para-
meters
of
the
system
(rate
constants
and
carrier
mobility)
either
as
a
direct
effect
of
a
change
of
the
electric
field
within
the
membrane
or
as
a
result
of
membrane
current
flow
initiated
by
depolarization
(e.g.
activa-
tion
of
an
enzyme
by
accumulation
of
a
certain
ion
in
some
region
of
the
membrane).
The
latter
hypothesis
is
attractive
particularly
with
respect
to
K
outward
current
(Morad
&
Orkand,
1971).
However,
preliminary
voltage
clamp
experiments
in
which
K
membrane
conductance
was
greatly
altered
by
varying
external
K
concentration
failed
to
reveal
any
simple
relation
between
tonic
contraction
and
movement
of
K
ions
(H.
M.
Einwachter,
H.
G.
Haas
&
R.
Kern,
unpublished
data).
A
further
argu-
ment
which
does
not
favour
the
idea
of
a
linkage
between
K
outward
current
and
activation
of
a
tonic
contraction
is
the
observation
(Figs.
8,
10,
and
14)
that
during
strong
depolarizations
outward
current
may
con-
tinuously
rise
whereas
tension
remains
constant
or
slowly
declines.
In
any
case
the
mechanism
of
activation
of
such
a
Ca-carrying
system
is
not
clear.
The
slight
decrease
in
tension
observed
at
membrane
potentials
positive
to
+
50
mV
(cf.
Fig.
13)
could
be
due
to
a
reduction
of
the
driving
force
of
carrier-mediated
transport
as
E
approaches
ETr.
The
magnitude
of
Ca
transfer
underlying
a
tonic
contraction
cannot
be
determined
from
our
data.
If
it
is
true
that
Ca
enters
the
cell
via
an
electrogenic
mechanism
during
the
entire
duration
of
contraction,
Ca
transfer
is
equivalent
to
a
component
of
steady-state
membrane
current.
In
view
of
the
complex
nature
of
this
current
(Noble
&
Tsien,
1968,
1969a,
b;
Brown
&
Noble,
1969a,
b)
any
reliable
estimation
of
Ca
transfer
seems
impossible
at
present.
Tracer
experiments
on
frog
ventricle
(Nieder-
gerke,
1963a)
showed
a
large
increase
of
Ca
influx
during
K-induced
con-
tractures.
In
these
experiments
addition
of
100
mM-KCl
to
Ringer
fluid
containing
1
mM-Ca
and
100
%
Na
caused
a
depolarization
of
about
60
mV
followed
by
a
very
weak
contracture
and
an
increase
in
Ca
influx
of
about
1-2
gmole/l.
sec.
Since
this
'threshold
contracture'
was
not
more
than
10
%
of
maximal
twitch
tension
and
twitch
tension
is
much
smaller
than
maxi-
mum
tension
produced
under
voltage
clamp
conditions,
one
may
imagine
that
strong
contractures
are
correlated
with
a
Ca
uptake
in
the
order
of
10-20
,umole/l.
sec.
Assuming
that
the
Ca
taken
up
is
uniformly
distributed
within
the
sarcoplasm,
activation
of
the
contractile
proteins
could
be
half-maximal
or
more.
Action
potential
and
mechanical
activity.
In
conclusion,
the
relative
con-
E-C
COUPLING
IN
FROG
ATRIA
tribution
of
phasic
and
tonic
contraction
to
normal
cardiac
activity
is
to
be
considered.
The
rapid
upstroke
and
plateau
of
frog
atrial
action
poten-
tials
may
be
compared
to
a
voltage
clamp
of
about
100
mV
amplitude
and
several
hundred
msec
duration.
From
this,
an
almost
complete
activation
of
ICa
and
phasic
contraction,
but
an
incomplete
activation
of
tonic
con-
traction,
is
expected.
However,
the
tonic
mechanism
may
exceed
the
phasic
contraction
in
absolute
magnitude
(cf.
Fig.
13).
Evidence
for
the
occurrence
of
a
phasic
component
of
contraction
may
be
obtained
from
the
obser-
vation
(Fig.
3b)
that
t1110
of
twitch
tension
is
in
the
order
of
100
msec
rather
than
200
msec
as
would
be
expected
in
the
case
of
a
pure
tonic
con-
traction.
Since
the
phasic
component
has
a
time
to
peak
of
about
400
msec,
its
contribution
to
tension
development
during
the
later
phases
of
an
action
potential
of
about
1
sec
duration
should
be
relatively
small.
Thus
the
tonic
mechanism
is
supposed
to
be
the
chief
determinant
of
the
inotropic
state
of
frog
atrial
muscle
during
the
second
half
of
the
action
potential
which
covers
the
crest
of
contraction.
Note
added
in
proof
After
this
paper
was
submitted,
a
paper
of
Vassort
&
Rougier
(Pfliigers
Arch.
ges.
Phy.siol.
(1972),
331,
191-203)
was
published
which
covers
part
of
the
results
reported
here.
Our
thanks
are
due
to
the
Deutsche
Forschungsgemeinschaft
and
the
Stiftung
Volkswagenwerk
for
financial
support,
to
Mr
C.
Benninger
for
a
careful
analysis
of
the
experimental
data,
and
to
Mr
H.
Muller
for
technical
assistance.
REFERENCES
ANTONI,
H.
&
DELIUS,
W.
(1965).
Nadhweis
von
zwei
Komponenten
in
der
Anstiegs-
phase
des
Aktionspotentials
von
Froschmyokardfasern.
Pfluiger8
Arch.
ges.
Physiol.
283,
187-202.
ANTONI,
H.,
JACOB,
R.
&
KAUFMANN,
R.
(1969).
Mechanische
Reaktionen
des
Frosch-
und
Saugetiermyokards
bei
Veranderung
der
Aktionspotential-Dauer
durch
konstante
Gleichstromimpulse.
Pfluigers
Arch.
ges.
Physiol.
306,
33-57.
BEELER,
G.
W.
JR.
&
REUTER,
H.
(1970a).
Voltage
clamp
experiments
on
ventri-
tricular
myocardial
fibres.
J.
Physiol.
207,
165-190.
BEELER,
G.
W.
JR.
&
REUTER,
H.
(1970
b).
Membrane
calcium
current
in
ventricular
myocardial
fibres.
J.
Physiol.
207,
191-209.
BEELER,
G.
W.
JR.
&
REUTER,
H.
(1970c).
The
relation
between
membrane
poten-
tial,
membrane
currents
and
activation
of
contraction
in
ventricular
myocardial
fibres.
J.
Physiol.
207,
211-229.
BROWN,
H.
F.
&
NOBLE,
S.
J.
(1969a).
Membrane
currents
underlying
delayed
rectification
and
pace-maker
activity
in
frog
atrial
muscle.
J.
Physiol.
204,
717-736.
BROWN,
H.
F.
&
NOBLE,
S.
J.
(1969
b).
A
quantitative
analysis
of
the
slow
component
of
delayed
rectification
in
frog
atrium.
J.
Physiol.
204,
737-747.
169
170
H.
M.
EINWACHTER,
H.
G.
HAAS
AND
R.
KERN
CALDWELL,
P.
C.
&
WALSTER,
G.
(1963).
Studies
on
the
micro-injection
of
various
substances
into
crab
muscle
fibres.
J.
Physiol.
169,
353-372.
CHAPMAN,
R.
A.
&
NIEDERGERKE,
R.
(1970a).
Effects
of
calcium
on
the
contraction
of
the
hypodynamic
frog
heart.
J.
Physiol.
211,
389-421.
CHAPMAN,
R.
A.
&
NIEDERGERKE,
R.
(1970b).
Interaction
between
heart
rate
and
calcium
concentration
in
the
control
of
contractile
strength
of
the
frog
heart.
J.
Physiol.
211,
423-443.
CHAPMAN,
R.
A.
&
TuNSTALL,
J.
(1971).
The
dependence
of
the
contractile
force
generated
by
frog
auricular
trabeculae
upon
the
external
calcium
concentration.
J.
Physiol.
215,
139-162.
CLARK,
A.
J.
(1913).
The
action
of
ions
and
lipoids
upon
the
frog's
heart.
J.
Physiol.
47,
66-107.
EBASHI,
S.,
ENDO,
M.
&
OHTSUKI,
I.
(1969).
Control
of
muscle
contraction.
Q.
Rev.
Biophys.
2,
351-384.
FOZZARD,
H.
A.
&
HELLAM,
D.
C.
(1968).
Relationship
between
membrane
voltage
and
tension
in
voltage-clamped
cardiac
Purkinje
fibres.
Nature,
Lond.
218,
588-589.
FUCHS,
F.
&
BRIGGs,
F.
N.
(1968).
The
site
of
calcium
binding
in
relation
to
the
activation
of
myofibrillar
contraction.
J.
gen.
Physiol.
51,
655-676.
GIBBONS,
W.
R.
&
FOZZARD,
H.
A.
(1971).
Voltage
dependence
and
time
dependence
of
contraction
in
sheep
cardiac
Purkinje
fibers.
Circulation
Res.
28,
446-460.
GOTO,
M.,
KIMOTO,
Y.
&
KATO,
Y.
(1971).
A
study
on
the
excitation-contraction
coupling
of
the
bullfrog
ventricle
with
voltage
clamp
technique.
Jap.
J.
Physiol.
21,
159-173.
HAAS,
H.
G.,
KERN,
R.
&
EINWACHTER,
H. M.
(1970).
Electrical
activity
and
meta-
bolism
in
cardiac
tissue:
An
experimental
and
theoretical
study.
J.
Membrane
Biol.
3,
180-209.
HAAS,
H.
G.,
KERN,
R.,
EINWACHTER,
H.
M.
&
TARR,
M.
(1971).
Kinetics
of
Na
inactivation
in
frog
atria.
Pfluigerm
Arch.
ges.
Physiol.
323,
141-157.
HAGIWARA,
S.
&
NAKAJIMA,
S.
(1966).
Differences
in
Na
and
Ca
spikes
as
examined
by
application
of
tetrodotoxin,
procaine,
and
manganese
ions.
J.
gen.
Physiol.
49,
793-806.
HODGKIN,
A.
L.
&
HOROWICZ,
P.
(1960).
Potassium
contractures
in
single
muscle
fibres.
J.
Physiol.
153,
386-403.
KATZ,
A.
M.
(1970).
Contractile
proteins
of
the
heart.
Physiol.
Rev.
50,
63-158.
KAVALER,
F.
(1959).
Membrane
depolarization
as
a
cause
of
tension
development
in
mammalian
ventricular
muscle.
Am.
J.
Physiol.
197,
968-970.
LAOTY,
C.,
RAYMOND,
G.
&
GARGOUIL,
Y.
M.
(1970).
Tension
phasique
et
tonique
de
la
fibre
myocardique
de
grenouille
et
les
courants
ioniques
transmembranaires;
6tude
en
voltage
impose
et
par
microphotom6trie.
C.
r.
hebd.
Seanc.
Acad.
Sci.,
Paris
271,
1545-1548.
LUTTGAU,
H.
C.
&
NIEDERGERKE,
R.
(1958).
The
antagonism
between
Ca
and
Na
ions
on
the
frog's
heart.
J.
Physiol.
143,
486-505.
McGUIGAN,
J.
A.
S.
(1968).
Tension
in
ventricular
fibres
during
a
voltage
clamp.
Helv.
physiol.
pharmac.
Acta
26,
CR
362-363.
MORAD,
M.
&
ORKAND,
R.
K.
(1971).
Excitation-contraction
coupling
in
frog
ventricle:
Evidence
from
voltage
clamp
studies.
J.
Physiol.
219,
167-189.
MORAD,
M.
&
TRAUTWEIN,
W.
(1968).
The
effect
of
the
duration
of
the
action
poten-
tial
on
contraction
in
the
mammalian
heart
muscle.
Pfliigers
Arch.
ges.
Physiol.
299,
66-82.
NIEDERGERKE,
R.
(1956).
The
'staircase'
phenomenon
and
the
action
of
calcium
on
the
heart.
J.
Physiol.
134,
569-583.
E-G
COUPLING
IN
FROG
ATRIA
171
NIEDERGERKE,
R.
(1963a).
Movements
of
Ca
in
frog
heart
ventricles
at
rest
and
during
contractures.
J.
Physiol.
167,
515-550.
NIEDERGERKE,
R.
(1963b).
Movements
of
Ca
in
beating
ventricles
of
the
frog
heart.
J.
Physiol.
167,
551-580.
NIEDERGERKE,
R.
&
ORKAND,
R.
K.
(1966).
The
dual
effect
of
calcium
on
the
action
potential
of
the
frog's
heart.
J.
Physiol.
184,
291-l11.
NOBLE,
D.
&
TSIEN,
R.
W.
(1968).
The
kinetics
and
rectifier
properties
of
the
slow
potassium
current
in
cardiac
Purkinje
fibres.
J.
Physiol.
195,
185-214.
NOBLE,
D.
&
TSIEN,
R.
W.
(1969a).
Outward
membrane
currents
activated
in
the
plateau
range
of
potentials
in
cardiac
Purkinje
fibres.
J.
Physiol.
200,
205-231.
NOBLE,
D.
&
TsIEN,
R.
W.
(1969b).
Reconstruction
of
the
repolarization
process
in
cardiac
Purkinje
fibres
based
on
voltage
clamp
measurements
of
membrane
current.
J.
Physiol.
200,
233-254.
ORKAND,
R.
K.
(1968).
Facilitation
of
heart
muscle
contraction
and
its
dependence
on
external
calcium
and
sodium.
J.
Physiol.
196,
311-325.
PORTZEHL,
H.,
CALDWELL,
P.
C.
&
RUEGG,
J.
C.
(1964).
The
dependence
of
contrac-
tion
and
relaxation
of
muscle
fibres
from
the
crab
Maia
squinado
on
the
internal
concentration
of
free
calcium
ions.
Biochim.
Biophys.
Acta
79,
581-591.
ROUGIER,
O.,
VASSORT,
G.,
GARNIER,
D.,
GARGOUIL,
Y.
M.
&
CORABOEUF,
E.
(1969).
Existence
and
role
of
a
slow
inward
current
during
the
frog
atrial
action
potential.
Pfluigerm
Arch.
ges.
Physiol.
308,
91-110.
SANDS,
S.
D.
&
WINEGRAD,
S.
(1970).
Treppe
and
total
calcium
content
of
the
frog
ventricle.
Am.
J.
Physiol.
218,
908-910.
SOMMER,
J.
R.
&
JOHNSON,
E.
A.
(1969).
Cardiac
muscle:
A
comparative
ultra-
structural
study
with
special
reference
to
frog
and
chicken
hearts.
Z.
Zellforsch.
mikrosk.
Anat.
98,
437-468.
STALEY,
N.
A.
&
BENSON,
E.
S.
(1968).
The
ultrastructure
of
frog
ventricular
cardiac
muscle
and
its
relationship
to
mechanisms
of
excitation-contraction
coupling.
J.
cell
Biol.
38,
99-114.
TARR,
M.
(1971).
Two
inward
currents
in
frog
atrial
muscle.
J.
yen.
Physiol.
58,
523-543.
TARR,
M.
&
TRANK,
J.
(1971).
Equivalent
circuit
of
frog
atrial
tissue
as
determined
by
voltage
clamp-unclamp
experiments.
J.
yen.
Physiol.
58,
511-522.
VASSORT,
G.,
ROUGIER,
0.
&
FAVELIER,
J.
(1971).
Influence
du
potential
de
mem-
brane
et
des
courants
transmembranaires
sur
l'activit6
contractile
des
faisceaux
sino-auriculaires
de
la
grenouille.
Arch8
int.
Physiol.
79,
401-406.
WEBER,
A.,
HERZ,
R.
&
REISS,
I.
(1967).
The
nature
of
the
cardiac
relaxing
factor.
Biochim.
biophys.
Acta
131,
188-194.
WINEGRAD,
S.
(1971).
Studies
of
cardiac
muscle
with
a
high
permeability
to
calcium
produced
by
treatment
with
ethylenediaminetetraacetic
acid.
J.
yen.
Physiol.
58,
71-93.
WOOD,
E.
H.,
HEPPNER,
R.
L.
&
WEIDMANN,
S.
(1969).
Inotropic
effects
of
electric
currents.
I.
Positive
and
negative
effects
of
constant
electric
currents
or
current
pulses
applied
during
cardiac
action
potentials.
II.
Hypotheses:
Calcium
move-
ments,
excitation-contraction
coupling
and
inotropic
effects.
Circulation
Res.
24,
409-445.
